
Abstract
Using unmanned aerial vehicles (UAVs) for performing automatic inspection of overhead power lines instead of foot patrols is an attractive option, since doing so is safer and have considerable cost savings, among other advantages. The purpose of this paper is to design a 3D laboratory test-platform to simulate UAVs' inspection of transmission lines and secondly, proposing an automated inspection strategy for UAVs in order to follow transmission lines. The construction and system architecture of our 3D test-platform is described in this paper. The inspection strategy contributes to knowledge pertaining to an automated inspection procedure and includes two steps: flight path planning for UAVs and visual tracking of the transmission lines. The 3D laboratory test-platform is applied to test the performance of the proposed strategy and the tracking results of our inspection strategy are subsequently presented. The availability of the 3D laboratory test-platform and the efficiency of our tracking algorithm are verified by experiments.
Keywords
1. Introduction
Overhead power line inspection is an essential task for the maintenance of electrical grids, since the fault of power transmission equipment can cause power outages, which can directly lead to the failure of nodes in other service providers such as Internet communication networks, hospitals, residential areas, etc. More importantly, power outages will result in large economic losses [1, 2]. Early detection of potential anomalies and timely maintenance can help avoid grid faults and reduce economic losses, further benefitting customers and electricity companies.
The maintenance methodologies currently being used involve two main strategies: foot patrol and manned aerial vehicle inspection. However, these methodologies are in some ways inefficient and expensive. Moreover, helicopter assisted inspection can be dangerous [3]. Recently, methods involving unmanned aerial vehicles (UAVs) have been widely used for various reasons, e.g., it decreases inspection time, improves inspection quality and increases safety [4–9]. It should be noted that observers always indicate defects in electrical equipment by watching videos taken by cameras mounted on UAVs.
In our work, a 3D laboratory test-platform is constructed to simulate the process of UAVs inspecting power lines. In [10], a one-dimensional test-bed is constructed for automatic power line inspection, in which a trolley runs along an aluminium track as a substitute for a helicopter. Since the inspection is always performed in a 3D space, a one dimensional test-bed simulation differs substantially from a real case. Our 3D test-platform, which allows movement in 3D space and which includes detailed scenarios for inspection, is designed to render the simulation more comprehensive.
In [11], the authors provide an overview of an aerial video inspection for power lines. They discuss in detail the motivation of pursuing video inspection techniques, especially in terms of the direction requirements for camera sightlines. Until now, the camera sightline direction has been controlled by an operator in order to keep desired object at the center of image. This is known as target selection and tracking. Target selection and tracking allows the observer to zoom in on an object for greater detail. However, manual target tracking imposes a severe workload on the observer. Therefore, it is desirable to track the overhead power line automatically in order to have the target at the centre of images at all times.
The methodologies of tracking overhead power lines can be categorized into two types. One is based on 3D coordinates (e.g., GPS) of the overhead power lines and UAVs, where the camera sightline direction can be set to be directed at the overhead power line, e.g., as shown in [12]. This approach depends heavily on the accuracy of the position measured, although a small error will result in tracking failed. For the second method, image-based visual servoing is adopted. The most important thing in this method is that the overhead power line must be in the field of view, otherwise it will fail, e.g. [13–14]. In this paper, an inspection strategy is proposed to track the overhead power lines for the camera on UAVs by combining these two strategies. First, a safe flight path is planned for UAVs according to inspection rules and the coordinates of overhead power lines; then, the pose of camera can be computed based on the planned safe flight path. Finally, a vision tracking technique is applied to make fine adjustments for the camera sightline direction in order to ensure the target is at the centre of the image.
The primary contributions of this paper include: a novel design of the 3D test-platform to simulate UAVs' inspection of overhead power lines; secondly, an inspection strategy is proposed for tracking overhead power lines automatically. The rest of this paper is organized as follows. Section II describes the architecture of our test-platform. Section III shows an overview of our inspection strategy. Section IV discusses how to plan the flight path. Section V provides the visual tracking of overhead power lines for the camera. Section VI verifies the feasibility of the test-platform and the inspection strategy, followed by conclusions in section VII.
2. Design of the 3D Test-platform
2.1. Architecture
The architecture of our 3D test-platform is shown in Figure.1. It consists of three sub-systems: a simulated flying system, an intelligent control system and an simulated inspection system.

The architecture of the 3D test-platform
In the simulated flying system, as shown in Figure 1, the 3D motion module can move in 3D space (along the X, Y and Z axes). A PTZ (pan/tilt/zoom) camera is mounted at the end of the Z axis to capture images of inspection targets (as shown in Figure.2). The hardware and driver includes motors, drivers, gears and sensors. These work together to simulate UAVs in flight.

The structure of simulated flying system
In the intelligent control system, the upper computer aims to communicate with the simulated flying system and the displays the status of the entire system. The controller parses commands from the upper computer and controls the movement of the 3D motion module. The safe-protection module combines software and hardware techniques to avoid the motion module from moving out of bounds.
Our simulated inspecting system consists of a navigation module, image process module and miniature scenery. The navigation module can plan a flight path automatically or manually. The image process module is able to capture images for targets, thereby detecting and tracking them; moreover, it sends tracking results to the intelligent control system. The miniature scenery (Figure 3) shows some power line equipment (e.g., overhead power lines, poles, insulators, fittings, etc.) and a complicated background for inspection (e.g. city, grass, fields, buildings, desert, river, animals, etc.). All of the modules work together to simulate UAVs' inspection of overhead power lines.
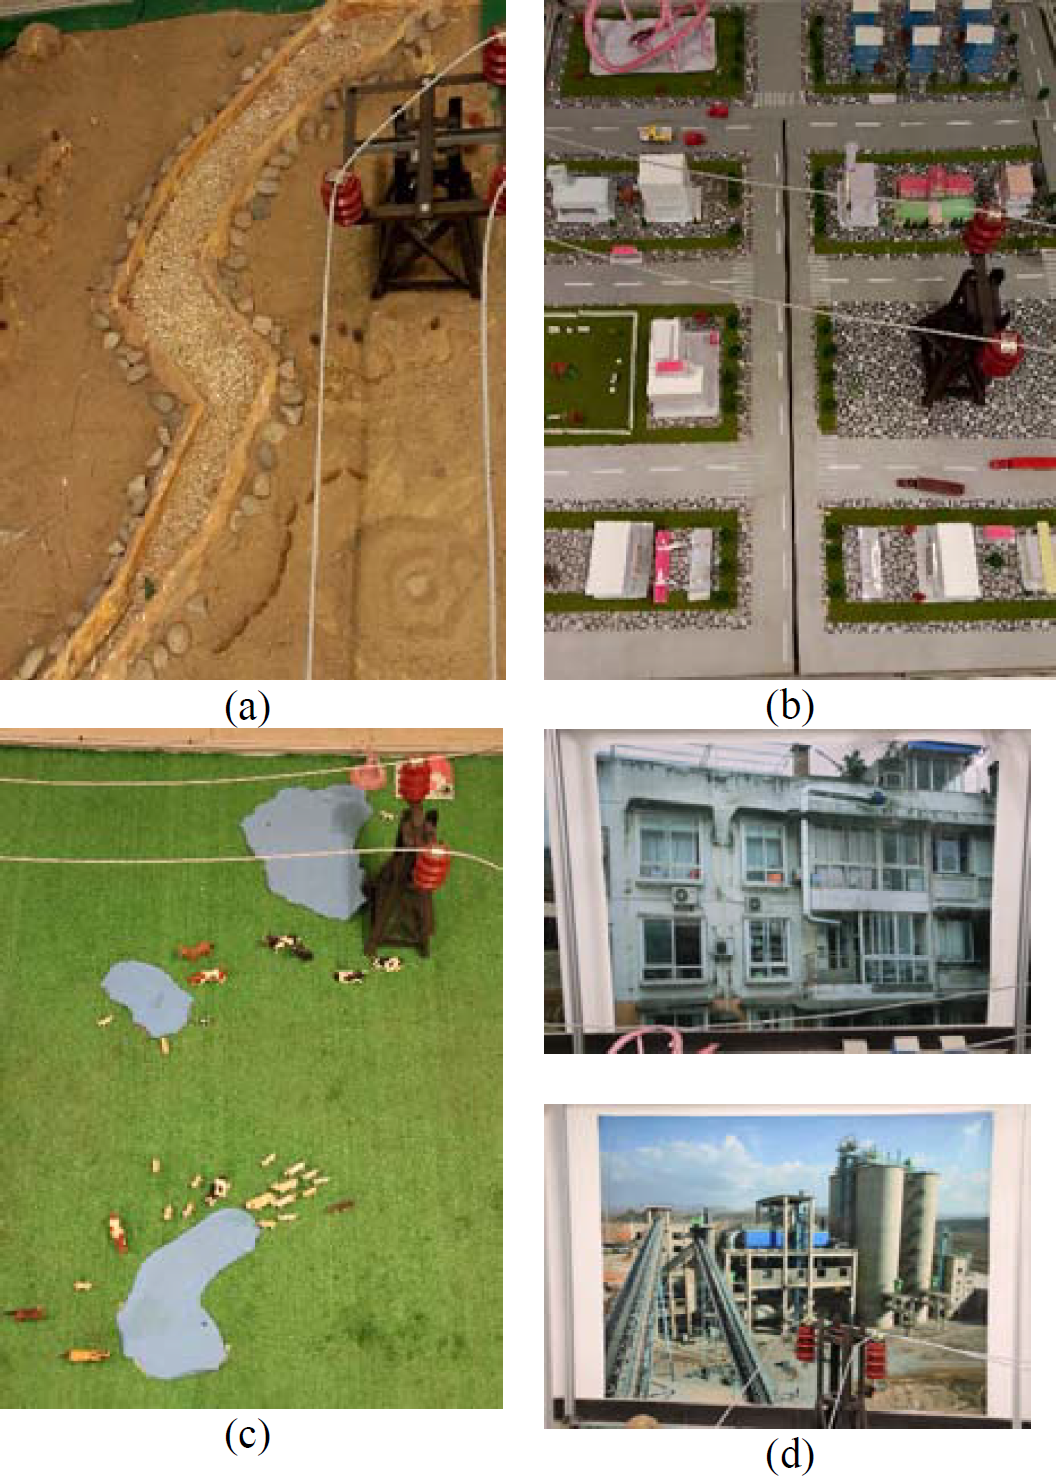
Miniature scenery: (a) power lines over desert; (b) power lines in the city; (c) power lines over grass; (d) power lines near buildings
2.2. Systems analysis
2.2.1. Analysis for 3D motion of the platform
The 3D motion module moves along the X, Y and Z axes using three different motors.
The motion equation in 3D space is shown in (1):

where, x, y and z represent the moving distance of the 3D module along the X, Y and Z axes,


where
Taking a derivative of (1), equation (5) is obtained:

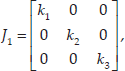
From (5), a Jacobian matrix of translation for the 3D motion module is obtained as follows:
2.2.2. Analysis for the pose of camera
A PTZ camera is mounted at the end of the Z axis of the 3D motion module to capture images of the target. Figure 4 shows the Cartesian coordinate reference frame for the camera, which can be steered in terms of yaw (α) and pitch (β).

Coordinate reference frames definition for the camera
As noted above, it is desirable to keep the target centred. Here, yaw (α) and pitch (β) can be adjusted to make the camera's sightline aim at the target. Assuming that the target locations in (a, b, c) are in the world coordinate frame and its origin is coincident with the camera frame, then the optical axis can be rotated as shown in Figure 5 in order to point at the target. This rotation process is equal to rotate vector

Rotating the camera to point at the target
The detailed process is conducted as follows.
First, by rotating V 0 counter clockwise around the Y axis roughly α degrees, we can receive vector V 1 , as shown in Figure 5(b), where α can be computed by (7).
Then, by rotating V 1 counter clockwise around the X axis roughly β degrees, we can receive vector V, as shown in Figure 5(c), where β is computed by (8):


3. Overview of the Inspection Strategy
Our inspection strategy aims to track overhead power lines automatically and keep them located at the centre of image. An overview of this process is shown in Figure 6 and includes three stages:
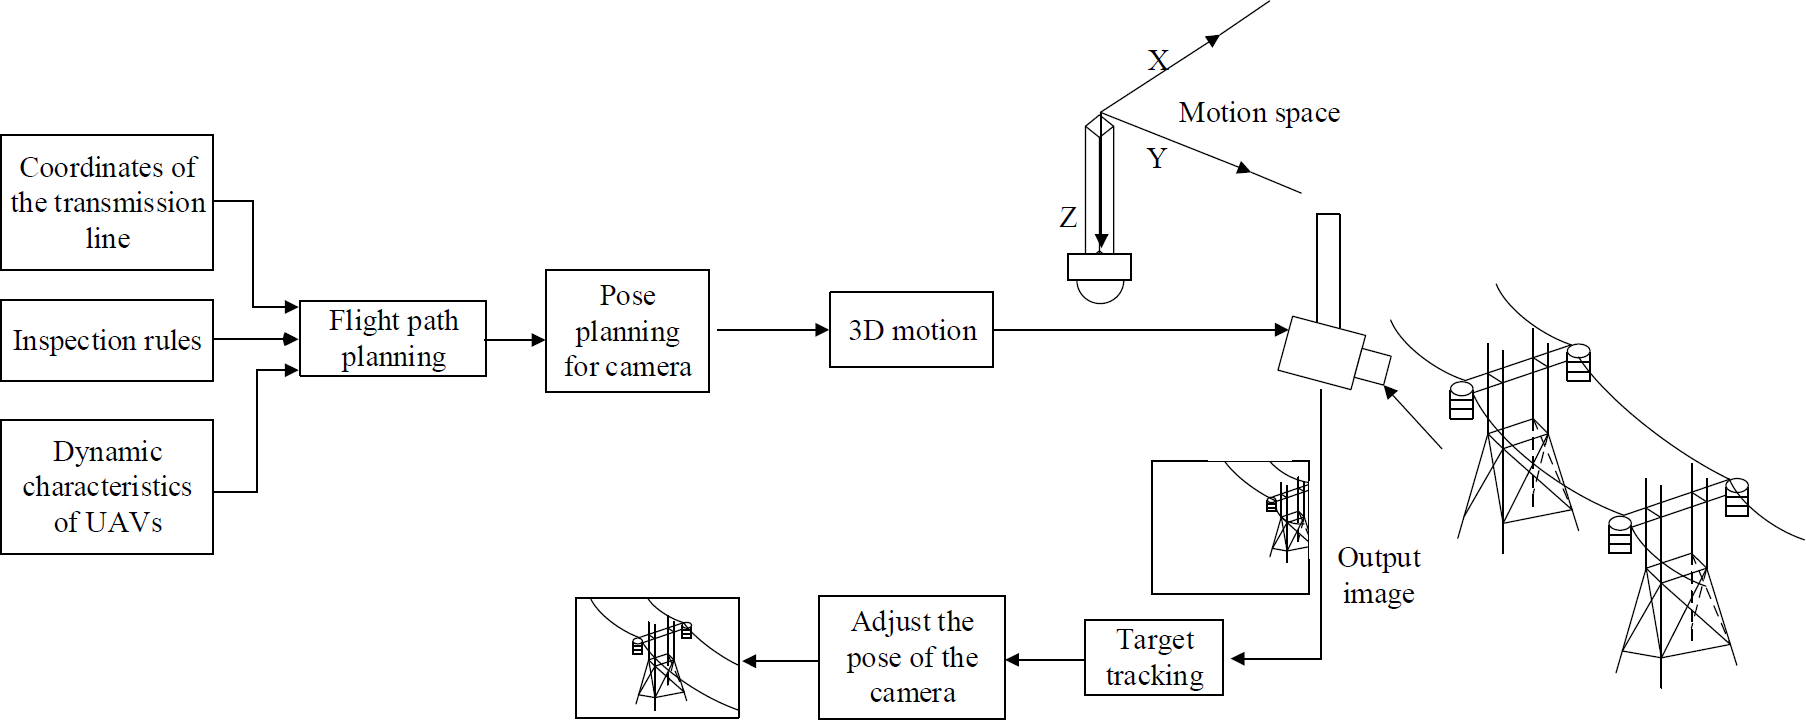
Overview of the overhead power line inspection
Flight path planning: plan the flight path of UAVs to guarantee a safe distance from overhead power lines and improve inspection quality;
Pose planning for camera: plan the pose of camera to have the sightline aimed at target;
Tracking overhead power lines: apply visual servoing techniques to make fine-adjustments to the camera sightline, thereby locating the target at the centre of the image.
4. Flight Path Planning
Regular solutions for flight path planning always generate the shortest possible path by connecting a series of line segments; following on, flight path can be produced by smoothing out these line segments. In contrast, a number of research works applied some curves (e.g. Dubins, Clothoid, PH and B-splined curve) to plan flight path directly [15–19]. However, the path planned by Dubins curves is not feasible for flight, due to its discontinuous curvature. Although Clothoid curves have continuous curvature, when applying these, a compound flight path with low flexibility is generated in a complicated manner. In this paper, a Nurbs curve is directly applied for planning the flight path, due to its continuous and uniform variations of curvature. The flight path planning process includes two steps: planning the referenced flight path and modifying it using a Nurbs curve.
4.1. Referenced flight path planning
In this work, the referenced flight path planning for inspection is defined as follows: given the coordinates of transmission towers and a safe inspection distance, the shortest safe flight path can be planned in 3D space, depending on inspection guidelines and the dynamic characteristics of UAVs. The path must guarantee that UAVs can pass all transmission towers in order to accomplish the inspection task. Due to the small size of UAVs (compared to overhead power lines), for analysis purposes, they can be considered as particles in 3D space.
There are three reasons for planning the referenced flight path. First, UAVs have a maximum mission time, because they are battery powered. The shortest path therefore provides the benefit of reducing flight time. Secondly, inspection company guidelines state that the distance between UAVs and overhead power lines must be larger than simply a safe distance. Finally, contrary to the safe distance, the closer the UAV is to the overhead power line, the clearer the captured images will be. Therefore, it is necessary to plan a flight path that can not only guarantee a safe and effective inspection, but also ensure good images.
The coordinates of transmission towers are represented in the Cartesian coordinates system as
Given a safe distance (represented by D) between UAVs and overhead power lines, the shortest safe flight path can be produced as shown in Figure 7. We begin by connecting the initial control points in turn to produce a set of line segments

Generating the referenced flight path,
It must be noted that movement which illustrated in Figure.7 from
4.2. Modify the referenced flight path using Nurbs curve
The referenced flight path is composed of a series of line segments. If UAVs fly along it directly, this will give rise to serious effects on the stability of movement and result in a path drift. Therefore, the path should be modified to be a smooth one, where the state of motion (e.g., linear velocity, angle velocity) changes continuously to supply the control system with more accurate input. Here, the Nurbs curve is applied to modify the referenced flight path in order to remove sharp corners, thereby achieving the final flight path.
The Nurbs curve is defined by (9):

where p is degree,
5. Tracking Overhead Power Lines
Our tracking strategy aims to track the overhead power lines automatically by following the flight path planned in the previous section. Thus, the PTZ camera mounted on a platform is required for tracking overhead power lines automatically.
According to camera projection theory [20–21], the target will be projected at the centre of the image when the optical axis points at it. To achieve this, two operations are carried out for tracking the overhead power lines:
Plan the pose of camera based on the planned safe flight path and the position of overhead transmission towers;
Track the overhead power lines by applying visual servoing techniques to maintain targets at the centre of the image.
5.1. Pose planning for the camera
We use a six-value vector S(p(x,y,z), l(i,j,k)) to represent the pose of the camera, where p(x,y,z) and l(i,j,k) describe the position of the camera and the direction of the sightline.
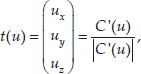
In this paper, p(x,y,z) is assumed as a coincident with the coordinates of UAVs along the flight path and l(i,j,k) is taken as the normal vector of the flight path. This can ensure that the optical axis points at the target. The normal vector of Nurbs can be obtained from equations (10~12) [22]. It must be noted that the direction of the normal vector is only considered in the XY plane; thus, so uz =0. Given the direction of sightline l(x,y,z), yaw (α) and pitch (β) can be obtained according to the method introduced in section 2.2.2.


5.2. Visual tracking for the camera
Ideally, planning the camera pose intends to make the optical axis point at targets; however, it cannot always ensure that targets are located at the centre, due to some sources of error in real applications. For example, the surveying error of transmission tower position in the map. Additionally, UAVs are subject to short-term random motion due to air turbulence (e.g., wind gusting), where the sightline will ‘jitter’ due to the imbalance of the platform. In our work, visual tracking is applied to help the camera track overhead power lines.
Two operations are carried out in the tracking process: target location in images and visual tracking. Target location aims to find the position of overhead power lines in an image. Hough transform is a popular way for detecting overhead power lines; this is effected by detecting straight lines [14,23,24]. The overhead power lines are projected as straight lines because the image is captured just above the power lines. However, considering safety, it is preferable that the UAV flies alongside the overhead power lines. In fact, when viewed from the side, power lines are parabolas; therefore, when flying alongside power lines, they can be projected as parabolas. The overhead power lines in aerial images have the following characteristics:
They are generally the longest line to cross the entire image between two towers;
The overhead power line is made from a special metal that has a uniform brightness in aerial images that is usually brighter than image backgrounds [25];
The background is always complicated such as forest, fields, grassland, river, cities, etc.
Overhead power lines are approximately parallel to each other and their shape is similar, i.e., they are parabolas moving upwards.
The above characteristics can be applied as knowledge for building overhead power line extraction algorithms. In this work, Hough transform is used to detect the parabolas in image, in further to extract the power lines in image. Compared to the colour-based method, detecting the parabolas can overcome the disturbances cause by a complicated background.
Considering the projection character of a parabola, the rotation factor is applied to the Hough transform as (13)[26]:

where a is curvature (h, k) is the vertex point of the parabola and θ is rotational angle.
Similar to detect straight lines using Hough tranform, we set a four-dimension accumulator array Acc(a,θ,h,k) to be voted based on edge points, in further to compute the parameters (a,θ,h,k). However, it will take a significant time to search within a four-dimension array while the inspection requires real-time data. [27] decreased the searching dimensions by adding information about the gradient directions of edges. Although computing time can in this way be decreased, this approach only works when the symmetry axis of the parabola is parallel to the coordinate axis, it cannot be used in overhead power line detection.
Considering the features of overhead power lines, computing time can be decreased by reducing the search range of the accumulator array. The detailed tracking process can be given as follows:
Initial acquisition: the camera is pointed in such a way that overhead power lines appear somewhere in the field of view; the observer specifies the line to be inspected so that an
Edge detection: Canny Edge Detection algorithm is applied to detect all edges in the image;
Overhead power line extraction and tracking: the overhead power lines can be extracted based on their characteristics, e.g., their shape being similar (they all move upwards). It must be noted that when the inspection is performed according to the planned pose of camera, the variation of θ and a must be small. This means that the size of a-dimension and θ-dimension in array Acc(a,θ,h,k) will be reduced. In our work, a particle filter [28–29] is employed to track the parameters
The PTZ camera we use is the VIVOTEK: PZ7121. This camera can steer automatically to make target at the centre of image once accepts the pixel coordinate of target in image. Therefore we just need to measure the position of target in image as described above. The entire visual tracking process is shown in Figure 8.

Diagram of visual tracking for power lines
6. Experiment
Our 3D test-platform allows for the inspection strategy to be demonstrated and the behaviour of the system to be quantified. Figure 9 shows our 3D test-platform. It provides a 25:1 scale model of a 150m span of overhead power line, which consists of four power towers. It also supplies significant clutter in the form of backgrounds including a desert, city, grassland, field, industry buildings, etc. The 3D motion module, which acts as a substitute for UAVs, moves in a 6m*2m*2m aluminium track located above the scenery. A PTZ camera (VIVOTEK PZ7121) is mounted at the end of the Z axis, as shown in Figure 10. A PC serves as a ground station.

Photograph of the 3D test-platform
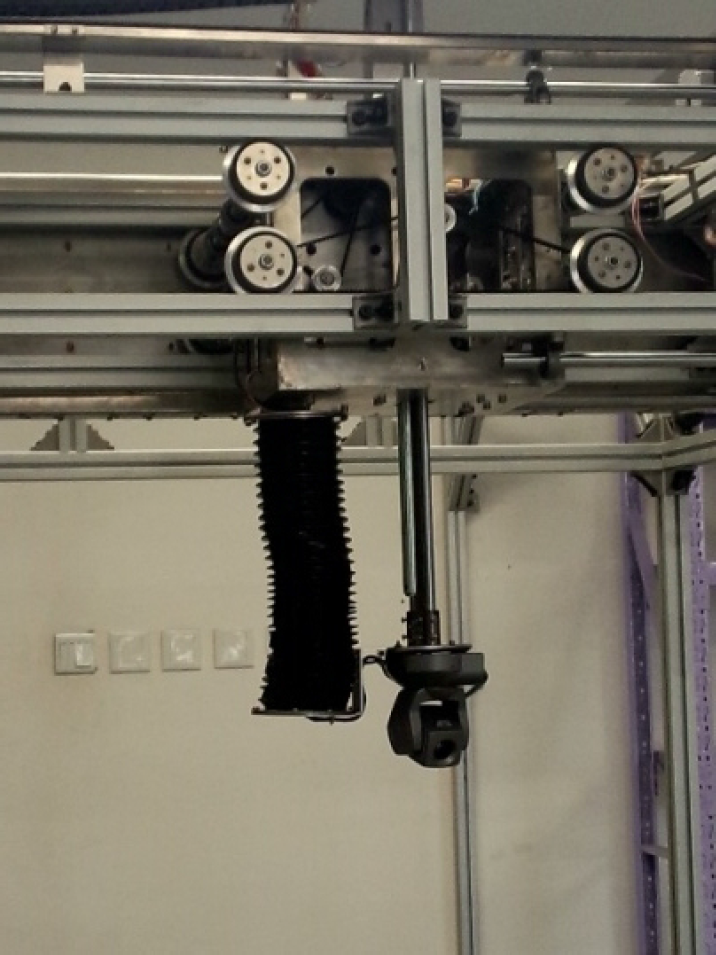
PTZ camera mounted at the end of the Z axis
6.1. Tracking algorithm in the video sequence
To verify the effectiveness of our power line tracking algorithm in a video sequence, six complex backgrounds (classified into ground backgrounds and backgrounds that are parallel to camera views) are captured. In addition, different lighting conditions are also considered. These scenes make tracking the overhead power lines more challenging. A correct tracking rate and a complete tracking rate are measured to evaluate tracking performance. The correct tracking rate indicates the number of frames that power lines are tracked during the sequence. The complete tracking rate indicates the number of frames that complete power lines are tracked within all of the frames which power lines are tracked.
Figures 11–12 and Table 1 show the tracking results for different backgrounds. Figures 11–12 show that overhead power lines can be tracked successfully in the case of six complex backgrounds. The correct and complete tracking rate for the green grass, desert, mountain/field and industry building scene are better than for the city and residence buildings scenes. This is because parts of the city and residence building scenes have similar colours with power lines (especially the case for roads and residential buildings), which misleads the canny. The Hough transform relies on edge detection and as such, a good edge detection approach is beneficial. Thus, in the real scene, where power lines are directly above roads, residential buildings or other elements with similar colours to that of the power lines will render tracking more challenging.

Vertical view sequence shots
Horizontal view sequence shots
Tracking performance for different backgrounds

In addition, in Figure 12(c) and (g) -(i), we can see that two power lines are not parallel due to different tension, some parts of the behind power line are occluded by the front one to camera; however, these cables could still be successfully tracked.
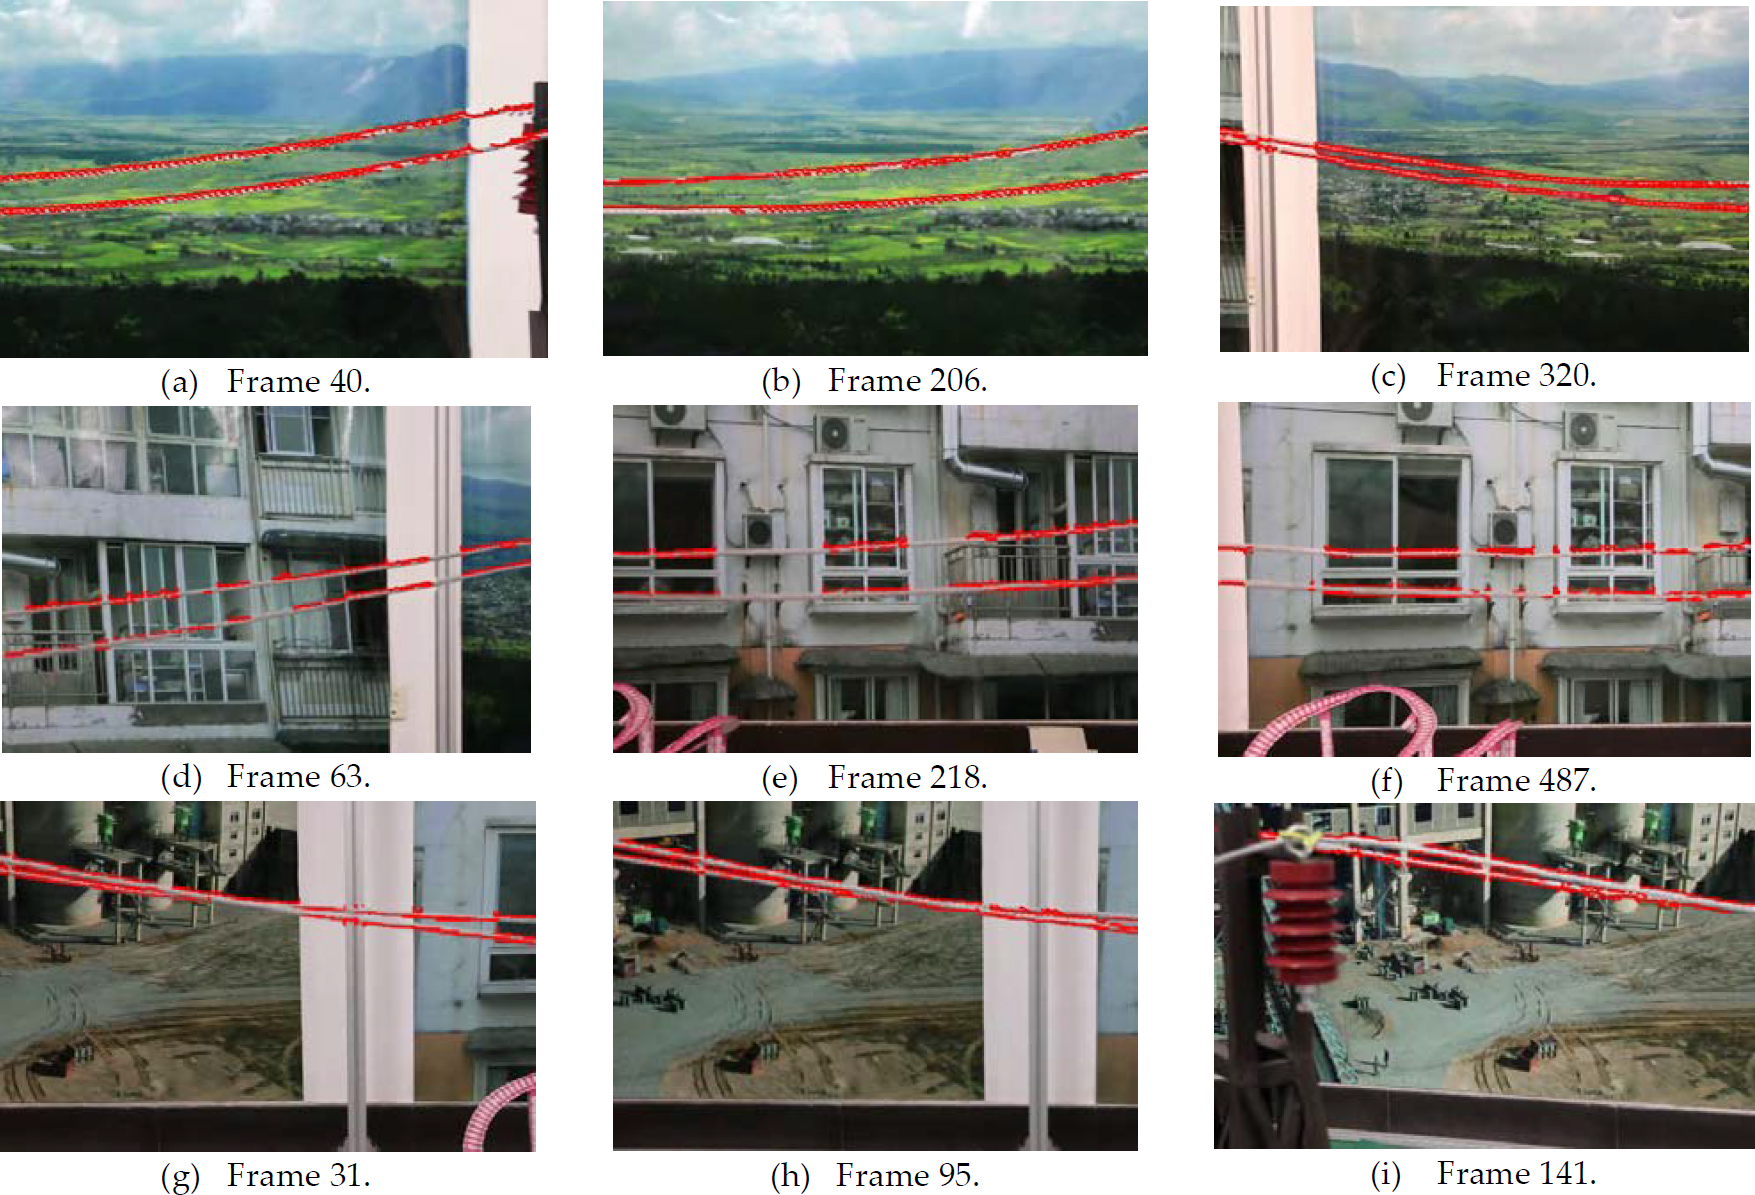
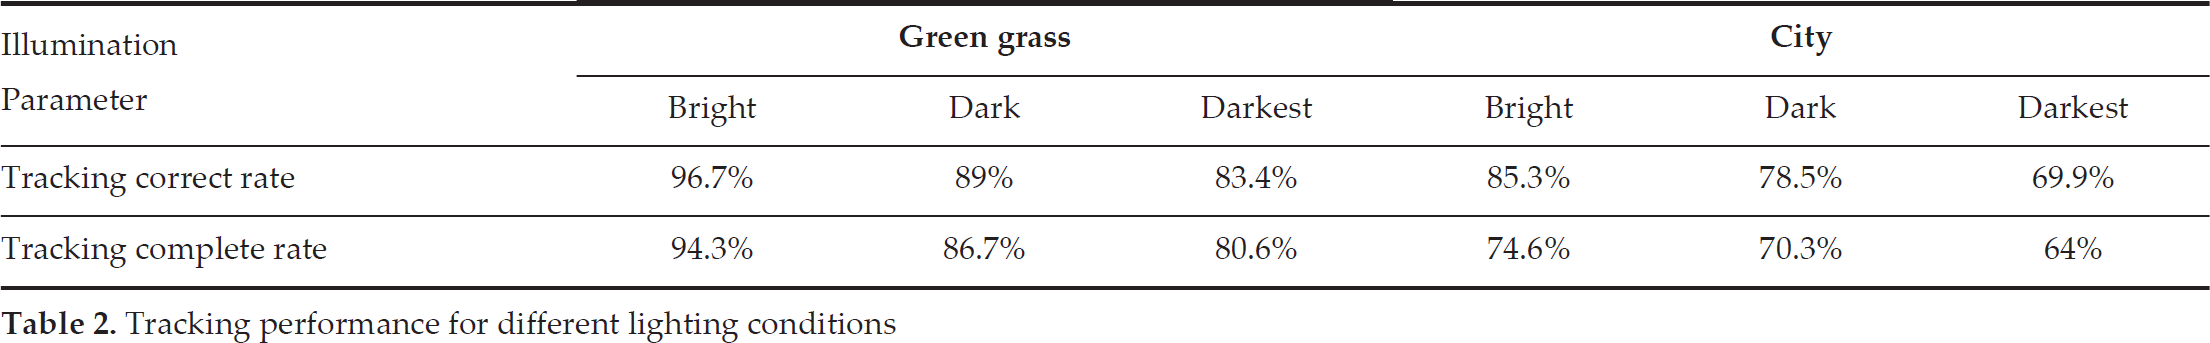
Figure13 and Table 2 show the tracking results in different lighting conditions. Videos are captured according to three lighting conditions ranging from bright to dark for the green grass and city backgrounds. Figure 13 shows that power lines can be tracked successfully in different lighting conditions. Table 2 shows that the correct tracking rate and complete rate for bright lighting conditions are better than for darker lighting conditions. The darkest lighting condition has the least correct tracking rate, as well as and the least complete rate.

Different illumination sequence shots
Tracking performance for different lighting conditions
In conclusion, power lines can be tracked successfully according to different backgrounds and lighting conditions.
6.2. Whole inspection strategy
To verify our entire inspection strategy, the experiment is performed as follows:
Step 1: plan the reference flight path according to our algorithm described in section IV;
Taking the coordinates of transmission towers as initial control points, connect them in turn to form a set of line segments (blue lines shown in Figure 14). Then, by moving all of line segments following the steps in section 4.1, the final control points can be obtained as points ①~④ and the reference flight path can be generated (the black lines shown in Figure 14(b)).
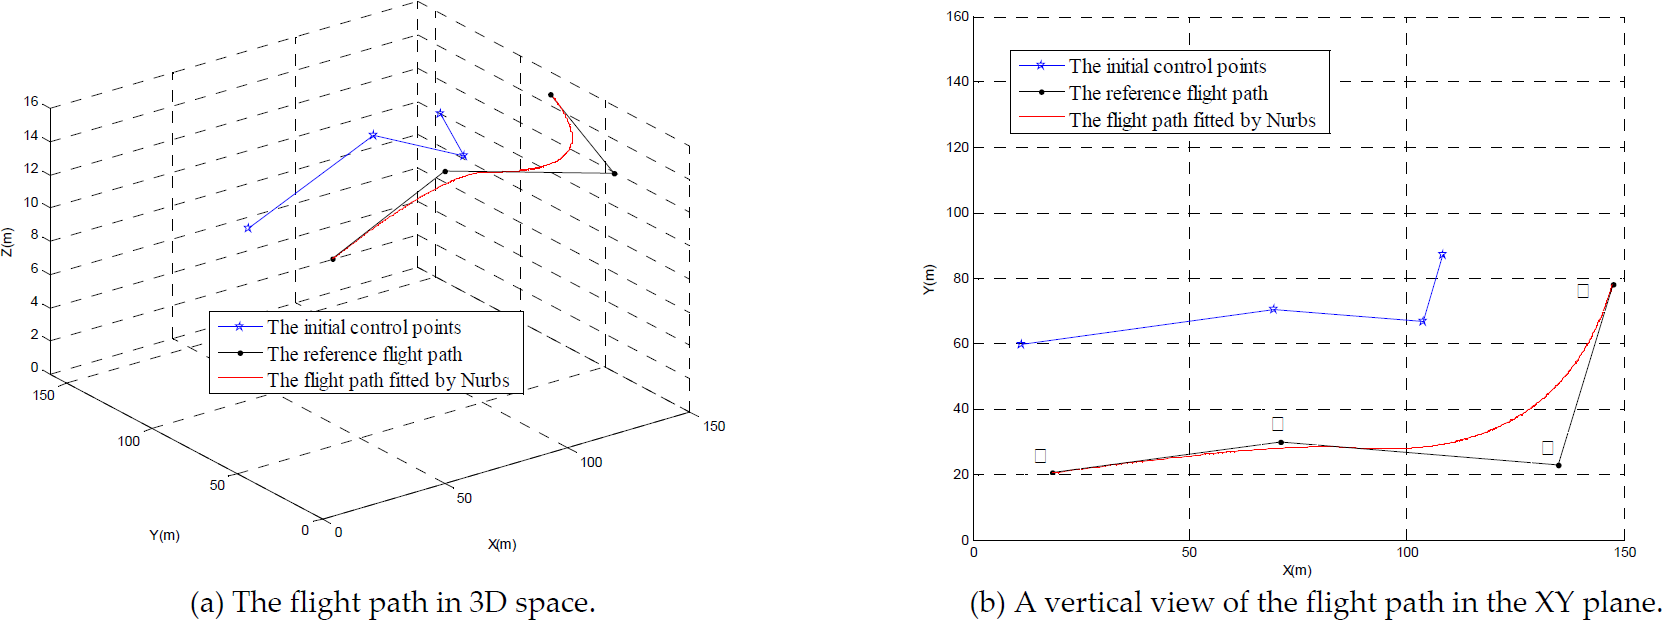
The planned flight path
Step 2: smooth the reference flight path using Nurbs curves to obtain the final flight path.
Figure 14(a) shows the results planned in 3D space, while Figure 14(b) provides an overhead view of said results. We can see that sharp corners (at points

The curvature of reference flight path and final flight path
Step 3: initialize parameters as introduced in section 5.2 and perform the inspection following the path planned in the previous step. Figure 16 shows sequence shots of tracking results, the red lines in images indicating that the overhead power lines have been tracked.

Visual tracking for camera
Figure 16(1-3) shows the tracking results after initializing roughly 200 frames. We can see that power lines are located at the centre of images at all times and that they have been tracked successfully. In Figure 16(4), the power lines start to shift down from the centre, due to the perturbation of the 3D motion module (vibration causes the camera to perturb the sightline). Figure 16(5) shows power lines shifting to the bottom of image; however, by applying the tracking strategy presented in this paper, the target returns to the centre, as shown in Figure 16(6). In Figure 16(7), power lines shift up to the top of the image and after a few frames, the power lines return back to the centre, as in Figure 16(8-9). This indicates that when a target strays from the centre of the image, our camera can automatically steer the target back to the image's centre.
Overall, the 3D test-platform designed in this paper is able to simulate UAVs' inspection of overhead power lines by carrying out the strategy presented in this paper. It can therefore be concluded that the target is tracked successfully by applying this inspection strategy.
7. Conclusions
This paper presents a 3D laboratory test-platform for simulating the inspection of overhead power lines using UAVs. This platform can be used to develop, test and assess the performance of inspection strategies. Experimental results are presented to support the concept.
An inspection strategy is proposed for UAVs to track overhead power lines. First, a safe reference flight path is planned based on the position of power towers; then, sharp corners in the referenced flight path are smoothed by Nurbs curves. The final flight path has continuous and uniform variations of curvature, which is beneficial for supplying the control system with more accurate inputs. Secondly, a visual tracking technique is applied to track the target. Our parabola detection algorithm, based on the Hough transform, is employed to detect overhead power lines and a particle filter is used to track the specific parameters. Experiments verified that the algorithm is able to track power lines against complex backgrounds and in different lighting conditions. Furthermore, once the power line strays from the centre of the image, the camera can automatically steer the image back on target. Experimental results demonstrate that power lines can be tracked successfully by employing our approach.
We can therefore draw the conclusion that the 3D test-platform presented in this paper is able to simulate UAVs' inspection for overhead power lines and that the strategy proposed for tracking overhead power lines based on the accompanying visual technique is effective and feasible.