
Abstract
Managing innovation is vital for many enterprises to survive in a competitive and dynamic environment. Thus, decision-makers have always been involved in the challenge of finding the right performance measures for the innovation process. This paper tackles the issue of innovation performance measurement and management. Its main goal is to present complex results obtained from the Czech manufacturing industry within the research project “Innovation Process Performance Assessment: A Management Control System Approach among Czech Small- and Medium-sized Enterprises” financed by the Czech Science Foundation – 13–20123P. The results reveal many positive aspects of the investigated issue. Czech companies are aware of the importance of innovation and engage in it in various forms. Moreover, the vast majority of the respondents also evaluated the implemented innovations no matter the size of the company. Small- and medium-sized enterprises (SMEs) and large companies differ in terms of their innovation performance measurements and management control techniques and methods. However, both groups adopt traditional measurement tools rather than modern techniques. Here, the gap between global and Czech companies is noted. Therefore, this paper is supposed to motivate researchers to conduct more large-scale studies in the area of innovative performance measurement systems and their implementation in different business sectors and areas.
1. Introduction
Innovation is the driving force of growth. It ensures competitiveness and offers opportunities for differentiation. Therefore, innovation is to be related to all that has to do with permanent, substantial customer benefits and a perceivable competitive edge: the development of new, successful business models. Hence, the entrepreneurial challenge lies in the successful management of innovations. As such, the question is not one of whether or not to innovate but rather of how to do so successfully [1]. Yet without the evaluation and continual review of innovation projects as a whole, improvements will not occur and lessons will not be learnt.
This paper investigates how Czech manufacturing companies measure and manage the performance of their innovation process. With regard to the identified objective of the research project (to learn and study the current issues of the management and control of innovations and their performance measurement as these areas are currently being approached in Czech industry, as well as the foreign expert literature and the practices of innovative Czech manufacturing companies) the following research hypotheses were defined:
Hypothesis 1: Innovation is mainly performed by medium-and large-sized companies in the Czech business environment who have sufficient resources.
Hypothesis 2: Large companies perform innovation regularly – it is a part of their business model.
Hypothesis 3: Large companies tend to invest greater sums of money in innovation (measured by the percentage of the annual budget).
Hypothesis 4: Large companies tend to evaluate their innovative activities more frequently than SMEs.
Hypothesis 5: Large companies tend to have implemented their innovation management control systems for longer than SMEs.
Hypothesis 6: Large companies implement modern techniques of innovation management control.
The study investigates the correlation between innovation management control systems (MCSs – including R&D expenditure, approaches to the evaluation of innovation projects, the methods utilized, the tools used, the period of implementation, etc.) and company size as the most important contingent factor. Therefore, as its exploratory aim, this study investigates the role of company size in the implementation of innovation MCSs.
The paper consists of three parts. The first part briefly points out the importance of the topic (for more on innovation management control's state of the art, see, e.g., [2–5]) as well as the research aim and the stated initial hypotheses. It is followed by a brief literature review. The core section consists of the interpretation of the original research design and procedure, including the determination of the sample size. The next part presents the complex results of the empirical investigation of the Czech manufacturing industry and their discussion. The research was conducted under the project “Innovation Process Performance Assessment: A Management Control System Approach among the Czech Small- and Medium-sized Enterprises”. The author of that paper is also the author of the present research project.
2. Literature review
The old adage states: “You cannot manage what you do not measure”. This is especially true of innovation, whereby it is necessary to ensure focus, intelligibility and discipline, particularly with regard to the initial, inventive phase of the innovation process. Innovation is a continuous process.
Companies are continually making changes to their products and processes and are always gathering new knowledge. Measuring such a dynamic process is much more complex than is the case with a static activity [6]. Therefore, measuring performance and the contribution to the value of innovation has become a fundamental concern for managers and executives in recent decades [7].
Previous research on innovation performance measurement has mainly focused on how managers choose their management control mechanisms [e.g., 8–11], on the effects of individual control mechanisms on specific outcomes [e.g., 9, 12–14], on how these effects may be moderated [e.g., 15, 16] and on how they pay off in the innovation process [e.g., 17].
In addition, many researchers have conducted studies to determine the degree to which innovation really improves a company's performance [e.g., 18–24]. The professional literature provides the following:
Despite the abundance of books and publications written over the past few years in the field of performance measurement, the problem of defining a rigorous model for measuring innovation and its impact on a company's financial performance has not been solved [38, 39], although some notable and interesting attempts have recently been published [e.g., 40–43]. The most typical indicator used comprises R&D expenses [44–46].
However, unlike most of the previous studies on innovation, in this study innovation is not measured through R&D expenditure alone. There are several well-known limitations for these measurements [47]. The importance of other dimensions of innovation, such as managerial or organizational change, investment in design or skills, and the management of the innovation process itself, is increasingly acknowledged [48]. Therefore, this study deals with economic indicators. For clarity, they are divided into financial and non-financial metrics in the research (see Section 7).
3. Research procedure
This section provides an overview of the data used for this study and the main characteristics of the research sample. After extensively examining the previous relevant and related literature and research in innovation, management control, performance measurement and related topics [2–6, 49], the field study was begun in 2014. Three types of data were collected for this study: a questionnaire and interviews, company data and public information (data from a survey conducted every two years by the Czech Statistical Office were considered).
As concerns the methodological approach, following recent examples [50–55], a questionnaire-based survey was implemented to gather information and determine the real state of any solved issues of the management control of innovation activities. The survey method is often used to collect systematic data since it is time- and cost-efficient and allows the carrying out of a statistical analysis [56]. In addition, the replication of questions is possible and thus it presents a comparison of the results and a pattern analysis.
The first step was to define the research sample. Before the research commenced, the circle of respondents was duly considered. The research could be limited based on company size, the field and the distribution of companies in the Czech Republic (CR). It was decided to carry out the research via a random selection of various-sized innovative companies from the manufacturing industry in the CR.
This choice is related to the fact that managerial tools primary originated – and were subsequently developed – in manufacturing companies. The second feature is the fact that the manufacturing industry is considered to be the most significant industry in the development of the Czech economy because it is the largest sector. This allows for a sufficient number of companies to be contacted to participate in the study. It is estimated that the target population consists of over 11,000 manufacturing companies.
According to Czech Statistical Office and its 2012 survey, 51% of 5,449 innovative companies belong to the manufacturing industry. Moreover, these companies contributed revenues comprising 45.4% of the total of the Czech economy in 2012 [53, p. 15].
In order to establish innovation success, it is first necessary to decide at what level the process will take place. Innovation effects can be measured at: i) the macro level (distinguishing national and sector levels), ii) the meso level (the level of the company's product family) and iii) the micro level (the level of innovation projects).
At the macro level, there is a wide range of known and sophisticated means of measuring innovation potential and performance, such as, in Europe, the Innovation Union Scoreboard [57] and the Regional Innovation Scoreboard [58], while in the CR innovation surveys are regularly performed by the Czech Statistical Office. The macro level has been the subject of abundant research and studies in recent decades [e.g., 59–65]; therefore, the present study does not investigate this level and bases its considerations on the findings of the aforementioned studies.
However, there are several reasons for analysing the link between innovation and productivity at the firm microlevel. First, it is companies that innovate, not countries or industries. Second, aggregate analysis hides a lot of heterogeneity. The performance of companies and their characteristics differ both between countries and within industries; countries' innovation systems are characterized by mixed patterns of innovation strategies which have an impact on companies' behaviour; moreover, companies may adopt multiple paths to innovation, including non-technological ones. The advantage of micro-level analysis is that it attempts to model the channels through which companies' specific knowledge assets or channels can have an impact on their productivity, and therefore it sheds light on the role that innovation inputs, outputs and policies play in economic performance [48].
The key was to approach as many respondents as possible and so to acquire a sufficiently large data-scale factor for the evaluation of the primary research. The inquiry itself provided quantitative as well as semi-qualitative data on the current state of the issue in question. Simplicity and the relative brevity of the questionnaire – thereby affecting the respondent's willingness to fill it out – were important factors when creating it. The following types of questions were used:
Those with selectable answers and the option to select just one.
Those with selectable answers and the option to select several answers.
Those with pre-defined answers with an evaluation scale.
Some questions had the option to fill in answers freely.
The questionnaire was structured into two parts. The first part consists of general information about the company, whereas the second part focuses on innovation measurement and management and applied management control tools and methods.
The structured questionnaire also enables additional comments. As such, the respondents could express their opinion on certain questions regardless of the degree of their own innovation. The data acquired are presented in tables and graphs that are summarized in the following section.
The questionnaire part of the research project, titled “Innovation Process Performance Assessment: A Management Control System Approach among Czech Small- and Medium-sized Enterprises” and sponsored by the Czech Science Foundation (GACR), was web-based so as to facilitate access to a large number of respondents.
Once drawn up, the questionnaire should be tested on a sample population to determine whether all the items are understandable and clear. Therefore, the questionnaire was pre-tested by a number of academics and then sent to several practitioners for further review. Minor adjustments in the wording and layout were made in order to further the understanding of the questionnaire. None of these respondents considered the questionnaire to be difficult to complete. After several iterations of item editing and refinement, the questionnaire was administered to the full research sample.
The survey consisted of 18 questions and was conducted by sending a fully standardized questionnaire by e-mail to each company (a link to the electronic questionnaire was included in the e-mail). The e-mail provided a brief introduction clarifying the purpose and objectives of the research project. It was sent exclusively to CEOs, top managers, executive officers or else – in small companies – directly to the owners. The survey was anonymous, took approximately 10 to 15 minutes to complete, and was conducted from April to November 2014.
In addition, the survey respondents were asked to indicate whether they would be willing to participate in a follow-up interview. The aim of the follow-up interviews was to analyse the questionnaire responses in greater depth. The interviews were semi-structured and conducted with a degree of flexibility. A list of the main questions was sent in advance to facilitate the interviews. Although the questionnaire was semi-structured, the individual questions were understood as topics for discussion. Numerous incentives revealed during the meeting with businessmen took the form of extended comments in section no. 5.
4. Determining the sample size
The companies addressed were those that, by their principal activities, belong in the manufacturing industry (according to CZ-NACE rev. 2, division C, section 10–33). Data on the total number of companies in the target population of the survey are taken from the Czech Statistical Office. It is estimated that the target population consists of over 11,000 manufacturing companies [53]. A selective sample of these companies was obtained from the database Technological Profile of the Czech Republic (www.techprofil.cz). A random sample of 2,877 innovative companies was drawn from the basic sample.
In addition, the answer to the most frequently asked question concerning sampling (“What sized sample do I need?”) was given at the beginning of survey. In general, three criteria will usually need to be specified to determine the appropriate sample size: i) the level of precision, ii) the level of confidence or risk, and iii) the degree of variability in the attributes being measured [66].
There are several approaches to determining a sample size. It is often assumed that the samples in surveys are often large enough such that an estimate made from them is approximately normally distributed [67, p. 11]. However, in the social sciences, the populations from which samples are drawn are generally marked by a high degree of non-normality.
Applying the central limit theorem as well as the scope and target population of the survey, it can be assumed that the distribution of the acquired data is approaching a normal distribution. Therefore, the total sample size required for this study is calculated using Cochran's formula [67] by taking 5% as the estimated percentage prevalence of the population of interest,

where n0 is the required sample size, Z2 is the abscissa of the normal curve that cuts off an area α at the tails (1-α equals the desired confidence level), e is the desired level of precision, p is the estimated proportion of an attribute that is present in the population, and q is (1-p). The value for Z is found in statistical tables, which contain the area under the normal curve.
Therefore, the required return sample size (n0) for this study was computed as follows:

5. Research results
After the first posting at the beginning of April 2014, the non-responding companies received a reminder at the end of May or the beginning of June; a follow-up was sent a few months later. At the end of November 2014, 354 completely filled-in questionnaires were collected. This number is very close to the calculated sample size. Hence, data acquired are considered statistically significant.
The real response rate of more than 12% (354 completed questionnaires from 2,877 potential respondents) can be considered to be good because the response rates of mail***back questionnaires are usually less than 10%. The detailed statistics of the questionnaire inquiries are shown in Table 1.
Overall statistics and distribution of companies engaged by the research survey. Source: Own research (n=354).

Moreover, using the Pearson chi-square test and data from Table 1, no statistically significant difference between the two groups (the sizes of the respondents and the non-respondents) was found. The null fragmental hypothesis FH0 will be tested so that any random values are not dependent in comparison with the alternative fragmental hypothesis FH1.
FH0: The size of the company and respondence are not related to each other.
FH1: The size of the company and respondence are related to each other.
The calculated test criterion for micro companies:

The calculated test criterion for small companies:

The calculated test criterion for medium companies:

The calculated test criterion for large companies:
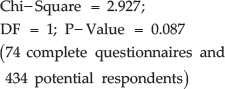
For a selected significance level, α = 0.05 is determined to be quantile chi-square (1) = 3.841. Because the value of the test criterion was not realized in the critical field (3.662 < 3.841 and P-Value = 0.056 for micro companies; 0.004 < 3.841 and P-Value = 0.949 for small companies; 0.122 < 3.841 and P-Value = 0.727 for medium companies; 2.927 < 3.841 and P-Value = 0.087 for large companies), the alternative fragmental hypothesis FH1 is rejected on a 5% level of significance and the null fragmental hypothesis FH0 is accepted.
It is important to note that reminders were made for nonresponding companies, and in many cases the respondents answered that they would not fill-in the questionnaire due to: i) a lack of interest in surveys of this kind, ii) bad experiences of analogous surveys, iii) a lack of time, iv) the existence of internal policies related to non-participation in academic research, or v) not targeting specific competent executives (for the vast majority of addresses listed in the database). Thus, an important factor may be the fact that many e-mails did not arrive at the appropriate place. This could be evidence of the difficulties created by this kind of research as well as that innovation is a strategic issue for such companies.
6. General characteristics
Questions from the first part of the questionnaire were related to the basic characteristics data of each company, such as the company's size, its origin, market, etc. Company size is a traditional contingency factor in economic research. Specifically, this section studies the impact of one factor linked to company size, i.e., the number of employees. However, the revenue data were collected with the help of the questionnaire as well. Nonetheless, only the number of employees is a matter of concern for most parameters. In fact, this factor is usually the basis of company classification. The distribution of companies by size is based on EU law and the Recommendation of the European Commission 2003/361/EC of 6 May 2003 [68, p. 36]. This standard divides into four groups: micro-, small-, medium- and large-sized companies. Figure 1 shows the percentages obtained using the number of employees indicator.

Distribution of companies engaged in the research survey (n=354, number of employees). Source: Own research.
The first empirical evidence of the survey emerged by way of descriptive statistics. It has been noted via the analysis of questionnaires that innovation is mostly performed by SMEs (80.51% in total), respectively by medium enterprises (44.63% of respondents) followed by small enterprises (28.53% of respondents) and large enterprises (19.49% of respondents) and with micro companies (7.34% of respondents) at the tail.
It can be assumed that the companies were aware of the threat of losing their competitiveness such that it could potentially lead to their demise. While large enterprises focused on operational efficiency and costs savings, SMEs were able to react to changes in the environment through innovation. The bigger the company, the more organizationally demanding any innovative changes are, which is why mainly smaller businesses with a flexible organizational structure innovate presently. Large companies naturally strive to support innovation as well, but due to their more complicated organization, bureaucratization of the innovation and decision-making process inhibits not only inventiveness but also slows the pace at which new inventions move through the corporate system towards market. The importance of SMEs to the development of the Czech economy is therefore increasing. This is also highlighted by the Concept for Support of Small and Medium Entrepreneurs for the period 2014–2020, carried out by the Ministry of Industry and Trade of the Czech Republic.
However, these results contrast with studies by the Czech Statistical Office [52, 53, 69] that consider large companies to be innovation leaders in the CR (see Figure 2). Previous studies conducted over 2009–2011 under the sponsorship of the Internal Grant Agency of the Faculty of Business and Management Brno University of Technology have reached similar contradictory conclusions [70–72]. Thus, and for better understanding, the classification according to turnover has been considered (see Figure 3).

The ratio of innovative enterprises to the total number of enterprises engaging the CZSO surveys by size (CZSO, 2010; 2012; 2014)

Distribution of companies engaged in the research survey (n=354, turnover). Source: Own research.
On the one hand, given a certain level of innovation inputs, larger companies might have higher innovative sales intensity because they can appropriate innovation benefits more easily than SMEs and/or because of economies of scale. On the other hand, SMEs might use innovation inputs more efficiently because of entrepreneurial ability or their greater flexibility in the production process. Previous evidence has indicated that although larger companies are more likely to sell innovative products, this probability increases less than proportionately with size, and that among innovative companies the share of innovative products among total sales tends to be higher with smaller companies [e.g., 73].
A study by the OECD [48] also provides mixed results: size is positively correlated, negatively correlated or not correlated with turnover (sales) from innovations. Economies of scope and scale and knowledge flows within companies seem to play a role in commercialization.
It is very difficult to either validate or invalidate Hypothesis 1 (“Innovation is mainly performed by medium- and largesized companies in the Czech business environment who have sufficient of resources.”) based on these contrary results. What is the most important from managerial point of view is the finding that companies perform innovation. However, they differ in terms of the form of innovation (see Table 5). The essential question is not whether to innovate or not, but how to innovate.
Origin of companies. Source: Own research (n=354).

Market orientation. Source: Own research (n=354).

Period of innovation. Source: Own research (n=354).

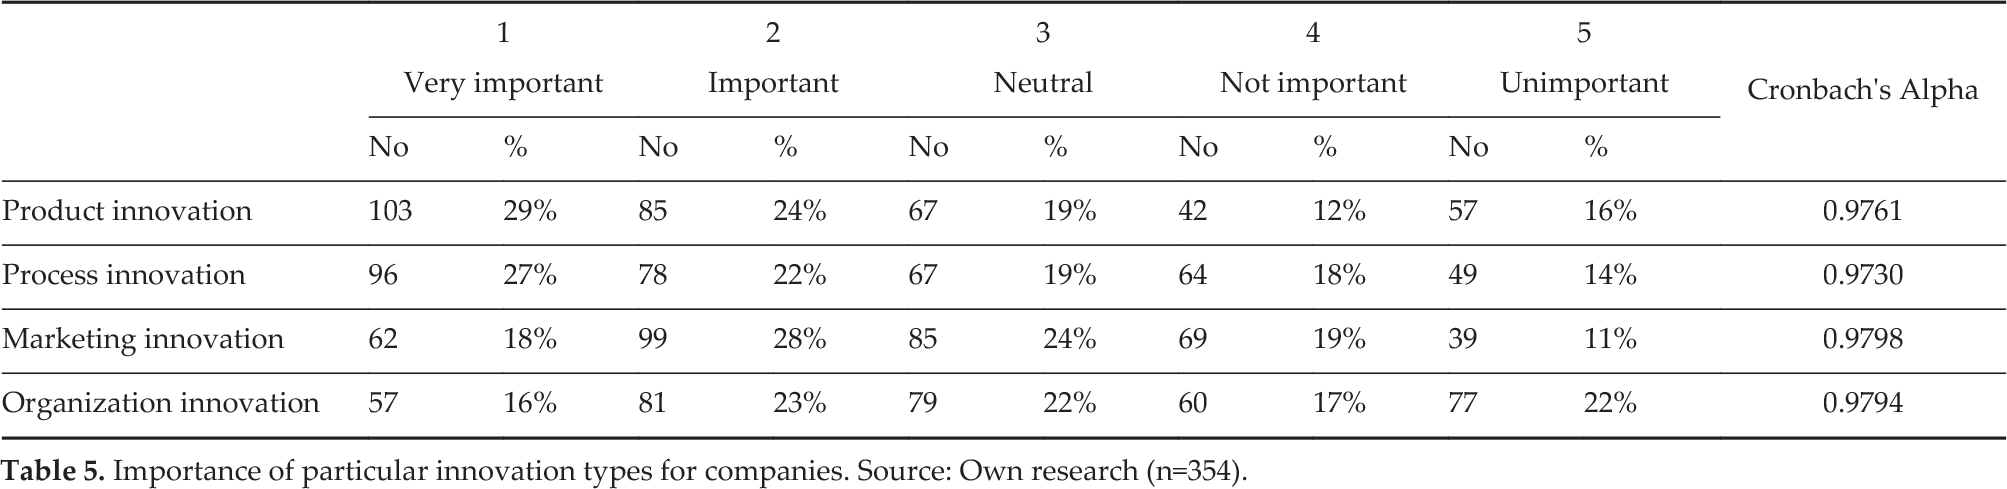
Importance of particular innovation types for companies. Source: Own research (n=354).
The vast majority of the companies addressed (68.64% of respondents) had Czech owners, 27.68% of the companies have foreign participation, and only 3.67% had foreign owners (see Table 2).
Here, 55.93% of the inquired companies are engaged in innovative business within the CR, of which 12.99% operate on the domestic market within the whole CR, 42.94% operate on regional markets only within the CR, 30.79% do business in EU member and candidate countries, and the remaining 13.28% do business around the world (see Table 3).
The majority of the respondents (76.55%) carried out innovation irregularly and randomly, i.e., as a consequence of intuitive and immediate decisions, or reverse the negative development. Only 23.45% of the respondents executed innovation regularly, i.e., as a standard part of their businesses which is systematically managed.
Here, Hypothesis 2 (“Large companies perform innovation regularly – it is a part of their business model.”) will be tested. Again, the chi-square test was applied. For this purpose, Question 5 “Over what period does your company realize innovation” is used. The null fragmental hypothesis FH0 will be used to test whether the random values are not dependent in comparison with the alternative fragmental hypothesis FH1:
FH0: The size of the company and the period of innovation are not related to each other.
FH1: The size of the company and the period of innovation are related to each other.
The calculated test criterion for large companies is as follows:
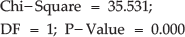
For a selected significance level, a = 0.05 is determined for a quantile chi-square (1) = 3.841. Because the value of the test criterion was realized in the critical field (35.531 > 3.841 and P-Value = 0.000), the fragmental null hypothesis FH0 is rejected on a 5% level of significance and the alternative fragmental hypothesis FH1 is accepted. This means that the random values are dependent and that the relation between the size of the company and the period for realizing an innovation was demonstrated.
Next, the respondents answered the question about what innovations had been implemented by the company during the last three years, while what importance they had for the company represented another part of the research. They could select from four predefined answers (see the innovation classification according to the Oslo Manual 2005 [46]). The questionnaire included a list of examples for each type of innovation. Since the respondents were able to select more answers for this question, a recalculation had to be carried out whereby the relative frequency was determined as a percentage of the number of selected answers out of the total number of respondents in the group. Some of the key research findings are summarized in Figure 4.

Implemented innovations (n=354)
The most-performed innovation type was product innovation (38.42% of respondents), followed by process innovation (29.38% of respondents) and marketing innovation (20.90% of respondent). Organizational innovation is at the tail, with 11.30% of respondents. These balanced results highlight the fact that product innovations often require process innovations (e.g., in the form of acquiring new production technologies), and in order for these product innovations to be successful on the market and bring the company higher value, it is often necessary to seek new distribution channels via marketing innovations. Moreover, many of the innovators in the manufacturing industry implemented both product and process innovation.
The measurement instrument used in the questionnaire to estimate the importance of innovation was evaluated via a five-item Likert scale: 1 – very important, 2 – important, 3 – neutral, 4 – not important, 5 – completely unimportant. In the summary of the percentage ratio of positive answers, namely the values 1 (very important) and 2 (important), the order of individual possibilities was determined. Therefore, the results show that the respondents see the importance of innovations for their company in the following order: innovation of products, processes, marketing and organization. The evaluation of the importance of individual types of innovation for companies is shown in Table 5.
Cronbach's alpha coefficient for particular types of innovation is above 0.97, and the overall Cronbach's alpha is 0.9828, which is higher than the commonly used benchmark value 0.70. This means strong internal consistency and good reliability of scale.
The main motives leading to the commencement of such innovation activities are growth of revenues/profits, reaction to demand, increased quality, increased market share and, last but not least, inspiration by competitors. The motives of innovation activities represent a starting point for innovation strategies. Strategic marketing and research – with a nomination by top management – are also involved in strategy proposal and formulation. The objective of every innovation strategy rests on achieving a competitive advantage, leading to the company's improved position on the market; any other objectives are derivative [53, 74].
Innovation expenditure includes all expenses for both inhouse and externally purchased activities that aim at the development and introduction of innovations, regardless of whether these innovations have been introduced yet. They comprise current expenditure (e.g., labour costs, externally purchased goods or services, etc.) and capital expenditure (e.g., machinery, instruments, intangible assets, etc.).
Innovation expenditure is an important metric to determine the quantity of resources that a company provides for carrying out innovation activities. To overcome the unwillingness of the respondents to transmit confidential information, four categories were predefined: innovation expenditure based on actual needs up to 5% of an annual budget, 5–10% of an annual budget and more than 10% of an annual budget (see Table 6).
Innovation expenditures. Source: Own research (n=354).

The most frequent innovation expenditure involved up to 5% of an annual budget, especially in SMEs. SMEs invest in innovative activities according to actual needs. The largest contribution in this regard is made by micro companies (65.38% of respondents), followed by small (38.61% of respondents) and medium companies (36.08% of respondents). In contrast, the inverse is observed for expenditure of 5–10%, ranging from 11.54% for micro companies to 34.78% for large companies. Large companies (23.19% of respondents) devote more than 10% of their annual budget for innovation, while micro companies invest into innovation according actual need (65.38% of respondents). In other words, the larger the company, the higher the expenditure, the more regularly planned it is, and the greater the amount that is annually spent on innovation.
In what follows, research Hypothesis 3 (“Large companies tend to invest greater sums of money in innovation (measured by the percentage of the annual budget).”) will be tested. The chi-square test was used. The FH0 partial null hypothesis, stating that random quantities are independent, was tested against the FH1 partial alternative hypothesis. For this purpose, Question 8 “Estimate the total amount of expenditure on innovation by percentage of the annual budget” is used. The null fragmental hypothesis FH0 will be tested as to whether the random values are not dependent in comparison with the alternative fragmental hypothesis FH1:
FH0: The size of the company and the percentage of the annual budget invested in innovation are not related to each other.
FH1: The size of the company and the percentage of the annual budget invested in innovation are related to each other.
The calculated test criterion for large companies is as follows:

For a selected significance level, α = 0.05 is determined for a quantile chi-square (1) = 3.841. Because the value of the test criterion was realized in a critical field (59.624 > 3.841 and P-Value = 0.000), the fragmental null hypothesis FH0 is rejected on a 5% level significance and the alternative fragmental hypothesis FH1 is accepted. This means that the random values are dependent and that the relation between the size of the company and the percentage of the annual budget invested in innovation was demonstrated. Moreover, the result of this test corresponds with the earlier Hypothesis 1 – “Innovation is mainly performed by medium-and large-sized companies in the Czech business environment who have sufficient resources.”
7. Innovation management control
Well-managed innovations successfully commercialized in the market are a tool that companies can use to win competitive advantages that will allow them to prosper even under such conditions as the recent recession. It is a modern trend to seek to innovate, but innovations must be implemented prudently and in a targeted manner. Moreover, innovative activities are very costly and they can tie a substantial part of a company's available resources for a significant period of time. The effort and resources expended must be recouped if the company is to stand a chance of surviving in a strongly competitive environment. The need for an MCS is crucial for innovation.
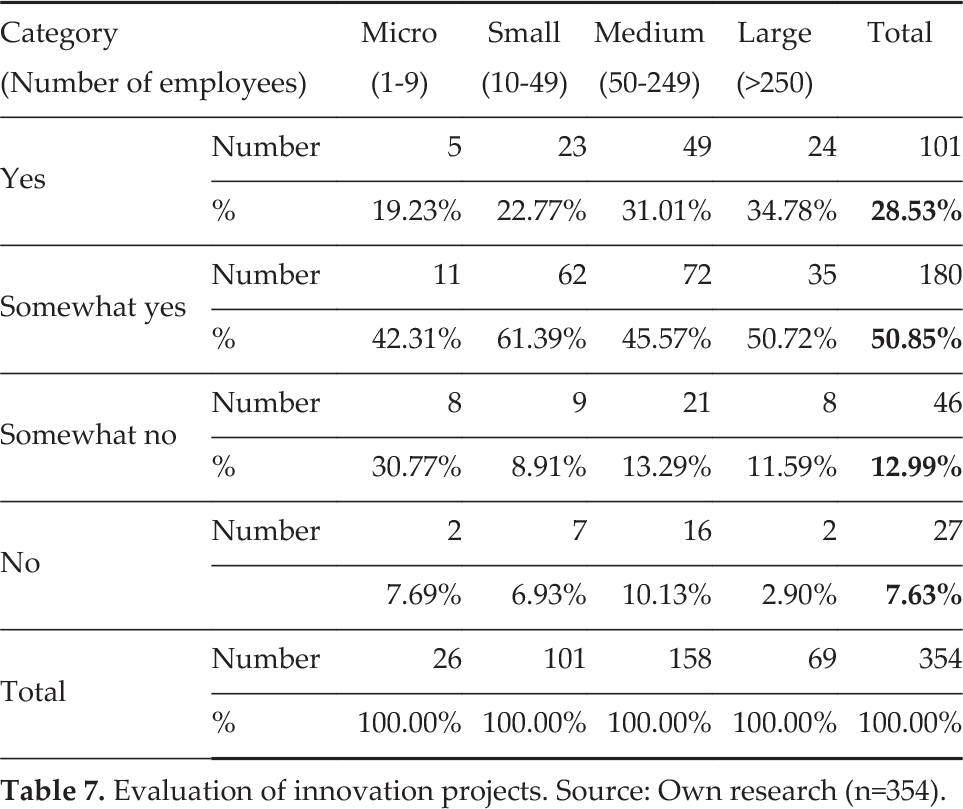
Therefore, a key area of the survey was the issue of the evaluation of and responsibility for innovative activities –namely how the key decisions are made and how it is decided whether a given innovation is viable. When asked whether they had evaluated the implemented innovative projects, the vast majority (79.38% of respondents) answered affirmatively. On the other hand, what is somewhat disquieting is the fact that this area was neglected by 20.62% of the respondents, even though innovations had been implemented by them (see Table 7).
Evaluation of innovation projects. Source: Own research (n=354).
Based on these data, Hypothesis 4 (“Large companies tend to evaluate their innovative activities more frequently than SMEs.”) is tested. Independence statistical testing of two qualitative characters is carried out for statistical dependency verification. For this purpose, Question 9 “Has your company implement an R&D management control system?” is used. The null fragmental hypothesis FH0 will be tested as to whether the random values are not dependent in comparison with the alternative fragmental hypothesis FH1.
FH0: The size of the company and the evaluation of innovation are not related to each other.
FH1: The size of the company and the evaluation of innovation are related to each other.
Calculated test criterion for large companies is as follows:

For a selected significance level, α = 0.05 is determined for a quantile chi-square (1) = 3.841. Because the value of the test criterion was not realized in a critical field (1.967 < 3.841 and P-Value = 0.161), the fragmental alternative hypothesis FH1 is rejected on a 5% level significance and the null fragmental hypothesis FH0 is accepted. In other words, SMEs are aware of the importance of innovation evaluation and they perform it as well as large companies. On the other hand, SMEs use different techniques of management control to large companies (see Table 11).
Period of innovation MCS implementation. Source: Own research (n=281).

Reasons for innovation MCSs' implementation. Source: Own research (n=281).

Responsibility for innovation projects. Source: Own research (n=281).

Management control methods. Source: Own research (n=281).

For those enterprises which responded affirmatively to the above question (281 in total), the period since the company had implemented an innovation MCS was examined.
Hypothesis 5 (“Large companies tend to have implemented their innovation management control systems for longer than SMEs”) will be tested. Independence statistical testing of two qualitative characters is carried out for statistical dependency verification. For this purpose, Question 10 “Since when has your company implemented any innovation MCS?” is used. The null fragmental hypothesis FH0 will be tested as to whether the random values are not dependent in comparison with the alternative fragmental hypothesis FH1:
FH0: The size of the company and the period of an innovation management control system's implementation are not related to each other.
FH1: The size of the company and period of an innovation management control system's implementation are related to each other.
The calculated test criterion for large companies is as follows:

For a selected significance level, α = 0.05 is determined for a quantile chi-square (3) = 7.815. Because the value of the test criterion was not realized in a critical field (5.835 < 7.815 and P-Value = 0.120), the fragmental alternative hypothesis FH1 is rejected on a 5% level of significance and the null fragmental hypothesis FH0 is accepted. In other words, companies evaluate innovation processes no matter the period of any MCS's implementation.
As such, the relevant reasons for an innovation MCS's implementation and its importance were surveyed for the same group of respondents. Moreover, they evaluated the importance of the reasons given. The measurement instrument used in the questionnaire to estimate the importance of the reasons for an innovation MCS's implementation was a five-item Likert scale: 1 – very important, 2 – important, 3 – neutral, 4 – not important, 5 – completely unimportant. In the summary of the percentage ratio of positive answers, i.e., the values 1 (very important) and 2 (important), the order of individual possibilities was determined (see Table 9).
The respondents gave the following most important reasons for innovation MCSs: motivation and remuneration, business strategy planning, reduction of waste of resources, idea improvement and communication. The Cronbach's alpha coefficient for each construct is above 0.98, and for all seven factors it is 0.9853. This means strong internal consistency and good reliability of scale.
Innovation MCSs should therefore be based on an approach that, on the one hand, minimizes the risk of wasting resources and avoids the pursuit of bad opportunities, and on the other hand, prioritizes the utilization of those resources (as the company wants to allocate its limited means to the most promising prospects). Regarding the various aspects of a given innovation (such as the offer, the market or the competition), it should be revisited and challenged from a strategic point of view, adjusted and improved. The key aspects of an innovation MCS include convincing others about making up people's minds about an innovation. Even if a manager or an owner is convinced about the value of a given innovation, telling colleagues to “just trust me” or to do it because “I say so” can be poor ways of capturing innovation efforts, engaging others effectively and mobilizing resources. Less significant reasons include legitimacy to innovation and stakeholder relations management.
In the area of responsibility for innovative activities, it is characteristic of the surveyed enterprises that, in the final stage, the company's management always has the final say. Moreover, in SMEs the owner usually directly manages the company as a whole. This phenomenon was particularly observed in small family companies.
Logically, this is due to the fact that the company's management bear the greatest responsibility for the implemented innovative projects and it assumes the risks arising from the possible failure of a particular action, which is reflected in all the activities of the enterprise (see Table 10).
Focusing on companies implementing innovation MCSs, the following analysis investigates the application of the evaluation of the techniques that respondents use when engaging in innovative activities to provide information for decision-making and control. The questionnaire focused on 16 core project-level evaluation metrics of innovation performance. This set of metrics was formed after the literature review of the most frequently used innovation management control tools [51, 75–81].
Hultink and Robben [82] have made a distinction between measuring innovation performance in the short term and in the long term after launch. They found that the importance attached by managers to the indicators of innovation performance depended strongly on a given time perspective. Therefore, both short-term and long-term performance assessment are included. The respondents were asked to indicate the management control tools that they had used for innovation projects in the previous five years.
Here, again, the respondents were able to select more answers for this question and a recalculation had to be carried out whereby the relative frequency was determined as a percentage of the number of selected answers out of the total number of respondents in the group. The management control tools were divided into two groups: financial and non-financial. The results are shown in the table below (see Table 11).
Focusing on those companies adopting measurements and MCSs, Table 11 shows that the budget, the revenues from innovation and EBITDA are the most frequently applied managerial tools among innovative Czech manufacturing companies. These results show that the prevailing approach is the monitoring of financial indicators. In contrast, the economic value added EVA, a balanced scorecard and innovativeness are implemented the least. In other words, the Czech companies analysed and adopted more traditional measurement tools rather than modern techniques. Here, the gap between global and Czech companies can be seen [cf. 83–86].
Many large, global companies – as well as most of the Czech companies surveyed – measure their results using financial indicators, although the majority of the managers in these companies feel that non-financial indicators should also be used to monitor the innovative efforts and projects undertaken. Managers should rely more on non-financial indicators as opposed to the financial ones, because these indicators provide a better assessment of progress in real time as well as of the probability of success.
The integration of non-financial metrics into systems for measuring performance allows managers to better understand the relations between various strategic innovation targets, to communicate the linking of these targets with workers' activities and, based upon the defined targets, to formulate priorities and allocate resources [87]. The main contribution of non-financial indicators is the identification of key factors influencing the development of financial indicators. These indicators are also more sensitive to changes, which can be considered a crucial characteristic in the current turbulent environment.
Finally, the empirical evidence shows the low adoption rate of the balanced scorecard. Most Czech companies – especially medium- and large-sized companies – monitor the performance of innovation activities by using specific financial and non-financial measures, but without any logical link between them. In other words, only a small number of companies – especially large-sized companies and those having different perspectives – actually understand the importance of a cause-effect relationship between metrics. In addition, after overcoming the barriers and reluctance of managers to communicate more detailed information about their systems of innovation evaluation, these systems proved to be not very appropriate while being biased in favour of financial indicators.
8. Conclusion
The aim of the research was to study the current state of the issues of innovation management and its performance measurement, mainly among innovative Czech manufacturing companies. Based on the data acquired, it can be stated that Czech manufacturing companies consider innovation to be an essential success factor for their business. Most companies engaging in innovation pay attention to the evaluation of realized innovation (irrespective of the size of the company), since they tend to tie a substantial part of their available resources for a significant period of time.
In summary, the results obtained from the empirical investigation suggest that the managers of Czech manufacturing companies rely more on individual (financial) metrics compared to holistic MCSs, such as a balanced scorecard.
However, individual indicators for measuring multidimensional innovation performance are insufficient on their own, as they always view innovation from just one perspective. The problem of practically all available metrics is the fact that the measurement of innovation should be performed efficiently, namely functionally (i.e., it must yield relevant information for the company's management) and economically (i.e., it must be performed at a reasonable cost). Individual indicators usually meet the condition of economy but rarely that of functionality, because they view innovation from too narrow a perspective.
To evaluate the ability or performance, it is necessary to have a complete perspective, which is why a solution might be seen in using a system with several individual indicators. However, complex indicators clash with the condition of economy and sometimes also with that of functionality, as they contain subjective or hard-to-forecast indicators. Despite these shortcomings, the use of complex innovation indicators is probably the best option. Whether they measure innovation capability, performance or their combination, they always study the innovative process from additional perspectives and from multiple angles. As such, they strive to reflect the full picture of the studied area, which cannot be achieved with individual innovation indicators.
Unfortunately, focusing on a balanced scorecard, a huge gap has been noted between micro- and small-sized companies and medium- and large-sized companies. Among the micro- and small-sized companies, a balanced scorecard is implemented only among a minority. Less than 3% of respondents adopted this method. Currently, Czech companies must also deal with problems in company culture and with the motivation of workers in relation to an active approach to increasing innovation performance. Based upon contact with the managers and owners of Czech companies, it can be said that although they are interested in modern management methods, there are many barriers preventing the implementation of Balanced Scorecard (BSC):
Companies do not constantly perform benchmarking, and a deeper knowledge of competitors and the market is missing. Marketing information systems are not consistently created or filled [72].
Strategic company management is formal and has a “campaign” character. Visions are often very vague and strategic goals are formulated generally and in terms of quality only. Due to poor knowledge about competitors, the strategic goals employed do not focus on the key factors of success.
Due to generally formulated targets, the investment necessary for implementing strategies is spent on the management's considerations and without relation to the strategy in question.
The strategy is not communicated throughout the entire company and workers lack motivation in fulfilling it.
The long-neglected issue of human resources is becoming a critical factor for further development. The condition of further efficient company development is to achieve agreement over the distribution of created value between customers, owners, employees and suppliers [88].
A few potential limitations of this study have to be addressed. The results of this study are limited to the analysis of a single case study, representing a starting point for further research in other industries and countries. In this sense, the findings may be extrapolated to other CEE countries, since economic and technological development in CR is similar to other OECD Member countries.
Moreover, the study of Czech manufacturing companies provides some directions for future research. An important gap in the adoption of innovation measurement tools and management control tools was identified between global companies and Czech companies. Hence, more research is needed, and a sampling frame that combines companies from different countries could be used in order to provide a more international perspective on the subject. Furthermore, it may be of interest to analyse companies in different phases of the innovation process in order to observe their advances in terms of innovation and the existence of any innovation performance measurement systems.
Footnotes
9. Acknowledgements
The author would like to thank all the participants who took part in the research surveys 2013–2015 as well as the Czech Science Foundation for its funding support for post-doc project No. 13-20123P “Innovation Process Performance Assessment: A Management Control System Approach among Czech Small- and Medium-sized Enterprises”.