
Abstract
This work presents a business intelligence tool for monitoring traffic accidents on motorways and supporting decisions relevant to road safety. The system manages information on road characteristics, traffic accidents and traffic volumes and produces reports for monitoring the evolution of key performance indicators for road safety supporting decisions on actions for risk mitigation and safety improvements for road users. The paper illustrates the different types of analyses performed by the system. Pattern based analysis is used to evaluate safety performance indicators for the road sections matching defined patterns. Two different road segmentation algorithms, used to identify the most critical road sections according to various severity indicators, are presented and discussed. Differential analysis compares the value of selected severity indicators before and after the implementation of an intervention on a road. Finally, a graphical user interface allows the accident locations to be visualized and accidents with specific characteristics to be highlighted. The system was evaluated on the data collected between 2009 and 2011 for the A15 motorway in Italy, connecting Parma to La Spezia.
1. Introduction
Approximately 1.24 million people die every year on the world's roads and a further 20 to 50 million suffer non-fatal injuries as a result of road traffic accidents. Road traffic injuries are estimated to be the eighth leading cause of death globally [1]. In 2013 in Italy, more than 181,000 road accidents (with fatalities or injuries) were registered, which caused 3,385 deaths and more than 255,000 injured. This means that, on average, nine people every day die and 705 report injuries as a consequence of a road accident [2]. Even though a reduction in comparison with 2012 has been registered (3.7% fewer road crashes with fatalities or injuries; 9.8% fewer fatalities and 3.5% fewer injured), at 56.2 deaths per million inhabitants, Italy goes beyond the European average (51.4).
Road safety is a major European societal issue. In this respect, the European Commission has adopted an ambitious Road Safety Programme, which aims to reduce road deaths in Europe by 50% between 2011 and 2020 [3]. The Programme has undertaken a mix of initiatives at European and national level, focusing on improving the safety of vehicles, infrastructure and road users' behaviour. Supporting the objectives and guidelines of the European Commission for the period 2011–2020 and continuing the action of the previous 2001–2010 strategic plan, Italy has established the National Plan for Road Safety, which includes strategies, methodologies and actions for improving road safety through a more efficient and effective process [4]. The trend of deaths and injuries in road accidents shows a significant reduction from 2001; nevertheless, the social costs of road accidents cannot be neglected. Such costs estimate the economic damage suffered by society [5], which is not represented by a direct expenditure, but by the quantification of the economic burden due to the consequences of car accidents. The analysis in [5] reports that the estimation of the social costs for the year 2011, corresponding to a cumulative cost of deaths, injuries and damages caused by road accidents, is about 28 billion euro. In 2013, the road accident data show that most of the road accidents (75.3%), with 71.7% injuries and 42% deaths, occurred in urban contexts. Overall, in the same year, Italian motorways accounted for 5.1% of total accidents, 9.5% of road accident fatalities and 6% of injuries [2]. The Italian Act 35/2011, in compliance with the European Directive 2008/96/EC on safety management of road infrastructure, requires the establishment of specific procedures for the assessment of the impact on road safety of infrastructure projects, for the monitoring of road safety, for the management of road network safety and road safety inspections.
In that respect, this work presents a research and development project, carried out by SINA (Società Iniziative Nazionali Autostradali) SpA, in collaboration with researchers of the University of Genova, and developed by IROI (Innovation & Real Optimization Instruments) Srl, which is included in the set of proposals for an increase in safety on Italian roads. SINA is part of the ASTM-SIAS (Autostrada Torino Milano SpA – Società Iniziative Autostradali e Servizi SpA) group, which operates 1,400 km of motorways in northern Italy. IROI Srl is a spin-off of the University of Genova, Italy, founded in 2010, and specialized in the development of solutions for optimization and, in general, Decision Support Systems (DSSs). The project is focused on infrastructure and is aimed at developing a business intelligence tool able to collect a wide range of information: road characteristics, information on traffic accidents, traffic volumes and composition. The tool is able to compute and integrate the collected data, in order to elaborate reports used for the monitoring of the evolution of the key performance indicators associated with roads. In this way, the tool supports decisions and/or actions for risks mitigation and for increasing of road users' safety.
Traffic accidents have been the subject of several works in the literature. A variety of approaches for the analysis of road traffic safety have already been proposed, which are based on assessment of accident rates and frequency: initially, many researches were oriented towards lineartype models, then Poissonian models were successively taken into consideration, assuming the Binomial Negative as the probability function for the accident count (e.g., in [6] and [7]). A survey of the statistical models available for frequency-analysis of accidents can be found in [8]. Additionally, the Empirical Bayesian technique was applied, through the support of Cluster Analysis. In [9], the application of Empirical-Bayesian predictive models allows estimation of the expected accident rate in different road stretches or infrastructures. The analysis of traffic accidents in order to identify their possible causes is considered in [10] and [11], where cluster analysis is proposed in order to identify homogeneous classes of accidents that allow effective analysis to be conducted, whereas classic statistical tools are used in [12]. Similarly, cluster analysis has been used in [13] to group homogeneous data for developing an algorithm to estimate the number of road accidents and to assess the risk of accidents, whereas in [14] cluster analysis is used to evaluate alcohol-related accident reports. Furthermore, cluster analysis is applied in [15] to a “Before-After” problem on road segments situated on the Southern Italy motorway. These algorithms allow to partition the motorway, identifying hazardous zones and estimating the relative hazard. These groupings are used after introducing the “hazardous zone index”, to build a predictive model of accidents. Other analyses, as in [16], give a specific focus to the weather conditions and time period, among the factors that may influence accident occurrences.
Several DSSs have been proposed in connection with road management and safety. In [17], a DSS for the multi-criteria ranking of road infrastructure maintenance and repair actions is proposed. A system supporting decision makers in transport planning, in particular optimizing the resource assignment to the interventions for ensuring safety, is discussed in [18]. In [19], the same authors recently proposed a system for supporting public administrations in planning safety interventions on the road network. A DSS for emergency management on motorways based on a Geographical Information System (GIS), whose purpose is to improve efficiency by providing organizational support to the different actors involved, is presented in [20]. Road safety in connection with transportation of hazardous materials on congested motorways and accident management is considered in [21], where a DSS is proposed for monitoring vehicles transporting hazardous material, assessing the risk posed to the population and selecting the optimal routes. Finally, a DSS has also been proposed for the automatic recognition of accidents based on support vector machines and neural networks [22].
The purpose of the system proposed in this paper is to meet the needs of motorway managers, i.e., to create a tool that facilitates the acquisition of accident data, checks the data's consistency and enables it to be correlated with information on the infrastructure. In addition, it can be used to support technicians who are in charge of assessing the road safety conditions, allowing them to monitor the occurrence of accidents and to evaluate their causes and consequences. The system does not aim to predict accident occurrence or suggest or rank the possible causes of accidents on motorways. A peculiarity of the system is that it allows the definition of road patterns, i.e., road stretches that match some specific characteristics (e.g., slope, bending radius) considered of particular interest, analysing their possible relation to the occurrence of accidents. In addition, it allows critical road sections to be recognized. The system, called ADAM (Accident Data Analyser Module), creates a number of reports describing subsets of motorway stretches (e.g., those with a higher incidence of accidents) related to specific characteristics of the motorway (e.g., the presence of a specific infrastructure, the type of lighting or the bending radius). This paper illustrates the most relevant features of the ADAM system and is structured in two main sections. The details of the ADAM modules are described in Section 2, which is devoted to the architecture of the system and an explanation of the input and output data streams for each system module. The algorithms implemented to analyse the data are described in Section 3. In Section 4 the system validation is discussed and in Section 5 the relevant conclusions are drawn.
2. The architecture of ADAM
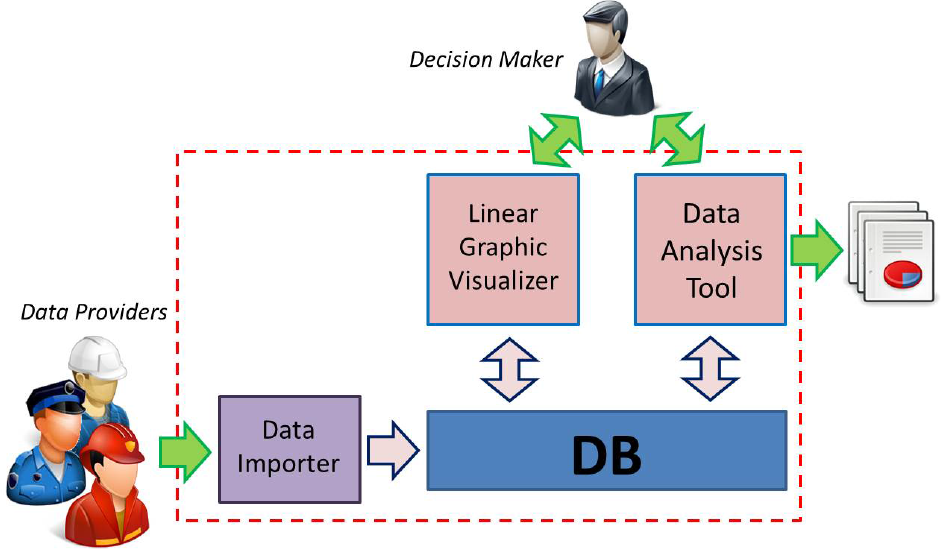
The overall ADAM architecture, shown in Figure 1, is composed of four modules:
an input module, the Data Importer (DI), allowing the data coming from different and heterogeneous sources in the internal system database to be stored;
an internal module, the Data Base (DB), which is the repository for the information on the infrastructure and its features, as well as the traffic and accident data;
a processing module, the Data Analysis Tool (DAT), used to analyse the DB data and to produce reports;
a graphical interface module, the Linear Graphical Visualizer (LGV), which is a user interface providing a visual representation of the distribution of accidents on the motorway.
The overall architecture of ADAM
The DB, implemented with a relational database management system, is the central component of the ADAM architecture, since all the other modules exchange information by accessing it. Note that the users in Figure 1 denoted as Data Providers do not directly interact with the system, but generate data files, usually spreadsheets, whose content is converted by the DI module. The main system user, the Decision Maker, executes the system data analyses, specifically through the DAT module, and performs visual queries to identify the locations and characteristics of accidents with the LGV. Both modules use the DB to store processed and temporary information.
Finally, the reports produced by the DAT correspond to spreadsheet files.
The following paragraphs describe the functions of the ADAM modules.
2.1 The Database module
The DB contains two main types of data, i.e., the infrastructure and the traffic data. The former consists of a collection of information about the infrastructure elements (road stretches, tunnels, bridges), each characterized by a number of attributes, e.g., type of lighting, number of lanes, bending radius, slope. These data, representing the structural information of the motorway, are added or modified occasionally, i.e., whenever an infrastructure element is added or modified. The data management (i.e., insertion or update) is performed by SINA according to a standard format, thereby ensuring data accuracy and consistency. The traffic data contain two kinds of information: the traffic volumes and the details of the road accidents. The former input is provided by SINA and it is used both for the computation of the severity indicators and for the scenario analyses, i.e., comparisons of aggregated information on traffic and accidents, with the corresponding information available for the Italian road network, for other European countries, or for the overall European Community. In contrast, the road accident data are not directly generated by SINA, but are collected from different sources (e.g., road police, motorway companies) and then loaded through the DI module. The data collected in the DB can be accessed through the DAT and the LGV. In Figure 2 the overall structure of the ADAM database is shown, reporting only the main tables and fields. The kinds of information stored in the tables of Figure 2 are summarized in the following.

A simplified representation of the ADAM database structure
The Roadways table collects data about the carriageways of the selected motorway. Each carriageway is characterized by:
manager: the name of the road operator (i.e., the name of the organization with authoritative power to manage the infrastructure);
progressive start and progressive end: the starting and ending points (by means of a conventional progressive numbering system), which respectively represent the start and end linear coordinates of the carriageway, expressed in kilometres;
direction: denotes the way in which the conventional progressive numbering increases or decreases according to the direction of the traffic. As an example, Figure 3 represents a section of a motorway with two carriageways, each one with two lanes, where the numbers correspond to progressives in kilometres; assuming that the conventional progressive numbering increases along the travel path from East to West, then the same numbering decreases in the opposite travel direction from West to East.
An example of conventional progressive numbering for the two carriageways of a motorway
Each carriageway is divided into segments, which are stretches of road with homogeneous characteristics (e.g., with the same slope, curvature, infrastructure characteristics, etc.). The Roadway Segment Details table contains the attributes of the segments of the carriageways. In this table, each section is defined by:
starting and ending points (progressive start and progressive end);
a key field giving the name of the attribute (e.g., number of lanes, curvature, slope);
a value field providing the unit value for the corresponding attribute.
The Infrastructures table collects the list of single structures/sections on the selected motorway: for each structure/section the start and end conventional progressives are specified, as well as the name of the infrastructure and its type (e.g., tunnel, bridge, etc.).
The Roadway Sections table contains data about the road segments between two consecutive junctions (e.g., interchanges to the tollgates). The Traffic table then contains the yearly traffic volume for each stretch, split between heavy vehicles (HV) and passenger cars (light vehicles, LV).
Two tables in Figure 2, Accidents and Accident Details, store the information on traffic accidents. The Accidents records include the location of the accident (specified as progressive), the date and time (hour) of the event. The Accident Details table includes a set of pairs (attribute key and value) for each accident, each recording the accident features according to how they have been registered by the authority in charge of the survey (the traffic police), as well as pairs providing some general information, such as the visibility or the weather conditions when the accident occurred.
2.2 The Data Importer module
The DI allows the import into the ADAM database of data coming from heterogeneous sources (for example, traffic police, motorway operator, etc.), which, using different templates for the collection of information, do not usually have a standard format. The DI module then supports different data formats, typically one for each data source, and performs the necessary conversions. Traffic data are imported periodically. For each new import operation, the DI module evaluates the correctness and consistency of the input information. In particular, two main types of errors may be automatically discovered: syntactic errors and semantic errors. The syntactic errors correspond to inconsistencies in the data and may occur when there is a naming mistake (e.g., when the name of a specific element is not included in the database). The second type of error is subtler and it refers to the internal consistency of the set of data provided to describe an accident. A typical example is an accident registered by the road police as occurring in a certain tunnel, but the specified location on the motorway (through the kilometre progressive) does not match with the tunnel position stored in the database. Both types of error can be automatically detected but cannot be automatically solved; therefore, whenever an error is discovered, the system reports a warning to the user, asking for a possible correction.
2.3 The Data Analysis Tool
The system includes two processing and output modules: the DAT, used to perform the analyses and to generate the reports, and the LGV, used to graphically visualize the locations of accidents on the motorway. The DAT performs three main types of analyses described in Section 3, namely: the pattern based analysis, the road segmentation analysis and the differential analysis. A scenario analysis is also performed to compare average severity indicators for the selected motorway (or for specific road patterns such as tunnels) with the corresponding values for another motorway, or for the whole national network of a European country, or of the European Union. All the analyses are based on a set of performance indicators such as, for example, the number of accidents per kilometre, the number of injured or fatalities per kilometre, the number of vehicles involved, etc. The pattern based analysis exploits a graphical interface to define and store road patterns (e.g., a pattern can be a tunnel longer than 500m or a curve with a radius greater than a given threshold); the database is then queried by searching for the accidents occurring in correspondence with a specified pattern. This kind of analysis is used by motorway operators to monitor, for a selected period, infrastructure or road sections considered of interest for specific investigation or benchmarking. The road segmentation analysis, on the other hand, aims to define a list of road stretches that maximize one of a set of different severity indicators. The system implements two alternative algorithms for road segmentation, which are presented in Section 3.2. Finally, the value of the performance indicators before and after the implementation of a mitigation measure (e.g., a change of lighting equipment or the installation of fixed speed cameras) can be compared when performing the differential analysis described in Section 3.3.
2.4 The Linear Graphical Visualizer
The second analysis and output module, the LGV, consists of a user interface allowing both to visualize the distribution of accidents along the motorway (or part of it) and to perform several visual queries. These latter are used by the road operators to highlight accidents with specific characteristics by imposing filtering conditions on their attributes. As an example, visual queries can point out accidents occurring during the night, on wet road surfaces or those exceeding a threshold of the number of injured people. Figure 4 provides a sketch of the LGV interface.

The Linear Graphical Visualizer Module user interface
The user interface is composed of a main window with a control column on the right side. The main window shows the output of the current analysis, that is, the selected motorway section and a number of horizontal rows reporting the indicators/characteristics selected by the user from the checkboxes in the control column. In addition, the lower part of the control column shows the details of the accident or infrastructure selected by the user by clicking on it in the main window. As an example, the main window in Figure 4 includes six rows. Starting from the bottom, the first three rows are always displayed: the last row shows the zoom and scale details, the selected interval in conventional progressive numbering and the sections with the names of the toll stations; the upper row shows the infrastructure elements identified by their names, where different colours highlight different types of elements (e.g., in the figure the tunnels are in green and the bridges are in pink); finally, the third row reports the accidents represented as coloured circles. The user can select an accident by clicking on it and then the related attributes are displayed in a dedicated area in the lower part of the control column. The user can also filter the accidents by imposing conditions on their attributes, or highlight a subset of accidents that satisfy particular conditions; for example, in Figure 4, the black circles represent the accidents occurring during the day and the red ones represent the accidents occurring during the night. Other rows, such as those shown in Figure 4, are optional: their visualization can be activated from the control column checkboxes and they correspond to the graphical representation of performance indicators along the visualized stretch. In the example of Figure 4, three optional rows show the current values for different indicators: starting from the top of the window, the first row represents the accident rate expressed as the number of accidents divided by the traffic moment, the second row shows the traffic moment and the third row shows the overall number of accidents in the section. The traffic moment (tm), which is an important factor influencing risk, representing the level of road traffic, is a metric defined as the product of the number of vehicles (nv), expressed in millions of vehicles, that travelled on the road segment during the selected period by the segment length (sl), expressed in kilometres, i.e.,

The LGV can display many other indicators or severity measures, such as, for example, the ratio between the number of injured people and fatalities and the total number of accidents. Each indicator can be shown in a separate row as a diagram describing the evolution of the parameter along the considered carriageway.
3. The analysis of accidents
This section describes the analyses performed by the DAT module and the relevant implemented algorithms. As already pointed out, the DAT can be used to execute the following three types of analysis:
Pattern-based Analysis enables the system to define models of road segments and then to analyse all the road segments that match a specified model;
Segmentation Analysis allows the system to find the motorway segments that maximize a selected indicator;
Differential (or Before-After) Analysis allows the system to analyse the variations in the severity indicators as a result of a modification to the infrastructure.
Figure 5 illustrates the phases of the overall approach followed to analyse data in order to identify critical situations for safety. Two data acquisition phases are initially needed before starting any analysis, the first relevant to the motorway infrastructure and the second to the accidents. The data on the infrastructure can be occasionally updated, whereas data on accidents are periodically acquired from the different data sources. The three kinds of analysis, illustrated in the following sections, can be performed alternatively according to the decision maker's purpose.

The overall system process to support critical road segment identification
3.1 Pattern-based Analysis
This type of analysis is mainly used to benchmark structures or road sections having similar characteristics (e.g., tunnels, bridges, interchanges, etc.). To this end, a pattern of the structure or the section under analysis first has to be defined through the DAT user interface. Using such a formal definition of pattern, the module is able to search the database for all the road sections of the motorways that satisfy the specific pattern/criteria, finally computing a set of performance indicators for each road stretch identified. Figure 6 shows an example of a possible pattern corresponding to a motorway segment made of three main subsegments: the first sub-segment presents a curve with a certain bending radius r; the second sub-segment corresponds to a tunnel with a speed limit of 80 kilometres per hour; the third sub-segment is a road section with three lanes.
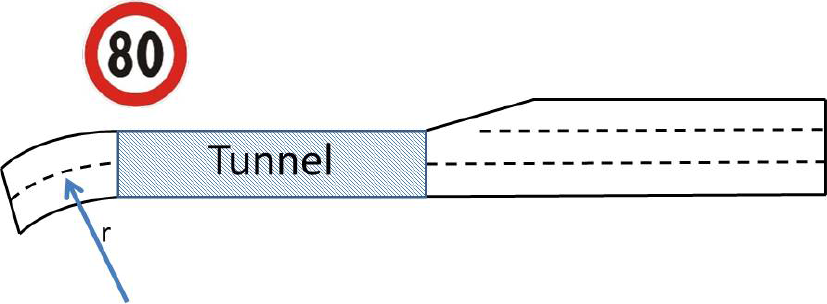
A theoretical example of pattern for a motorway segment
To perform a pattern-based analysis, the following steps are required:
Pattern definition. A dedicated tab of the graphical user interface, shown in Figure 7, allows patterns like the one in Figure 6 to be defined. The user, through the DAT interface, can select the type of infrastructure (Infrastructure of reference in Figure 7) from a list of possible ones (e.g., bridge, tunnel). The list also includes the “generic road section” used to define patterns on road sections not associated with specific infrastructure, but that have other characteristics that are worth analysing, such as, for example, sharp curves. The interface allows the system to define a pattern as a set of consecutive road stretches (Segmentation box). According to the SINA technicians' expertise on road safety, the model also allows the inclusion of two additional road stretches, located before and after the considered infrastructure, for which a specific set of properties can be defined. Moreover, the selected infrastructure can be further partitioned into sub-segments. Figure 7 shows an example of a pattern for tunnels, which is composed of five sub-segments defined in the Segmentation box: a subsegment (250 metres) before the tunnel (denoted as Pre); a tunnel access sub-segment, corresponding to the first 150 metres of the tunnel (Entrance); a tunnel exit sub-segment, corresponding to the last 150 metres of the tunnel (Exit); a sub-segment associated with the body of the tunnel, i.e., the internal part of the tunnel having excluded the entrance and the exit (Body), and finally a sub-segment (250 metres) after the end of the tunnel (Post). For each sub-segment a set of conditions can be specified (Conditions box); for example, in Figure 7, these conditions define a pattern similar to the one shown in Figure 6: the first condition defines the curvature radius for the Pre sub-segment, the second the number of lanes in the Post sub-segment and the third the speed limit for the tunnel.

The tab with an example of pattern definition: the tunnel
Query definition. A dedicated tab of the graphical user interface, shown in Figure 8, allows a definition of the queries to be executed on the database, which correspond to the analyses to be performed. The main query parameters to be specified are the reference period (Time interval field), the set of motorways (Selected motorways check boxes) and the pattern to be applied (Use model field). It is also possible to reduce the research to a single type of infrastructure (i.e., a specific tunnel). In the query definition interface the user can select the various kinds of analysis to be performed (denoted as Phases in Figure 8 to be compliant with the SINA operators' practice) and specify the relevant parameters. In Figure 8, for example, Phase 2 denotes the segmentation analysis, Phase 3 the pattern-based analysis and Phase 4 the scenario analysis (other items in the user interface are not considered in this paper for brevity).

The query parameters tab
Query execution. When executing a query, the system searches the database for all the segments of the analysed carriageway matching the pattern and the query conditions. This is done by searching the Infrastructures table or the Roadway Segment Details table (in Figure 2) to identify the main element of the searched pattern (e.g., a tunnel), then verifying if it satisfies the conditions imposed by the pattern. Then, for each segment found, a report is produced, consisting of a spreadsheet showing the values of a set of performance indicators for each subsegment of the pattern. Figure 9 shows an example of such kind of spreadsheet. In particular, the first column lists the names of the sub-segments as defined in the pattern model, whereas in the related columns the values for the accident performance indicators are reported, i.e., the total number of accidents, the number of events with fires and heavy vehicles involved, the number of injured in passenger cars and heavy vehicles, the number of fatalities in passenger cars and heavy vehicles, the number of accidents with injured and the number of injured, the number of accidents with fatalities and the number of fatalities, the total number of fatalities and injured, and the social cost of the accidents.

An example of output report produced by the Pattern-based Analysis
3.2 Segmentation-based analysis
This type of analysis aims to identify the sections of the selected motorway that maximize a specified performance or a severity indicator. The user can choose between two different segmentation algorithms (hereinafter discussed) and among a large number of performance indicators (for example, the accident rate, the number of accidents per kilometre, or the number of injuries or fatalities per million vehicle kilometre). The output of the segmentation analysis is a spreadsheet report showing the list of the identified segments and reporting for each of them the values for all the selected indicators. Figure 10 depicts a theoretical example of a carriageway section with several accidents, showing for each accident an identification number and the location of occurrence (expressed through the conventional progressive numbering). The green lines perpendicular to the roadway represent a possible segmentation produced by the algorithm: in this example, three segments are identified, where the middle one is the one with the maximum number (and rate) of accidents.

A theoretical example of carriageway section with some accidents
3.2.1 Segmentation maximizing a cumulative severity indicator
The purpose of the first algorithm is to divide the carriageway into a sequence of segments maximizing the sum of the considered indicator over the segments. In order to prevent the algorithm generating segments of infinitesimal length (note that for rate indicators the segment length is at the denominator), the algorithm receives in input the minimum conventional acceptable road segment length. The algorithm builds an acyclic directed graph G (V, A) that models the possible partitions of the roadway into segments. The nodes included in the node set V represent locations along the carriageway that correspond to the extremes of possible segments. Two classes of locations are associated with the nodes, i.e., accident and milestone locations, and for each node iεV two pieces of information are considered, namely, the progressive coordinate pi of the location and the cumulative number of accidents ci occurring up to the location in the considered time period. In particular, for each accident, two accident nodes are included in V, each characterized by the same location, but only one accounting for the accident; in this way it is possible to define more segments between the same pair of locations that differ for the number of associated accidents. The milestone nodes are added to improve the detail of the space discretization for the segmentation, which hence avoids forcing the algorithm to identify only segments whose extremes correspond to accident locations. The number of milestone nodes to be included in V should be determined considering a trade-off between the algorithm speed and its accuracy; the compromise used in the implemented algorithm is to add a milestone node associated with every half minimum segment length. The resulting cardinality of V, i.e., the number of nodes of graph G, is given by

where na is the total number of accidents occurring on the selected roadway, L is the length of the roadway, lmin is the fixed minimum segment length and ⌊a⌋ denotes the largest integer not greater than a. Note from (2) that two additional nodes are considered to represent the start and the end of the considered carriageway. Figure 11 reports an example of node locations for a motorway stretch, considering 10 km as a minimum segment length The grey boxes in Figure 11 represent the milestone locations and the white ones represent the accident locations (note that two accidents occurred at progressives equal to 18 km).

An example of accident and milestone locations along a carriageway
The set A of arcs of G is composed by the directed arcs (i, j) such that i, jε V, pj>pi and pj-pi>lmin. A weight wij is associated with each arch (i, j) ε A, which corresponds to the value of the severity indicator considered for the segmentation, computed for the segment with extremes in the progressives pi and pj. Figure 12 reports part of the graph associated with the locations in Figure 11, in particular, showing all the nodes but only the arcs with origin in the nodes with progressives equal to 0 and 3.
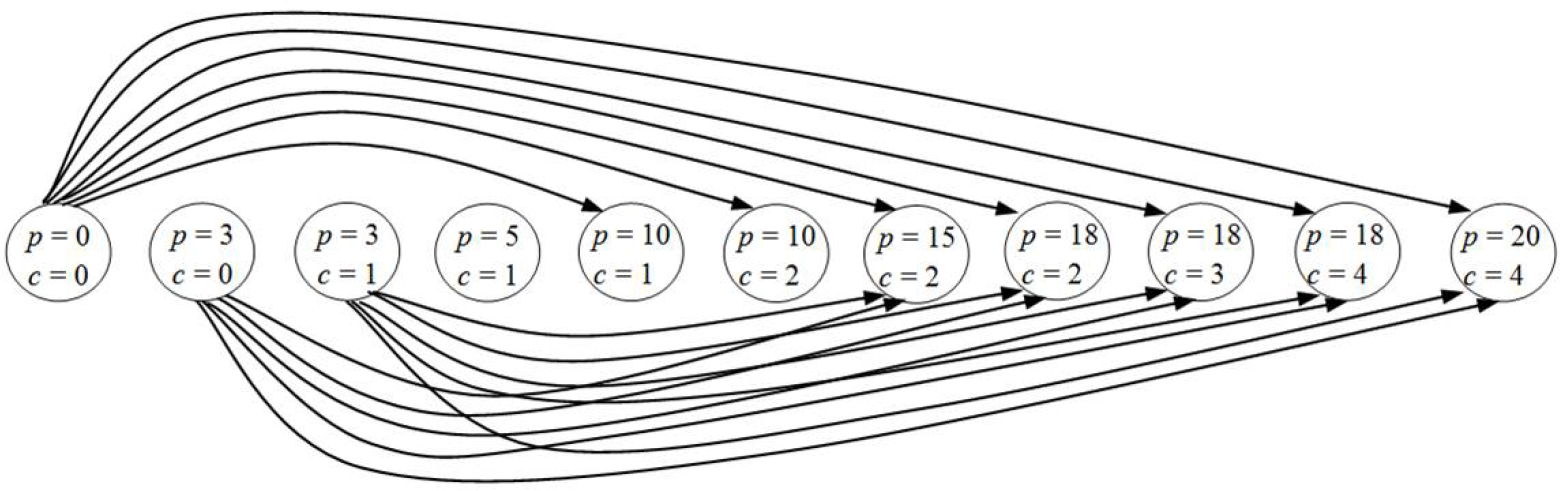
An example of part of the graph associated with the locations of Figure 11
The segmentation maximizing the selected severity indicator corresponds to the maximum weighted path in G, from the node associated with the start of the considered carriageway to the node associated with its end. Then, the problem of finding a maximum weighted path in a directed acyclic graph can be solved in polynomial time by the well-known Bellman-Ford algorithm [23].
3.2.2 Segmentation maximizing a severity indicator for the single segments
This type of segmentation aims to divide the carriageway using the segments with the greatest value for the chosen indicator. In contrast with the previous approach, this may not lead to the segmentation with the maximum cumulative value for the indicator, but in this case the algorithm seeks the single segments with the maximum indicator value. The pseudo-code for this second algorithm is reported in Figure 13. The algorithm scans the list of progressives associated with the locations where the accidents occurred, considering each progressive as the start of a new segment. It then identifies as the end of the segment the subsequent progressive that, satisfying the minimum segment length constraint, maximizes the considered indicator, and marks as used the progressives corresponding to the segment extremes. After the first global search that ends with finding the most critical segment with respect to the considered indicator, the algorithm searches again, in the remaining portions of the motorway, the segments with the maximum indicator value, always taking into account the minimum segment length condition. Whenever a segment is identified, the corresponding portion of carriageway is removed; therefore, the algorithm progressively proceeds searching in the set of disjointed parts of the road. At the end of the search, it could be possible that some segments of length smaller than the selected minimum are included in the segmentation to complete the road partitioning; however, this does not actually cause a problem since such segments have the smallest indicator value.

The pseudo-code for the algorithm searching for the segments with the maximum indicator value
3.3 Differential analysis
The purpose of this analysis is to assess the practical effects of interventions aimed at improving safety on the motorway. These measures include either important changes in the structure of the road or equipment and/or solutions with a limited economic impact that are ready to be implemented in a short timeframe (e.g., speed cameras, new types of pavement, improved signage, change of the speed limits, etc.). The objective of the analysis is to verify whether and how the implementations have affected the accident and severity indicators. To perform this kind of analysis, the user needs to define a model using the DAT interface, as for the pattern-based analysis, choosing the type of intervention to analyse among the ones stored in the database. Following the theoretical example in Figure 14, the selected measure can correspond to the activation of a new speed limit. The user can also define some subsegments for the model, such as, for example, a section preceding the one with the intervention, a section influenced by the new speed limit and a section following the one with the intervention. The system analyses the accident performance indicators before and after the implementation of the risk mitigation measure, producing a report that presents the value of the indicators in the two different situations for all the considered sub-segments.

An example of a roadway section before and after an intervention
Figure 15 shows an example of a report yielded by the Differential Analysis algorithm, which corresponds to the installation of a new speed limit in a roadway section, where the numbers in grey highlight the improvements in the performance indicators (e.g., the number of accidents in the body sub-section has decreased from 12 to four).

An example of report produced by Differential Analysis
4. Steering of the project and validation
The research and development project that led to the implementation of the ADAM system started in 2010, initially with the purpose of automating the production of periodic reports relevant for the analysis of the possible occurrence of accidents in specific infrastructure. The collaboration between SINA technical managers and academic researchers widened the system scope. Thus, a new methodological approach was devised in order to improve the investigation and to possibly discover, through pattern and segmentation analyses, road stretches particularly critical for safety. The project also involved Autocamionale della Cisa S.p.A., an Italian company managing the A15 motorway, about 110 km in length, connecting the Italian cities of Parma and La Spezia and crossing the Apennines. Autocamionale della Cisa provided the relevant data for the A15, which allowed the ADAM functionalities and results to be tested. The evaluations were highly positive, since both technicians from SINA and Autocamionale della Cisa were able to verify the congruence of the ADAM outcomes according to their experience in this field.
4.1 Comparing the segmentation algorithms
This section reports the comparison between the two proposed segmentation algorithms applied to the southbound carriageway of the A15 (from Parma to La Spezia) and considering the number of accidents per km (Ac/Km) as a performance indicator for the period 2009 to 2011. In particular, Table 1 shows a set of aggregate information characterizing the results obtained from the algorithm maximizing the cumulative indicator (SC) and from the algorithm maximizing the indicator for single segments (SS).
The comparison between SC and SS algorithms
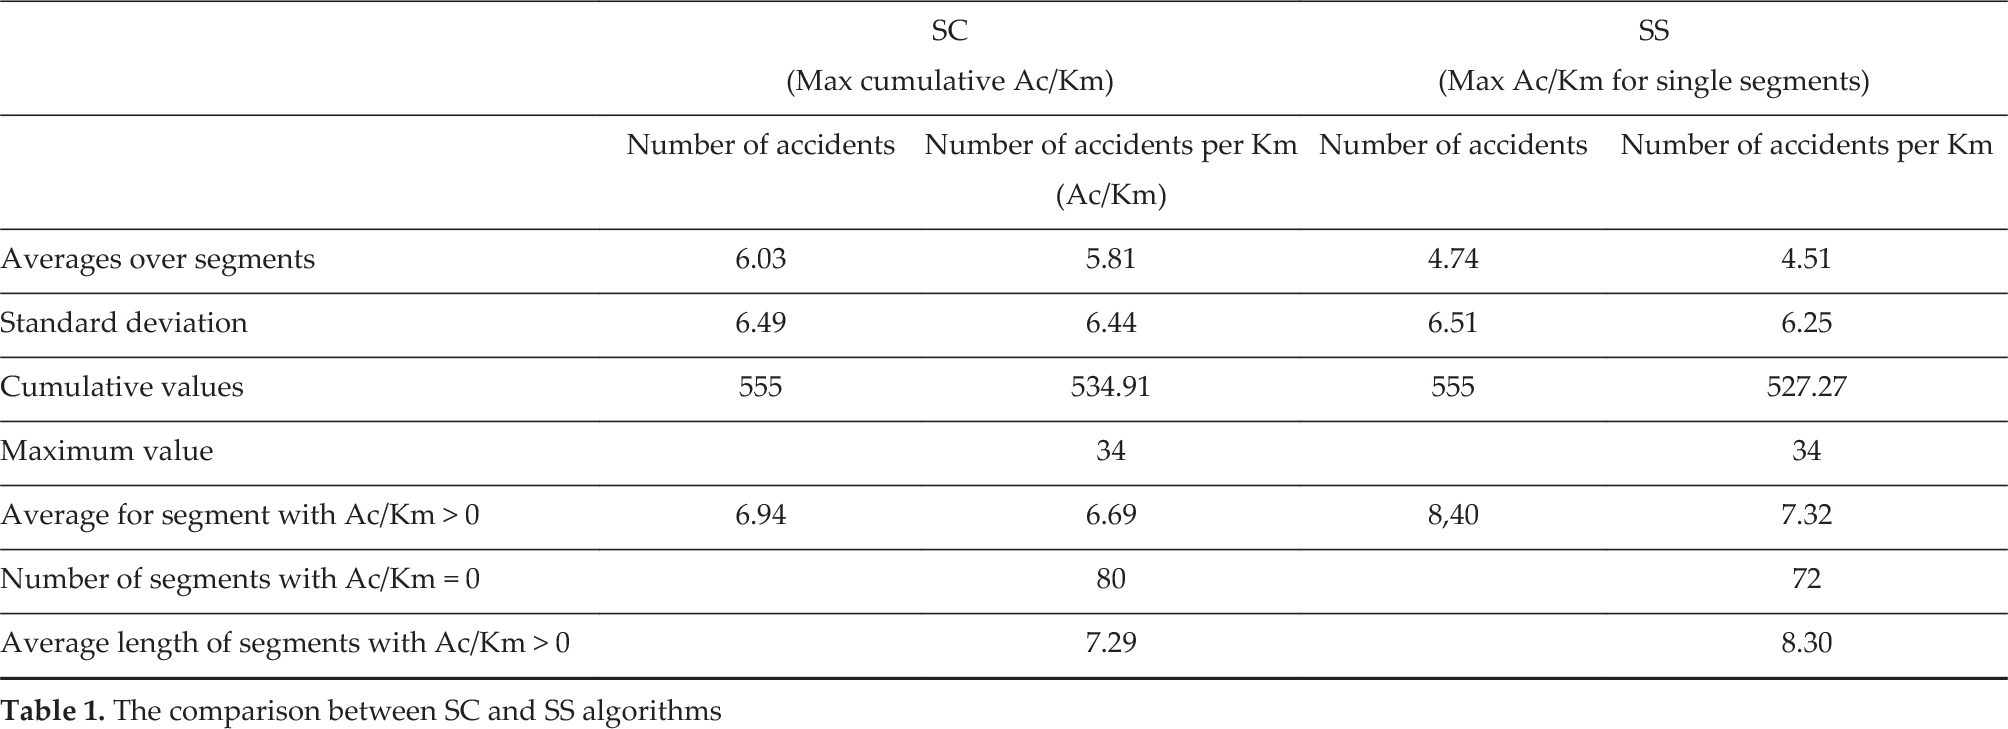
Both algorithms found the same highest critical segment, corresponding to a stretch 1 km in length (from progressive Km 96.8 to Km 97.8), where 34 accidents occurred during the considered period. As can be expected, the SC algorithm determined a road segmentation with an average Ac/Km (5.81) greater than that due to the SS algorithm (4.51) and, consequently, obtaining a greater cumulative Ac/Km (534.91 for SS compared with 527.27 for SS). On the other hand, the SS algorithm found a smaller number of segments (72 against 80 for SC), being able to aggregate the accidents into longer segments (on average 8.30 Km for SS against 7.29 for SS) and finally to individuate single segments characterized by a higher criticality (the average Ac/Km for segments with accidents is 7.32 for SS against 6.69 for SC).
This kind of result has been particularly appreciated by the decision makers, since it provided evidence for road stretches that are worth considering for interventions aimed at reducing the accident risk. In addition, the analysis methodology realized by the ADAM system allows a more detailed investigation by searching the DB for accidents occurring in patterns with the same characteristics of the most critical road segments. Hence, it has been observed that the combined use of the ADAM functionalities can increase the decision support capabilities of the system beyond those provided by the single modules.
5. Conclusions
The concept that underpins the safety analysis and the ADAM system discussed in this paper is a business intelligence application supporting safety managers' activity in monitoring and analysing the key performance indicators for road safety on motorways. The tool is able to collect a wide range of information concerning the infrastructure, the traffic volume and road accidents; it elaborates reports to monitor the evolution of key performance indicators defining road safety levels.
In this way, the system can support decisions and possible actions aimed at mitigation of risks, using a process geared to the improvement of road users' safety. The pattern oriented analysis allows the examination of recurring elements along the road, considered of interest for specific investigations or benchmarking, whereas the road segmentation analysis aims to define a list of road stretches maximizing different severity indicators. The differential analysis compares the severity for the selected indicators before and after the implementation of risk mitigation measures on a road stretch. The output of each analysis produced by the ADAM system becomes an interesting instrument for road safety managers.
The evolution of indicators can even highlight the quality of the motorway management from the point of view of safety, together with the evolution of the traffic in terms of quality of vehicles and behaviour of users. This kind of process can even underpin those actions of safety management of road infrastructure that could contribute to the achievement of the safety targets defined by national and European Authorities.
The greatest burden of the above activities lies in manually checking, possibly correcting and importing the set of heterogeneous road accident data from different sources, and integrating them with the relevant data of the related infrastructure. The proposed system greatly relieves the users of this activity, leaving them only the task of correcting the automatically discovered inconsistencies contained in the input information. In addition, SINA and Autocamionale della Cisa validated the efficiency and effectiveness of the process, through real data and application (e.g., the increase of safety as a consequence of already assumed measures). Future improvements to this project are possible, the most significant of which regard its interoperability and cost-efficiency analysis. Finally, possible future developments could even involve the transfer of the system into a web application, providing the various actors, who play the role of data sources, with remote web interface utilities to directly feed or use the information of the ADAM database.
Footnotes
6. Acknowledgements
The authors acknowledge the contribution of Roberto Arditi (SINA – ASTM/SIAS group), who performed the al design of the process that underpins the herein described.