
Abstract
In this paper, the de-noising problem of night vision images is studied for apple harvesting robots working at night. The wavelet threshold method is applied to the de-noising of night vision images. Due to the fact that the choice of wavelet threshold function restricts the effect of the wavelet threshold method, the fuzzy theory is introduced to construct the fuzzy threshold function. We then propose the de-noising algorithm based on the wavelet fuzzy threshold. This new method can reduce image noise interferences, which is conducive to further image segmentation and recognition. To demonstrate the performance of the proposed method, we conducted simulation experiments and compared the median filtering and the wavelet soft threshold de-noising methods. It is shown that this new method can achieve the highest relative PSNR. Compared with the original images, the median filtering de-noising method and the classical wavelet threshold de-noising method, the relative PSNR increases 24.86%, 13.95%, and 11.38% respectively. We carry out comparisons from various aspects, such as intuitive visual evaluation, objective data evaluation, edge evaluation and artificial light evaluation. The experimental results show that the proposed method has unique advantages for the de-noising of night vision images, which lay the foundation for apple harvesting robots working at night.
1. Introduction
With the development of science and technology, robot technology has become a mature technology. The apple harvesting robot has also reached a high stage of development [1–3]. In China, the apple planting acreage is large, the yield is high and the rural labour force is decreasing, so the harvesting schedule is tight. In order to rush deadlines and improve the work efficiency of harvesting, we carry out an experimental study of harvesting robots at night. Image processing is the key problem of harvesting robots, and night vision image de-noising is an important step in the image preprocessing.
However, night vision image de-noising is a challenge for apple harvesting robots. As the night working environment is relatively complicated, it may influence the robot's performance during the night. Until now, there has been few proposed research for night operations [4]. At night, images contain a lot of noise from factors such as light, temperature and humidity. These have a great impact on the visual system of harvesting robots and make it difficult to recognize targets. A harvesting robot adopts artificial light, but this light has many limitations and so the collected images are not clear. The optical element has an inherent sensitivity to temperature at night. However, the temperature of apple harvesting robot sensors (such as camera, image acquisition card, etc.) has an impact in terms of performance, which affects the acquisition of images. Apples are usually harvested in autumn. The air humidity is relatively larger at night, and the fog contributes to the decline in quality during robot image acquisition. Due to the above factors, night vision images contain a lot of noise. This noise directly affects the target's recognition rate, and further affects the harvesting robot's work efficiency. Therefore, in order to improve the harvesting efficiency, ensure apple harvesting during the mature period, reduce labour burden and decrease economic loss, we present the idea of apple harvesting working at night and produce a competitive apple harvesting robot.
As mentioned, the identification of a target is crucial for an apple harvesting robot. In the night environment, the images contain a lot of noise due to factors such as light, environmental temperature and humidity. These have a great impact on the visual system of an apple harvesting robot, and make it difficult to recognize targets [5, 6]. Through the subtraction image method, it is showed that the noise in night vision images is generally mixed noise, and the Gauss noise is found to be the main noise among them [7].
In fact, Gauss de-noising has attracted the attention of a large number of researchers, and many de-noising algorithms have been presented that achieved good results in many research fields [7, 8]. However, the Gauss de-noising is still a problem [8] and its performance is not ideal in real applications. Thus, in this paper, we first study the de-noising of night vision images.
It is known that the wavelet transform (WT) can capture the structures of images and textures in different resolution levels due to its localization properties in both time and frequency domains. Thus, the derived wavelet de-noising can preserve more edge information. Wavelet de-noising, as one of the most popular research topics in image processing, achieves nonlinear de-noising for images. Thus, in this study, a wavelet de-noising method is proposed for the night vision image de-noising.
There are many methods that have been developed for wavelet de-noising. The wavelet threshold de-noising method is commonly used [9]. One of the wavelet-based methods is called ProbShrink. This method is used for a probabilistic shrinkage function. Its core is estimating the probability that a given coefficient contains a significant noise-free component. Then, the wavelet coefficient is multiplied with the probability [10]. Schulte et al. Introduced a fuzzy version of the probabilistic shrinkage method. Its core is shrinkage based on the local mean of wavelet coefficients and some fuzzy rules [11]. Several fuzzy filters for noise reduction have already been developed, e.g., the iterative fuzzy control [12], the GOA filter [13] and the adaptive fuzzy filter [14]. Most of these advanced methods have mainly been developed for the reduction of fat-tailed noise as impulse noise. No noise of image wavelet coefficients is assumed to be generalized Gaussian distribution, under the priori condition to minimize the Bayesian risk. Thus, the Bayesian function is deduced. However, without considering the relationship between the scale wavelet coefficients, the de-noising image is not smooth enough [15]. This paper considered the link between scale wavelet coefficients with a joint conditional probability model to describe the relationship, which can achieve a better de-noising effect. However, the algorithm is more complex and the running time is longer [16]. Nevertheless, most of the current fuzzy techniques do not produce convincing results for Gauss noise.
However, due to the particularity of night vision images, the above-mentioned de-noising methods may not be feasible. The key problem of the wavelet threshold de-noising algorithm is how to select an appropriate threshold that directly affects the performance of de-noising. The two methods that are widely used are soft and hard threshold methods. However, with the development of applications, the disadvantages of a threshold function appear gradually. For example, for the hard threshold function, it is discontinuous and generates oscillation in reconstruction. For the soft threshold, it is continuous but there is a deviation. Therefore, the fuzzy theory [17, 18] is introduced to construct a fuzzy threshold function with a wavelet algorithm. Furthermore, the de-noising algorithm of wavelet fuzzy threshold is proposed, which can overcome potential disadvantages of the threshold function. In this way, we present a night vision image de-noising method based on the fuzzy optimization of WT (F-WT). This can maximize de-noising for night vision images and provide a basis for the accurate identification of the target from night vision images. However, at present, there are few studies about agricultural robots and night vision images.
In the application of this paper, the night vision images of an apple captured under different artificial lights are considered as research objects. Firstly, the new de-noising method is proposed. Then, we add the noise to the standard images and carry out comparative de-noising experiments to test the effect of the algorithm. The subtraction method is applied to apple night vision images for a noise analysis. We can then judge the type of noise. In order to verify the effectiveness of the new method, the experiments are conducted on the added noise images and apple night vision images. The median filter and wavelet soft threshold method are adopted for comparison. Moreover, we evaluate the de-noising performance from visual and the relative PSNR (RPSNR) aspects. The results show that the proposed method can effectively suppress noise, keep the details of the image and have the highest RPSNR for the de-noising images.
This study is mainly concerned with five contributions. Firstly, there is relatively less research on night vision images of apple harvesting robots. This study provides a theoretical basis on which a harvesting robot can operate at night. It can also be applied to other types of robot. Secondly, the key problem of the wavelet threshold de-noising algorithm is how to optimize the estimation of the wavelet coefficients. In this study, using the fuzzy optimization in the soft threshold and hard threshold, we construct the fuzzy threshold, which is between the soft threshold and hard threshold. Included in the signal of image reconstruction, the fuzzy threshold can improve the de-noising effect. It not only overcomes discontinuity of the hard threshold method but also, when the coefficient is greater than the threshold, it can reduce the standard deviation of the soft threshold method. The calculation of the fuzzy threshold method is not complex. The F-WT method has a good de-noising effect for the night vision images of this study. Thirdly, we use the subtraction method to analyse the noise of the night vision apple images. From the experiment result, the main type of noise is the Gaussian noise. Fourthly, in order to verify and calculate the de-noising effect for the night vision apple images, this paper proposes the concept of RPSNR. This provides a reliable basis for the signal-to-noise ratio calculation of the night vision images. Lastly, comparing the de-noising effect under three different light conditions, we find that the incandescent lamp is a relatively better artificial light source that provides a theoretical basis for the selection of artificial light when the apple harvesting robot works at night.
This paper is organized as follows. In Section 2, we combine the fuzzy theory with wavelet threshold de-noising, and then present an image F-WT de-noising method. In Section 3, simulation experiments validate the F-WT de-noising method by adding noise to two groups of images. We also compare the de-noising ability of three different kinds of de-noising methods. In Section 4, the subtraction method is applied to the apple harvesting robot's night vision images for a noise analysis. In order to further verify the operation effect of the de-noising proposed method, this part applies the proposed method to the night vision images. Section 5 concludes and discusses the paper.
2. The Improved Wavelet Fuzzy Threshold De-Noising Method
Wavelet transform has evolved from Fourier transform. It can be considered as the optimization of the Fourier transform. Compared with the traditional Fourier transform, it has the characteristics of a multi-resolution analysis. A wavelet analysis has the ability to represent local information of signals in time and frequency domains. That is, time windows and frequency windows can have a dynamic adjustment, according to the specific signal forms. Due to the multi-resolution capability of the wavelet transform, the wavelet theory has been widely applied in the research of image processing such as image compression [19], image de-noising [20], image fusion [21] and so on.
As we understand apple harvesting robots in more depth, the requirements for a visual recognition system are also increasing. There is noise in night vision images, which will affect the performance of the recognition system. Thus, to make apple harvesting robots work all day, the de-noising problem should be solved. The traditional technologies of image de-noising are relatively simple, and are easy to cause information loss or damage problems. Thus, the processing result is difficult to reach the ideal state. In image processing, the wavelet de-noising method is widely used. This ensures that the image after de-noising has better visual clarity, while retaining the image details.
2.1 The Mathematical Model of Wavelet Transform
Assume ψ(t) as the basic wavelet (also known as the wavelet basis function). a is scale factor and b is displacement factor. Thus, the definition of wavelet transform is:
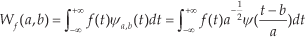
The inverse transform is:
where

Among them, ψ is the Fourier transform and Cψ takes a finite value.
If it meets the condition a ≠ 0, b and t are continuous variables in the above transformation, the wavelet transform is a continuous wavelet transform and has the property of translation invariant.
Considering the data compression and calculation reduction, a and b are limited to some discrete points, then the wavelet transform becomes the discrete wavelet transform.
2.2 Wavelet De-noising Theory
From a mathematic perspective, the essence of wavelet de-noising is the function approximation, that is, how to use the basis function of wavelet transform to expand and contract or translate a series of an expanded function space. According to the agreed criteria, we search for the best approximation of the original signal to separate the original image signal and noise signal. Wavelet transform is a method that processes images in the frequency domain. The mathematical model of wavelet de-noising is described as:

where f1 = φ1(f) (subscript 1 indicates the optimal value).

where fs is the expected image, and fe is the noise.


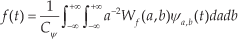
In summary, the essence of wavelet de-noising is searching for the best mapping from the actual signal's space to the wavelet function's space to get the optimal recovery of the original information. From the perspective of signal, wavelet de-noising can also be considered as signal filtering. To a large extent, wavelet de-noising can be regarded as a low-pass filter. The output can well preserve the original image features after wavelet de-noising, and its performance is far superior to the traditional low-pass filter. Therefore, wavelet de-noising is actually a combination of image feature extraction and image low-pass filter function. Figure 1 illustrates the flow diagram of wavelet de-noising.
Flow chart of wavelet de-noising
2.3 Wavelet Threshold De-noising
Wavelet transform has a good time-frequency localization characteristic. It is able to extract local singularity features of signal flexibly, which makes it a precedent nonlinear method for image de-noising. At present, there are many methods of image de-noising that are based on the wavelet theory and the optimization of the wavelet theory. For example, the de-noising method, which is based on the modulus maximum value and coefficient correlation method of wavelet transform [22–24]. In this paper, we adopt the classical wavelet threshold de-noising method.
The de-noising method is based on wavelet threshold. The wavelet coefficients of image and noise in different scales have different characteristics, thus a predetermined threshold is defined for wavelet coefficients. The wavelet coefficient, which is less than a predetermined threshold, is considered to be caused by the noise directly and set to be 0. The wavelet coefficient, which is larger than the predetermined threshold, is thought to be mainly caused by the image and we should retain or make it shrink. If the estimation of wavelet coefficients is obtained by wavelet reconstruction, the original image can be reconstructed.
2.4 Improved Fuzzy Threshold
The key problem of the wavelet threshold de-noising algorithm is how to select an appropriate threshold, that is, to optimize the estimation of the wavelet coefficients. If the threshold value is too high, the noise can be removed but, at the same time, some image wavelet coefficients are lost. The information loss of the reconstructed image is too big, so the essential image information cannot be well restored. If the threshold value is too small, most image wavelet coefficients are retained at the same time but more noise information is kept. After the wavelet reconstruction, the image still contains very high-intensity noise, so it will have a negative impact on the subsequent image processing. The commonly used de-noising methods are the hard threshold method and the soft threshold method. Although these two methods have been widely used and can achieve good results, they still have some inherent disadvantages (also known as potential risks). For example, the hard threshold function is discontinuous at the point of λ, and the reconstruction process will generate oscillation. The soft threshold method has good continuity but there is a constant deviation between the estimated wavelet coefficients and real coefficients, which will affect the reconstruction signal's approximation to the real signal. Therefore, the selection of the threshold function is crucial to achieve a good de-noising effect.
Therefore, in this paper, we introduce the fuzzy theory into the wavelet transform [24, 25], and propose the de-noising algorithm of wavelet fuzzy threshold. More specifically, we construct the appropriate membership function and determine the threshold of the wavelet coefficients with the wavelet variance information.
The definition of fuzzy threshold function is:

The value of λ is defined as:

where ̑σ is the wavelet coefficients' variance estimation of different scales, i is the wavelet's decomposition scale, and N is the length of the signal to be processed. The α's membership function is constructed as:

where α ε (0, 1). The value of W̑i,j is between soft threshold and hard threshold, as shown in Figure 2.

The fuzzy threshold function
The fuzzy theory is a powerful tool in the field of image processing. It can deal with the uncertain fuzzy and imprecise information in an image. The principle of fuzzy threshold is relative to the soft threshold method. The absolute value of W̑i,j, is less than Wij to αλ, and the smaller α is closer to the exact value. It can overcome a constant error when we apply the soft threshold method and the coefficient is bigger than the threshold value of deviation. Compared with the hard threshold, the similarity between Wi,j and λ is linearly correlated to the similarity between W̑i,j and - λ, so that W̑i,j has better continuity, which can avoid oscillation. Due to the discontinuity of λ, using the hard threshold will lead to pseudo-Gibbs phenomenon.
As

where μi,j is the wavelet transform coefficient of raw signal, and vi,j is the transform coefficient of noise signal. The de-noising process is transformed into the optimization process of ||W̑i,j - μi,j|| and the aim is to get the minimum value. Therefore, in this research, we introduce the fuzzy membership function α and make the value of | W̑i,j| between | Wi,j | - λ and | Wi,j |, so that signal estimation wavelet coefficients Wi,j which are closer to the wavelet coefficients of original signal μi,j, can be obtained to get the best de-noising performance.
2.5 Mallat Algorithm
Let fj+1(x, y) ɛ L2(R2) and set Vj2 (j ɛ Z) as L2(R2)'s separable multi-resolution analysis. The φ(x, y) = φ(x)φ(y) is relative to the two-dimensional scaling function. ψ(x) is the one-dimensional standard orthogonal wavelet and it corresponds with the scale function. We define three two-dimensional wavelets,

Formula 11 is respectively the standard orthogonal basis in L2(R2), there are:

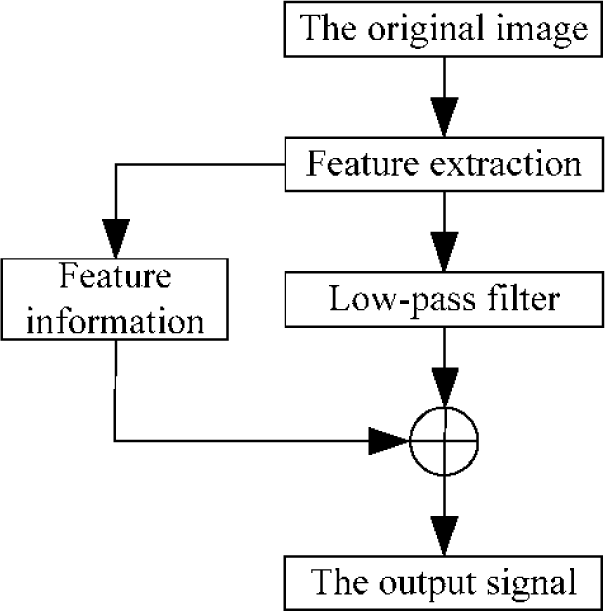
Use the scaling function and orthogonal of wavelet function to get the decomposition algorithm:
Its reconstruction algorithm is:

Figure 3 and 4 represent the diagram of Mallat wavelet decomposition and reconstruction algorithm, respectively.

The flow chart of the wavelet decomposition algorithm
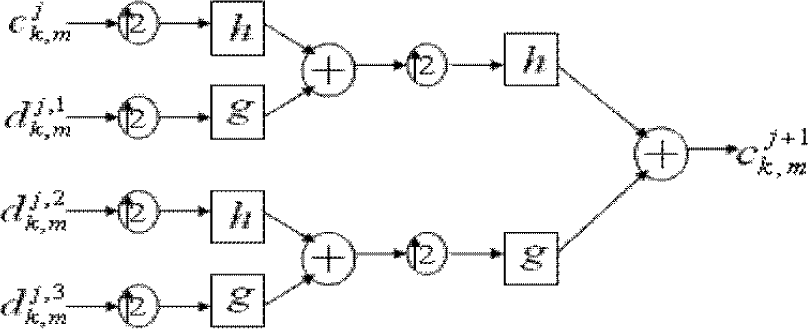
The flow chart of the wavelet reconstructing algorithm
2.6 F-WT De-noising Algorithm
The basic idea of the F-WT de-noising method is: signals that contain noise on each scale wavelet are decomposed and the maximum scale wavelet coefficients (low resolution) are retained. For the other scales of high frequency wavelet coefficients, by setting a threshold value of wavelet coefficients, the amplitudes, which are less than the threshold, are set to zero, and the amplitudes, which are more than the threshold, should be retained. Finally, in order to recover the original signal, the retained wavelet coefficients are reconstructed by wavelet inverse transform. One of this study's contributions is the de-noising of night vision images.
In this study, we use fuzzy optimization in the soft and hard threshold, and construct the fuzzy threshold to include the part between the two in the signal of image reconstruction. This improves the de-noising effect. The fuzzy threshold not only overcomes the discontinuity of the hard threshold but also, when the coefficient is greater than the threshold, it can reduce the standard deviation of the soft threshold method. The calculation of the fuzzy threshold method is also more convenient.
The basic steps of the wavelet fuzzy threshold de-noising algorithm are as follows:
Step 1. Calculate the orthogonal wavelet transform of the noisy images, select the appropriate wavelet basis and wavelet decomposition level J, use the Mallat decomposition algorithm to make the noisy image to the J layer wavelet decomposition, and obtain the corresponding coefficients of the wavelet decomposition.
Step 2. From 1 to J layer, make the decomposed high frequency coefficients quantify the fuzzy threshold to get the estimated wavelet coefficients.
Step 3. Make wavelet transform, according to the J layer's scaling coefficients after image wavelet decomposition and wavelet coefficients of each layer by fuzzy threshold quantization. Use the Mallat reconstruction algorithm for wavelet reconstruction and get the image de-noised.
3. Simulation Experiments
To verify the universality of the algorithm in this paper, the two groups of added noise standard images are selected. These are then applied in order to conduct comparative de-noising experiments. We make comparisons between the median filtering de-noising (MF), classical wavelet soft threshold de-noising (WST) and wavelet fuzzy threshold de-noising (F-WT) methods. We carry out the analysis and evaluation from three aspects: an evaluation of the visual effects, an objective data evaluation and an edge evaluation. The experimental results show that the proposed method can achieve the optimal de-noising performance, compared with the traditional methods.
3.1 The Objects of the Simulation Experiments
In this paper, the standard Lenna image and an apple image in natural light are selected for the simulation of the proposed fusion de-noising algorithm. The size of the standard Lenna image is 512×512. For the environment of the collected apple image, the lens is a megapixel industrial AFT-0814MP lens. The focal length is 8 mm, the view angle is 54 degrees, the relative through optical path is F1.4-C, the surface size of image is 1/2 and the nearest distance is 0.15 m. The apple image is photographed under natural light. We assume that the apple image that is photographed in the daytime is clean and noiseless. The images are collected in the apple base of the Dashahe Town of Fengxian County in Jiangsu Province.

The original greyscale images. (a) Lenna image. (b) Natural light apple image.
In this paper, the experimental environment is: CPU Intel Core2 Duo E7300 2.66 GHz, RAM 1.99GB, Intel graphics G33/G31 ECF, MATLAB R2012a. The original greyscale images are shown in Figure 5. Gauss noise with σn2=0.05's and σn2=0.1's are added to Figure 5 respectively. The results are shown in Figure 6 and Figure 7.

The images of added σn2=0.05 Gaussian noise. (a) Lenna image added σn2=0.05 Gaussian noise. (b) Natural light apple image added noise.

The images of added σn2=0.1 Gaussian noise. (a) Lenna image added σn2=0.1 Gaussian noise. (b) Natural light apple image added noise.
3.2 Experimental Parameter Settings
In order to better verify the running effect of the proposed de-noising method, we made comparisons between the MF, WST and F-WT methods.
The first method is a two-dimensional median filtering with a window size of 3×3. It can keep the details of the image, whilst simultaneously saving the computational cost.
The wavelet decomposition levels are normally 2–5 layers, as increasing the layers costs much computation and decreasing the layers influences the decomposition capability. In this experiment, the soft threshold method is used for wavelet de-noising with the decomposition layers set as 3 and the wavelet decomposition layer of fuzzy threshold set as 3.
3.3 Simulation Results
The comparison of de-noising two standard images in Figure 6 and Figure 7 are conducted using the MF, WST and F-WT methods. The results are illustrated in Figure 8 and Figure 9.

The comparison of three de-noising methods for Figure 6

The comparison of three de-noising methods for Figure 7
3.4 The Simulation Results Analysis and Evaluation
3.4.1 Evaluation of Visual Effects
As shown in Figure 8 and Figure 9, it can be observed from the obtained low noise image that the normal median filtering method can reduce the noise to a certain extent. However, obvious noise still remains, which makes it a poor performance in the real application.
The edge information in the image processed by the wavelet soft threshold method is clearer than the image processed by the median filter. However, a lot of noise remains in the background, which implies that further improvements are still needed. The low noise image resulting from the wavelet fuzzy threshold contains the least noise. Moreover, the edges of objects are relatively smooth, and the edge details and image contrast are better preserved.
3.4.2 Objective Data Evaluation
In Figure 8 and Figure 9, the proposed F-WT de-noising method of this paper is compared with the other two methods. It can be observed that the de-noising image by the proposed method contains the least noise and is the clearest one. To avoid subjective factors by a visual evaluation and to make the evaluation more accurate, the PSNR is calculated. The results are listed in Table 1.
The PSNR of the low-noise and the original images

In the low noise images resulting from the three de-noising methods, the PSNR of the median filter is lower than that of the other two methods. The wavelet soft threshold de-noising method is larger than that of the median filter but less than that of the F-WT method. This indicates that its performance of de-noising is better than the median filter but worse than the F-WT. The PSNR of low noise image with the wavelet fuzzy threshold de-noising method is significantly higher than the others, which means that it achieves the best performance among the compared de-noising methods.
Table 1 shows the simulation de-noising results of two kinds of noise strengths. Through the F-WT de-noising method, the PSNR increases by 24.25%, compared with the added noise (σn2=0.05). Furthermore, the PSNR increases by 26.68%, compared with the added noise (σn2= 0.1). From the simulation results, the proposed de-noising method has the same trend when it is used for de-noising varying noise strengths. Based on the data from the calculation of the PSNR, the F-WT de-noising method has a stronger ability for higher noise images.
Table 1 also shows the running time of three different de-noising methods. From the view of running time, the MF de-nosing method is the shortest and the WST de-nosing method is the longest. However, after optimizing using the fuzzy theory, the F-WT running time is significantly shortened.
In order to verify the significance of these de-noising methods, the difference test, which consists of a two-factor and non-repetitive analysis of the variance, is made for three de-noising methods. The column variance analysis is listed in Table 2.
Analysis of variance for three de-noising methods

As seen in Table 2, F0.05(6,2)=19.33<24.5263 and F0.05(6,3)=8.94>6.9977, which are below the significant level α=0.05. Thus, the PSNR with three kinds of de-noising methods has significant differences with varying noise strengths.
3.4.3 Edge Evaluation
In this paper, in order to verify the capability of preserving image textures and edges for the proposed method, we calculated the joint statistical distribution of pixel grey and edge gradient with three de-noising methods. The grey-gradient co-occurrence matrix was used to extract the image texture features [25]. We set the Lenna image with a noise intensity σn2=0.05 as an example, and selected and calculated the following eight typical texture features: energy T1, correlation T2, grey entropy T3, moment of inertia T4, grey average T5, gradient average T6, entropy of mixing T7 and inverse different moment T8. As shown in Table 3, OI represents the original image, NI represents the adding noise image, MF represents the de-noising result with median filtering, WST represents the wavelet soft threshold de-noising results, and F-WT represents the wavelet fuzzy threshold de-noising results. From these results, the texture features of the image de-noising with the F-WT method are closer to the original image. This indicates that the texture features are best kept using the proposed method.
The typical texture feature comparison of different noise reduction methods for Lenna

In order to further verify the proposed image de-noising method, the results of edge detection with Lenna image (the original image, noise image, the de-noising image with three kinds of methods) are shown in Figure 10, where the noise intensity of σn2=0.05 is added. The Canny edge detection operator is the most commonly used method of edge detection operator. It is recognized as an excellent edge detection operator [26]. It can be observed from Figure 10 that the edge detection results of the F-WT de-noising method can effectively extract the whole contour information of the image, which is similar to the original image. Thus, the image obtained by this method can better maintain the image textures, detail information of edge, and so on.
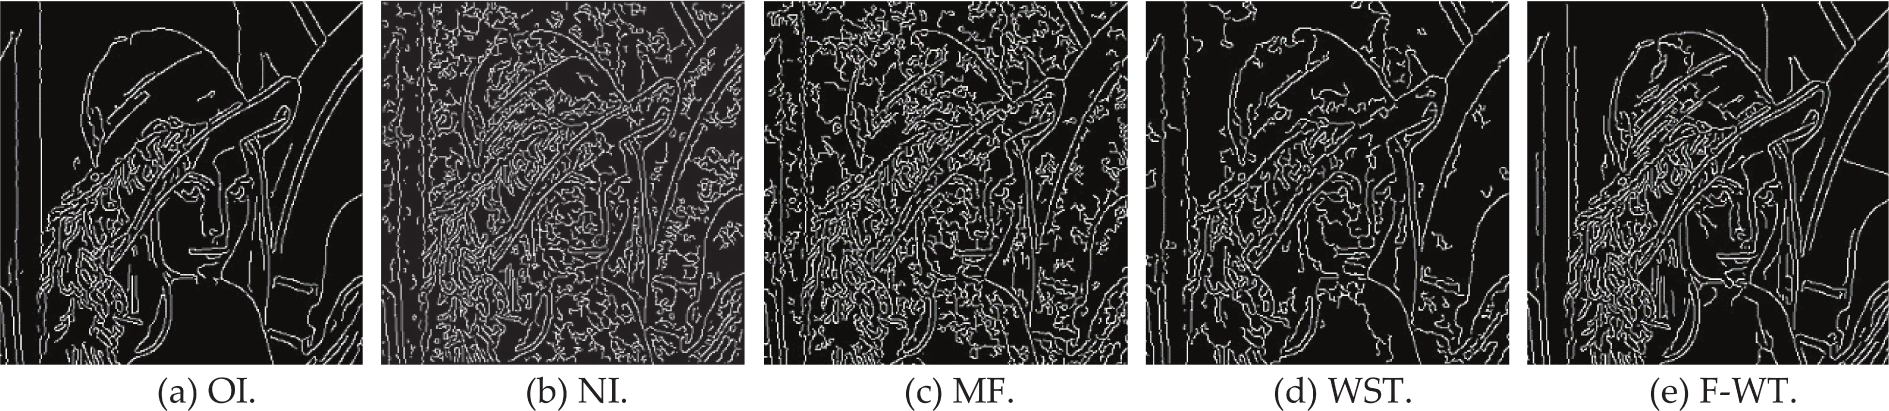
Canny operator edge image detection for Lenna
In the experiments, as shown in Figures 8–10 and Table 1–3, we compared the de-noising ability of three different kinds of de-noising methods. The results showed that the effect of the proposed F-WT de-noising method is the optimal.
4. Apple Night Vision Image De-noising Experiments Based on the Wavelet Fuzzy Threshold
In this section, firstly, we analyse the apple night noised vision image and judge the type of noise. Three kinds of de-noising methods are applied to carry out the comparison experiments. To calculate the signal-to-noise ratio, we propose the concept of RPSNR. Lastly, combined with the result of the experiments, we analyse and evaluate the ability of de-noising methods and the selection of artificial lights from four aspects: intuitive visual evaluation, objective data evaluation, edge evaluation and artificial light evaluation. The purpose of this section is to further validate the performance of the proposed method.
4.1 Apple Night Vision Image Collection and Noise Analysis
To make apple harvesting robots able to work at night, an artificial light source is needed to enhance the poor natural night lights. The artificial light source has many disadvantages such as its small range, uneven light distribution and the poor stability. However, as it can be easily controlled, the artificial light source is still widely used in agricultural production and daily life.
4.1.1 Night Vision Image Collection
The night vision images collected in this study are all captured under natural light illumination, which is lower than 1 LUX. We acquire these images under different artificial lighting conditions. The light intensity tester is TASI-8720, and the scope of testing is 0–20 million LUX. The images are collected in the apple base of the Dashahe Town of Fengxian County in Jiangsu Province. The power of the artificial light source is provided by a lead-acid battery (12V, 36Ah).
The following three types of lamps provide the artificial light, respectively: an incandescent lamp (DC 12V, 35W), a fluorescent energy-saving lamp (DC 12V, 9W) and a LED lamp (nine groups 1W with aluminium plate beads). The lens is a megapixel industrial AFT-0814MP lens. The environment of the collected apple image is a megapixel industrial AFT-0814MP lens. The focal length is 8 mm, the view angle is 54 degrees, the relative through optical path is F1.4-C, the surface size of image is 1/2, and the nearest distance is 0.15 m. In this paper, the experimental environment is the same as in Section 3.
4.1.2 Night Vision Image Noise Analysis
Figure 11 shows the apple images collected from the same point under natural light, an incandescent lamp, an energy saving lamp and a LED light, respectively with the same camera angles.
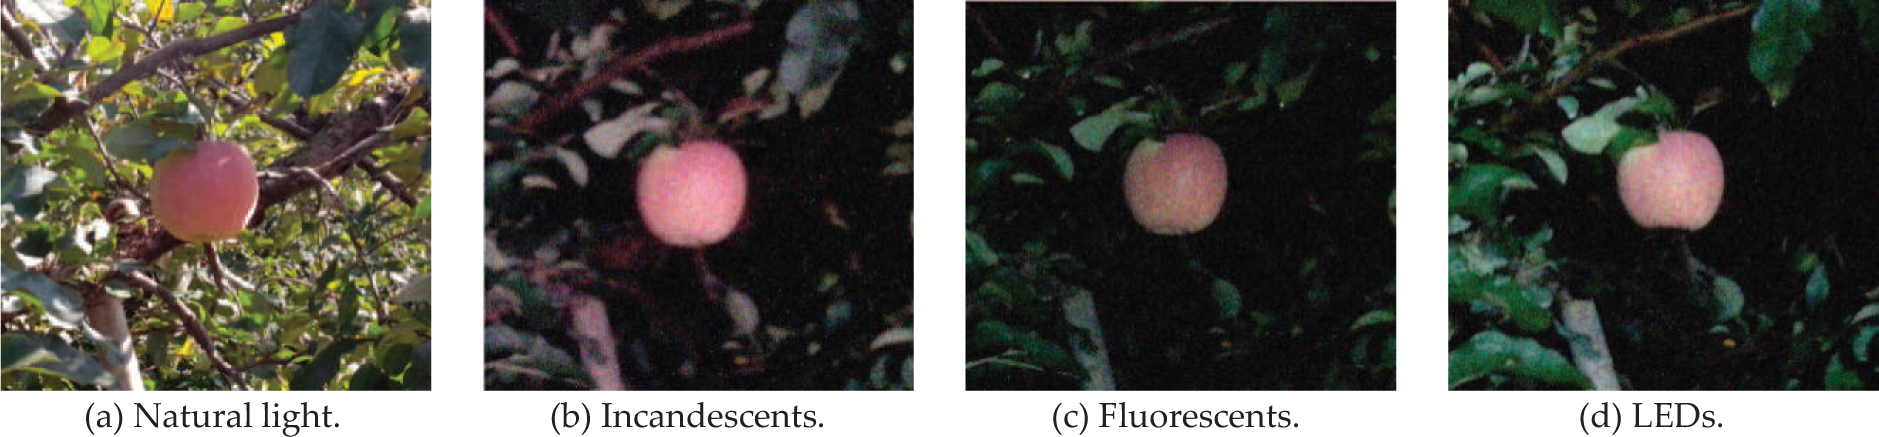
The apple original images under natural and different artificial light
From the images in Figure 11, the apple night vision images obtained in the night artificial light environment contain obvious noise, compared with the apple image collected under natural light. To show the image noise more clearly, they are converted into grey images, as shown in Figure 12. It can be observed that the noise in the night vision images is mixed noise, which contains salt and pepper noise and some other unknown noise.

The greyscale of the apple original images
In the experiment, different methods were applied to the collected images for a noise analysis [27, 28]. We used a colour CCD camera and an incandescent lamp providing artificial light source. The two images with the same size were captured continuously at the same angle and the same sampling point. They were then converted to greyscale images, as shown in Figure 13 (a) and (b).

Continuous collection of two greyscale images
The subtraction method is actually an algebraic operation for image processing. For the two input images, we subtract computing in a point-to-point way, and then get the output image. By subtracting P2(x, y) from P1(x, y) of the test image, we can obtain the image changing part G(x, y). The formulation is as follows:

The main principle is that the images are taken under the same conditions, that is, the perspective, the intensity of the artificial light illumination and the image acquiring equipment are the same. We continuously collected two night vision images, which are used in the subtraction method. Through the subtraction method, the noise of the night vision image is analysed. It also provides a reference for the noise analysis of other types of robot's night vision images.
If no noise is presented, the grey value of the corresponding subtraction should be 0, otherwise, the grey value of the corresponding part should not be 0 as the resulting image contains noise. Thus, the noise presented in an image can be determined. For example, one night vision image is subtracted by another and the resulting image is obtained, as shown in Figure 14 (a). From the corresponding grey histogram, as shown in Figure 14 (b), it is observed that the distribution of the histogram is approximate to the Gauss distribution. Thus, besides the salt and pepper noise, the noise in this image mainly consists of Gauss noise.

Subtraction image method. (a) Figure. 13's subtraction image method result. (b) Figure. 14 (a)'s histogram.
4.2 Experimental Parameter Settings
The experimental results in Section 3 show that the F-WT de-noising method can improve the PSNR of the image. In order to further verify the operation effect of the proposed de-noising method, we applied this method to the apple harvesting robot's night vision images. We compare the median filtering de-noising, the wavelet soft threshold de-noising and the wavelet fuzzy threshold de-noising methods. The parameter setting in this experiment is the same as in section 3.
4.3 Night Vision Image De-noising
The de-noising processing was made to three collected night vision images. The low noise images obtained by using three de-noising methods are shown in Figures 15–17. Figure 15 shows the de-noising results of the median filtering method. Figure 16 shows the de-noising results of the wavelet soft threshold method. Figure 17 shows the de-noising results of the wavelet fuzzy threshold method. From left to right, Figures 15–17 denote the de-noising effect of three types of light sources, which are incandescents, fluorescents and LEDs.

The de-noising results of the median filtering method

The de-noising results of the wavelet soft threshold method

The de-noising results of the wavelet fuzzy threshold method
4.4 RPSNR
In order to evaluate the de-noising performance from the value aspect more accurately, the concept of the RPSNR is present. This can overcome the shortage of the signal-to-noise ratio, which needs to be calculated based on a noise-free image. The RPSNR is defined as follows:
As we all know, we need a noise-free image to be the benchmark to calculate the PSNR. In a night vision image, we consider the image obtained under daylight as the benchmark. This is identified as the original noise-free signal and regarded as the signal reference of other images. In this way, the calculated PSNR is defined as the RPSNR. The proposed RPSNR concept is one of this article's contributions.
The image collected under natural light is used as the universal benchmark for the night vision image. As the standard is same, the proposed RPSNR concept is comparable and feasible. As the study of the natural light image is relatively mature, the setting of the benchmark is rational. RPSNR facilitates the evaluation of the de-noising effect in a quantification way in Section 4.5.2. The use of RPSNR to verify the de-noising effect of different methods is more convincing.
4.5 Experimental Results and Analysis
We evaluate the de-noising performance from the visual and objective aspects, respectively. A human visual evaluation evaluates low noise images obtained from de-noising directly by a human. To some extent, the standard of this evaluation has a personal subjective bias. Objective data evaluation uses the RPSNR for measurements, so the numerical value is objective and fair.
4.5.1 Intuitive Visual Evaluation
From Figures 15–17, compared with the image obtained by the median filter and wavelet soft threshold de-noising method, the image obtained by the wavelet fuzzy threshold de-noising is the clearest, and the preservation of the edge details are the best. It also confirms the conclusion of the simulation experiment in Section 4.3.1. In Figures 15–17, from a visual point of view, the three kinds of de-noising methods reduced the noise pollution of the night vision image to a certain extent. However, we compared the low noise images obtained via the three kinds of de-noising methods and found that the de-noising effect of the median filtering method is relatively poor, as more noise remains and the image is still fuzzy. The wavelet soft threshold de-noising method can produce a clearer image than the median filtering, but there is still a lot of noise. The de-noising effect is not ideal, thus it needs to be further improved. The F-WT's de-noising effect is relatively better, compared with the other two kinds of de-noising methods. The image better preserves the image texture and edge details, which makes it the clearest and with least amount of noise.
The F-WT de-noising method can greatly improve the restoration ability, thus the visual quality has been greatly improved. However, the visual quality can be impacted by subjective factors, so the evaluation of the de-noising may not be fair and objective.
4.5.2 Objective Data Evaluation
In order to avoid an unfair evaluation caused by subjective factors, we made a further calculation of the RPSNR of the low noise image. The results are listed in Table 4.
The RPSNR of the low-noise and the original image

As shown in Table 4, the table codes are the same as Table 3. The different de-noising methods were compared in a numerical way. It can be observed that the RPSNR of the low noise image is the highest with the F-WT de-noising method, and it was significantly better than the other two methods.
By applying the wavelet fuzzy threshold de-noising method, the RPSNR increases by 24.86%, compared with the original night vision image. Compared with the median filtering de-noising methods, it increases by 13.95% and compared with the classical wavelet threshold de-noising method, the average increases by 11.38%.
From the point of running time, the F-WT de-noising method is slightly higher than the MF method, but significantly lower than the WST de-noising method. However, from the de-noising effect, the proposed method is optimal. Compared with the WST de-noising method, the running time of the F-WT de-noising method is decreased by 25.15%, but it greatly improved the WT operating efficiency of the algorithm. Therefore, the F-WT de-noising method runs a little longer than the MF de-noising method, but the de-noising ability has improved significantly.
4.5.3 Edge Evaluation
In order to verify the capability of preserving apple image textures and edges for the proposed method, we also calculated the joint statistical distribution of the pixel grey and edge gradient with three de-noising methods. The grey-gradient co-occurrence matrix was used to extract the image texture features. We set the apple image under the incandescent lamp as an example, and selected and calculated the following eight typical texture features: the selected texture features are the same as in Section 3.4.3. As shown in Table 5, NII represents the natural light image, ILI represents the incandescent light image and the remaining table codes are the same as Table 3. From Table 5, we can also get the same result that the texture features of image de-noising with the F-WT method are closer to the original image, and the texture edges are best kept by using the proposed method.
The typical texture feature comparison of the different noise reduction methods for apple

In order to further verify the feasibility of the proposed image de-noising method, the results of the Canny edge detection with apple image (the natural light image, the incandescent light image and the de-noising image with three kinds of methods) are shown in Figure 18. It can be observed from Figure 18 that the edge detection results of the F-WT de-noising method can effectively extract the whole contour information of the image, which is similar to the natural light image. Thus, the image obtained by this method can better maintain the image textures, detail information of edge, and so on.

Canny operator edge image detection for the apple
Through these series of experiments, as shown in Figures 15–18 and Tables 4–5, we compared the de-noising ability of three different de-noising methods. The result showed that the effect of the proposed method of this study is not only suitable for the standard images but also, for the night vision apple images.
4.5.4 Artificial Light Evaluation
The comparison chart of the RPSNR for the night vision images and processed low noise images by three methods are illustrated in Figure 19. The data in Figure 19 are from Table 4.
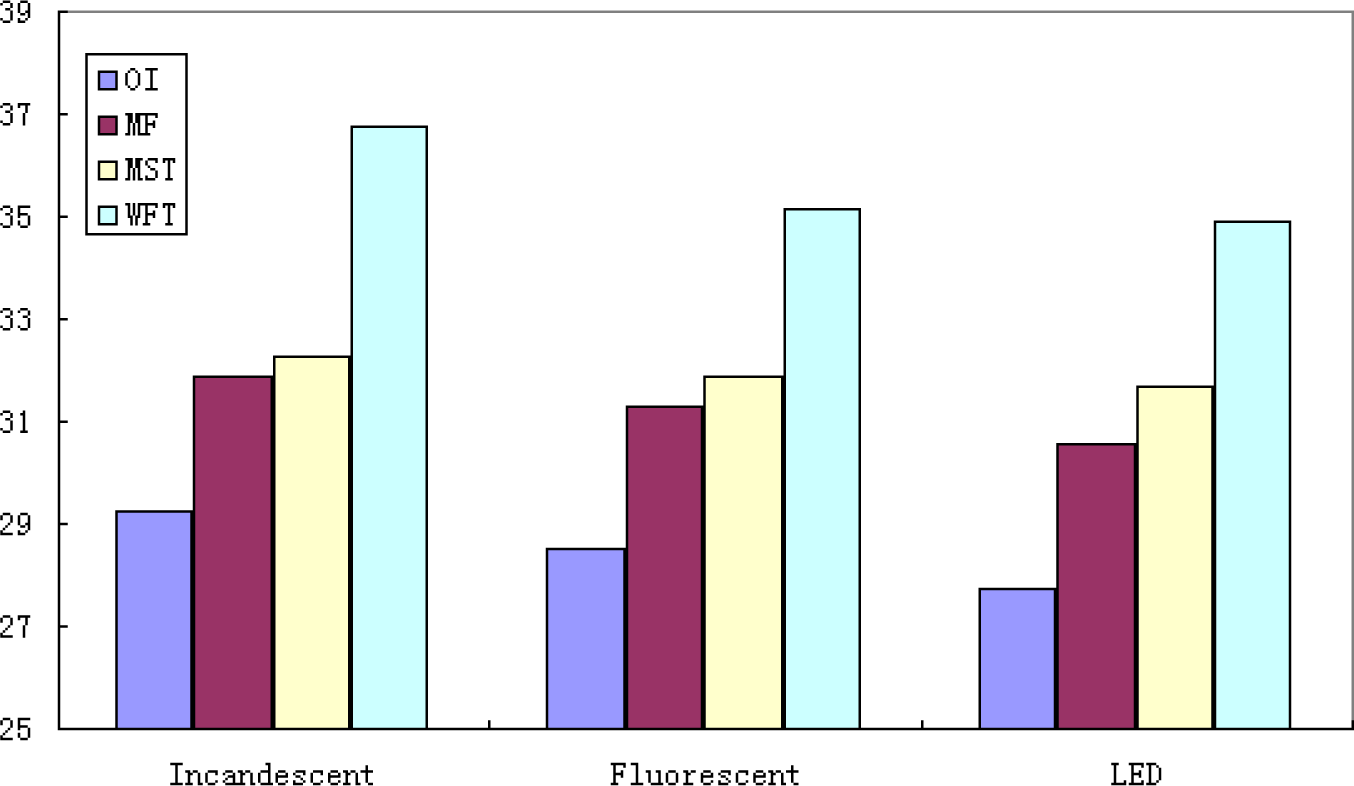
The RPSNR contrast chart
We also compared the three selected night vision images under artificial light. From Figure 19, we can get some new findings from another perspective. It can be seen that the RPSNR of the night vision image under the incandescent lamp achieves the highest rate, which indicates that the noise is minimum. After applying all of the above de-noising methods, the RPSNR is still the highest, which demonstrates the effectiveness of the de-noising method. Therefore, the incandescent lamp is suitable for the artificial auxiliary light of harvesting robot, and it can also benefit the next step of image recognition.
From Figure 19, the experimental results show that the night vision image de-noising effect has a certain link with the selection of artificial light. At night operations, the apple harvesting robot may use the mixture light source. However, the experimental results show that the images collected under the incandescent lamp have a better de-noising effect. Selecting the incandescent lamp as the artificial light source has its unique advantages in image collection and image de-noising. The results provide a theoretical basis to select artificial light for apple harvesting robots working at night – a further contribution of this study.
In summary, we make a comparative analysis for the visual effect and the numerical value of three different de-noising methods. The results show that the proposed wavelet fuzzy threshold method can achieve the optimal de-noising performance. Moreover, from Table 1 and Table 5, the image de-noising method that is proposed in this paper, which is used for the simulation experiment and the night vision image experiment, has the same trend of noise reduction. The results are matched between the simulation experiment and night vision image experiment. The F-WT image de-noising method has a good de-noising effect for the two kinds of experiment. This method verifies the feasibility of night vision image de-noising for apple harvesting robots. The next step of our main work is to combine the method with apple harvesting robots, research the feasibility of harvesting and improve work efficiency at night.
5. Conclusion and Discussion
In this paper, we make relevant research on night vision images that are collected under different artificial light. The night working environment is complicated and is influenced by factors such as light, temperature, and so on. There is a large amount of noise in night vision images and the difficulty of image processing increases. According to the characteristics of the noise, the fuzzy theory is introduced to construct the fuzzy threshold function with the wavelet algorithm. The de-noising algorithm of wavelet fuzzy threshold is proposed, which can overcome the potential risk of threshold function. Therefore, we present an image de-noising method that is based on the fuzzy optimization of WT, which can be used on apple harvesting robots working at night. In order to verify the effectiveness and universality of this new method, the proposed method is used in de-noising for the added noise standard images. It is compared with the median filtering de-noising method and wavelet threshold de-noising method, respectively. In the simulation experiments, the results show that the low noise image obtained by the F-WT de-noising method contains the minimum noise, and its PSNR is the highest. The edge information can be well preserved, and the significant differences among the de-noising abilities of the three kinds of de-noising methods are shown. Then, in the experiments, we make the noise separation of night vision images through the subtraction method. We then determine the type of noise, which consists mainly of Gauss noise and is mixed with salt and pepper noise. Therefore, the experiments are repeated on several night vision images captured under different artificial illuminations. The results show that the effect is the same as the simulation experiment from a visual point of view, and the F-WT de-noising method achieves the best performance. In order to explain the effect of de-noising from the objective value, in this study, natural light images are set as the standard for reference and the RPSNR is defined. From the objective value, the RPSNR is the highest via the new de-noising method. Compared with the classical wavelet threshold de-noising method, the average RPSNR increases by 11.38%. Compared with median filtering de-noising methods, it increases by 13.95% and compared with the original images, it increases by 24.86%. From the point of running time, the running time of the F-WT de-noising method is decreased by 25.15%. This shows that the new algorithm for night vision image de-noising is feasible, and the effect is obvious. The edge detection results of the proposed method can effectively extract the whole contour information of the image, which is similar to the natural light image. Thus, the images obtained by the F-WT de-noising method can better maintain the image textures, detail information of edge, and so on. Moreover, the RPSNR is the highest under the incandescent lamp when choosing different lighting conditions. The apple harvesting robot may use a mixture light source, but selecting the incandescent lamp as the artificial light source has its unique advantages in image collection and image de-noising. The results provide a theoretical basis for selecting artificial light for apple harvesting robots working at night.
Overall, there are very few studies for apple harvesting robots working at night. Thus, a lot of work still needs to be done and there are many problems that need to be solved, such as the selection of a camera for apple harvesting robots, the mixture of artificial light, the same light source with different power, and so on. All of these will affect the quality of night vision images. There are some uncontrollable factors, for example, temperature and humidity, whose influence also need to be dealt with. We can then build a more effective image processing method. Besides noise reduction, there are many other problems for night vision image processing, such as segmentation, recognition, and obstacle avoidance during harvesting, path planning, and so on. All of these factors restrict night operation and need to be studied in further work.
Moreover, research on night vision image de-noising is an important issue for improving image quality. At present, in this paper, the image de-noising algorithm is proposed by combining it with the apple harvesting robot. Though the method also has the de-noising effect to other images, its purpose is to verify the apple harvesting robot vision image de-noising ability under different artificial light. The experimental results also show that this method has a certain link with the selection of artificial light source. The universality and applicability methods for other types of robots will also be a part of our future research.
Footnotes
6. Acknowledgements
This work is supported by the National Nature Science Foundation of China (No. 31571571; 61379101); Priority Academic Program Development of Jiangsu Higher Education Institutions (PAPD); The Specialized Research Fund for the Doctoral Program of Higher Education of China (No. 20133227110024); The Major Research and Development Project (Modern Agriculture) of Zhenjiang City (NY2015022; NY2015025); Ordinary University Graduate Student Research Innovation Projects of Jiangsu Province (No. KYLX15_1075).