
Abstract
This paper examines whether different approaches for estimating the technical efficiency of a primary healthcare centre —PHC— can have significantly different results. Although effective regulation demands the development of measures for establishing good operation levels, few studies have compared results from a data envelopment analysis —DEA— and stochastic frontier analysis —SFA—in a PHC. Furthermore, to the best of our knowledge, no studies have used Chilean nationwide data. Efficiency refers to the relation between the number of output units per input unit. Effectiveness evaluates the outcome of medical care and can be influenced by efficiency.
The data that were used in this study came from 259 Chilean municipalities. We included two outputs – medical and check-up visits – and three inputs – staff, general service and drugs expenses. For the DEA, we used a variable return to scale output-oriented model. Before applying the SFA, a principal component analysis —PCA— combined the two outputs. The results were similar for both methods: the SFA efficiency averages were 70.89% and 65.83% and the DEA averages were 68.37% and 54.46% for the urban and rural municipalities, respectively. In addition to defining a frontier of “best practice”, this study merged the PCA with the SFA to form an innovative approach to combining outputs.
1. Introduction
In recent decades, the Chilean government has placed an increased emphasis on providing better access, equity and quality of services in healthcare. Back in 1960, the number of infant deaths aged one year or younger per 1,000 live births was 120.3. More recently, in 2012, the reported infant mortality rate was 7.4 [1]. Another important index is life expectancy at birth. Over the same period, this increased by 29%. From 1960 to 2010, this index increased from 56.20 to 79.1 years, which was similar to those of developed countries [2]. In 2012, the total health spending accounted for 7.3% of the gross domestic product – GDP – in Chile. This was less than the average of 9.3% in organizations for economic cooperation and development – OECD – countries. In nearly all OECD countries, the main source of health funding is the public sector, with the exception of Chile and the United States. In Chile, 49.2% of health spending is funded by public sources, which is far below the average of 72.3% in OECD countries. Regarding the supply of health workers, in 2012, there were 1.7 doctors per 1,000 population in Chile, compared with the OECD average of 3.2. The same happened with the number of nurses, which totalled 4.2 nurses per 1,000 population in 2012, compared with the OECD average of 8.8 [3].
Public expenditure needed to be increased to cover the needs that mainly originated from the socio demographic changes of the population and the need for a modern infrastructure. This resulted in a growth of the type, quantity and cost of health services that were provided due to new technologies and the latest clinical treatments. The Chilean healthcare system is a combination of private and public insurance coverage. The last registered reported number for public coverage in 2011 was a total of 12,912,161 people, an increment of 3.49% with respect to the 2009 data [4]. This represents 75.53% of the estimated Chilean population for 2010. Relating to primary care, public coverage is provided by PHCs. Municipalities in the form of health municipal offices or corporations manage 90% of these. These centres are coordinated and supervised by 29 healthcare service offices throughout the country. The centres are financed by municipalities, using several sources of income: a per capita government funding, which is adjusted for several factors; local government contributions, which vary according to their annual incomes; health government programmes, which have a fixed target; and investments, which are centralized either regionally or nationally. The per capita amount that is assigned is generally not enough to cover the requirements of the population. Therefore, some municipalities with more economic resources contribute to supporting the PHC centres under their administration. Worldwide, several studies have used parametric and nonparametric methods, such as DEAs and SFAs, to assess the technical efficiency of hospitals and health centres, as reviewed by Hollingsworth, B. (2003). Technical efficiency “…refers to the ability to minimize input use in the production of a given output vector”[6]. This method employs inputs and outputs in physical units, without using any price information. Thus, if a unit under study is technically efficient, it is placed on the frontier. An appropriate combination of efficiency and effectiveness should lead to a higher level of performance. Both methods require the construction of a production frontier, which is used to evaluate the performance of each PHC. Whilst most literature has focused on applying DEAs to public healthcare organizations, relatively few studies have attempted to compare DEAs and SFAs in PHCs. Furthermore, no studies have been performed on a national scale basis in the Chilean context [7]. Using a SFA allows the separation of random effects from the contribution of variation in technical efficiency. However, a SFA is difficult to compute and cannot handle multiple outputs. On the other hand, a DEA, a deterministic method, which is the most common approach for measuring efficiency with multiple inputs and outputs, could lead to measurement errors and the exclusion of unobserved and possibly relevant variables. The main research question is: are the scores that are estimated using any of the approaches consistent enough to assist the decision-making process of Chilean PHC? It has been argued that, if the estimates that are produced by both methods do not agree, this could be caused by random “noise”. Alternatively, it could be a sign of data deficiencies [8]. Thus, the main challenge of this study was to have an analogous number of variables for the inputs and outputs, while using both methods. Therefore, the principal component analysis technique was used to combine the two outputs that were used for the DEA model into one output for the SFA model. This was a unique and new approach. A PCA was used to reduce the dimensionality on the variable space in many fields. It used “…orthogonal transformation to convert a set of observations of possibly correlated variables into a set of values of linearly uncorrelated variables called principal components” [9].
We empirically compared the efficiency scores and rankings of the Chilean PHCs, which were estimated using DEA and SFA approaches for 259 rural and urban municipalities. All of the research data came from public information data sets and the sanitary authority. This paper is organized as follows. Firstly, we examine the use of DEAs and SFAs in primary healthcare. Secondly, we briefly describe the methods that were used in this study. Next, we present the efficiency scores and rankings that were estimated with both of the methodologies and compare their results. Finally, we discuss the general findings on the robustness, validity and consistencies of the results that were obtained and state the practical implications of this study.
2. Conceptual Framework
Worldwide, the healthcare industry is encountering new challenges. Thus, managers need to quickly respond with thorough performance evaluations and decision-making. “Health spending in Chile has grown much more rapidly than the average across OECD countries over the past 10 years. Since 2010, health spending has increased at a rate of around 6% per year in real terms, although preliminary estimates suggest a slight slowdown in 2013” [3]. There is an increased need to improve the performance of healthcare expenditure. Performance evaluation that is based on optimization techniques and their normative structure creates benchmarks, detects changes from one period to another, provides information on how organizations are functioning relative to others and illustrates how to improve performance [10]. Models for assessing healthcare efficiency usually involve multiple inputs that are converted into multiple outputs by a decision-making unit, which is better known as a DMU. Two main approaches that are widely used to evaluate efficiency scores are a DEA and SFA. Both of the methodologies share several features. They appraise the relative efficiency scores on scales of zero to worst and one to best. These scores are based on a comparison of the observed performance of the DMUs and the best practice frontier. When selecting the conditions that describe the model, a SFA is less flexible than a DEA. It establishes a priori its functional form and justifies the probability distribution for inefficiency and noise terms. On the other hand, a DEA constructs its frontier with the empirical units that achieve the highest output/input rate. This forms a series of linear segments that connect the best practices, thus approximating a true frontier and leaving inefficient units outside of it. Some researchers have criticized the use of SFAs for evaluating the efficiency of healthcare systems. This is mainly because DMUs are heterogeneous, which means that they make mistakes when adding outputs or making assumptions that are related to the probability distribution of the inefficiency factor. A DEA seems to hold on to its leadership as an evaluation method. The last appraisal of Emrouznejad, A., Parker, B., and Tavares, G. (2008) publishes a summary of DEA applications of over 4,000 published research articles and book chapters. Regarding primary healthcare, a small number of publications have been identified by [5] and [12].
2.1 Data Envelopment Analysis
Efficiency in a DEA is estimated as the ratio of the weighted sum of outputs to its weighted sum of inputs. A linear programming problem is solved for each DMU in order to find the optimal mixtures of inputs and outputs, which are based on the actual performance of similar units. The methodology does not need the assumption of a functional form of the production frontier. Its main purpose is relative efficiency. This deterministic method strongly relies on the data. Thus, its results are highly sensitive to extreme values and not sensitive to statistical noise. Furthermore, the measurement of efficiency is based on the hypothesis that efficient organizations are effectively efficient. Some studies use an input-oriented approach [13, 14], while others use output orientation [15–22]. Sherman, H.D. and Zhu, J. (2006) suggest an input-oriented model when the resources can be controlled but the level of service or demand cannot. Meanwhile, [24] proposes this approach when managers decide the outputs as goals. When budget is a constraint, decisions regarding how to best use the inputs are noteworthy. In our case, the health authority defines the financial resources, thus the municipalities have no influence on the budget. Even though it is not possible to control the demand for PHC services, it can be estimated. This is because each centre has a registered number of patients and their services are limited to this number. Each municipality runs a different number of PHCs, depending on the size of its population. Moreover, each centre has a limited capacity — daily working hours, fixed medical personnel and fixed number of boxes. Thus, it is possible to estimate the daily demand for the services, except for sanitary emergency periods. This allows us to somewhat control the volume of services that are being offered. In this context, this paper uses an output-oriented model to address the question: by how much can I proportionally increase the outputs without modifying the inputs? We based our decision on the following facts. Firstly, municipalities are responsible for managing and providing primary healthcare through centres under their supervision. However, they have limited control over the inputs, especially since the budget is fixed externally and varies according to the goals that are set up by the health authority. Secondly, the decisions that are related to the main source of income are taken by higher authorities, which include minimal medical staff, salaries and infrastructure investments, among others. Thirdly, some municipalities can generate income for financing additional staff but most of them cannot, especially the poorer ones. Lastly, the medical staff has to encourage the demand for preventive healthcare in order to comply with the last healthcare reform.
2.2 Stochastic Frontier Analysis
A SFA is an econometric approach that is used to measure the relative efficiency in productive models. It assumes that all of the units are not efficient and accounts for random noise. This is evident from the formula. Additionally, a SFA differentiates between random noise and inefficiency under the assumption of its two distributions – one that is symmetric and another that is asymmetric. This a priori assumption is also its main disadvantage. The production function that is most widely used in healthcare research is Cobb-Douglas [6]. This takes the form
3. Methods
3.1 The Sample and Data Collection
The data that were used in this study came from public information. Such information is available on Chilean web pages (National System for Municipal Information –SINIM-, National Statistics Institute –INE, Health Statistics and Information Department –DEIS) and the sanitary authority. The data, which are for 2006, were retrieved between July and October 2008. The population under study corresponded to 345 municipalities nationwide. We excluded the municipalities with a fixed budget —52— and those with missing or incomplete data for the variables under study —34. This reduced our population to a total of 259 municipalities. For confidentiality reasons, we have not disclosed their names. Within the Chilean context, the evaluation of the technical efficiency of PHCs should provide the maximum possible output, given the available resources.
3.2 Inputs
The performance analysis of PHCs that are run by municipalities should take into account the resources that are needed to provide care, among others, staff mix, remunerations, facilities and management expenses. Municipalities run and manage PHCs by providing patient care through public health programmes and ambulatory services. Regarding resources for medical staff, in 2000, a new model for PHC, which was based on family and community care with an emphasis on preventive care, was introduced [7]. This model requires each centre to have an “ideal” medical team and a support team in charge of providing PHCs, based on the number of enrolled inhabitants per centre. The ideal team is composed of a physician, a nurse, a paramedic, a midwife and a social worker. The support team is composed of a dentist, a psychologist, a kinesiology expert and a pharmacist. In terms of ideal teams for each municipality, we assume that the structure of the medical staff is quite similar, considering their medical qualifications. We are not interested in a particular specialty, e.g., nurses, which could be the case for other studies of healthcare. Thus, for our particular case, the variable for medical staff could have been expressed in terms of “working hours” or “total expenses” per ideal medical and support team. Unfortunately, there are no aggregated data available for either team mix. This is because data are reported as annual money spent in medical and administrative staff by municipalities. With regard to infrastructure, most of the studies in literature evaluate the efficiency in healthcare and include variables such us the “number of beds” as indicators of capital. In Chile, patients requiring inpatient care in a PHC are sent to hospitals, since the centre's infrastructure does not include beds. Hence, an input variable for the infrastructure within the Chilean context could have been the “number of boxes” or cubicles in the centre for attending patients. However, such information is not available on the public data sets that were consulted. Moreover, the majority of PHCs work with similar basic equipment. Thus, they could be considered as fairly homogeneous. Hence, no variable that is related to the infrastructure was included in this analysis.
Therefore, we used the following input variables. Firstly, the annual medical staff expenses, gper, which includes the total cost that was spent during the year on all of the medical staff that work for the municipality at a PHC. This is similar to several authors [18, 19, 21, 25]. The second variable was the annual general service expenses, which includes all of the expenses that are related to the management and maintenance of all the PHCs that are run by a municipality, as used by [24]. Lastly, we used the annual drugs expense, gfarm. This was also part of the budget that was assigned to each municipality. Its expenditure is influenced by the demographic characteristics of each municipality. This variable has been used by several authors in this setting [13, 20, 22, 25, 26].
3.3 Outputs
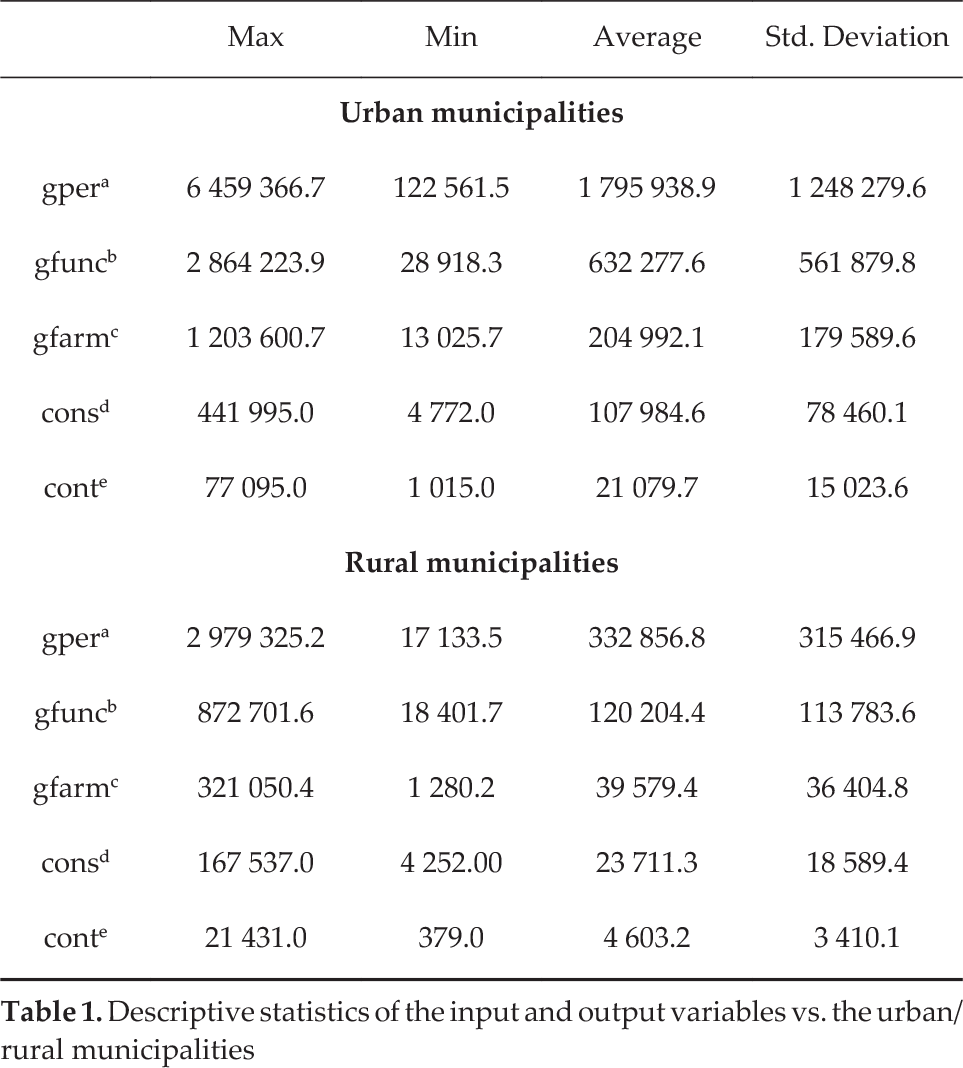
Most researchers use the annual medical visits rate as the proxy of outcomes. In some articles, it is the only “output” that is included in the DEA [13, 26–28]. As outputs, we used: (i) the annual number of medical visits – cons – and (ii) the annual number of medical check-up visits – cont. The difference between them is the type of care that is needed. Medical visits are related to illnesses and check-up visits are associated with preventive care – a must within the latest Chilean healthcare reforms. The descriptive statistics for the rural and urban groups are summarized in Table One.
Descriptive statistics of the input and output variables vs. the urban/rural municipalitise
4. Results and Discussion
4.1 DEA Model Specification and Results
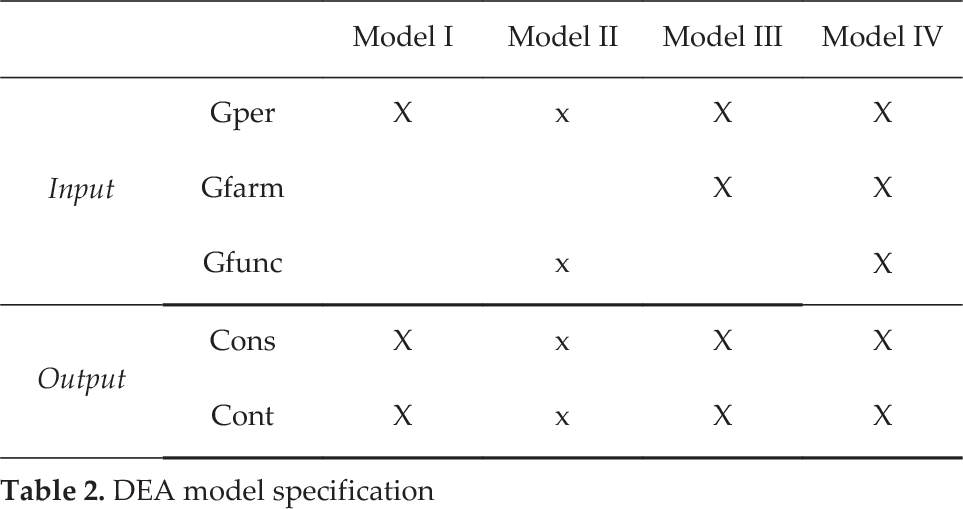
A DMU is fully efficient if the performance score is equal to 1.0 and all of the slacks are equal to zero. This means that a DMU is located in the frontier. Four model specifications were developed for three inputs and two outputs in order to produce efficiency scores that would be the most comparable. There were 177 municipalities in the rural group and 82 in the urban group. We calculated the relationship between the inputs and outputs in order to determine the efficiency scores for each DMU that was under study. Four specifications of the output-oriented models for each group —urban and rural—were defined: model I included the input variable, gper; model II used gper and gfunc; model III used the variables, gper and gfarm; and model IV used gper, gfunc and gfarm as input variables. Both of the cons and cont of the output variables were used in the four models. The different specifications were used as a sensitivity analysis to observe the raking of the DMUs and the stability of the individual scores when the input variables were added or removed.
For the rural municipalities, the percentage of efficient DMUs varied from 8.54% to 18.29% and the average scores varied from 0.6109 to 0.7078. Similarly, the urban municipalities had a range of 6.21% to 15.25% efficient DMUs and an average efficiency score that ranged from 0.5117 to 0.5615, as shown in Table Two. The correlation analysis for the efficiency scores and the ranking estimates coefficients were higher than 0.93, positive and significant to 0.01 for all scenarios. This suggests a high convergence between the efficiency scores that were estimated for all of the models. These were higher for models III and IV in both groups, with a correlation among the efficiency scores of 0.9790 and 0.9834 for the rural and urban municipalities, respectively. There was also correlation among the ranking of municipalities, which were 0.9808 and 0.9828 for the rural and urban municipalities, respectively. Therefore, we infer that including additional input variables —gfarm or gfunc—does have some effect on the efficiency results for the DMUs. Thus, adding variables to model I —one input, two outputs— decreases the correlation with the other models. However, we consider it necessary to include at least one more input variable, either gfunc or gfarm. We closer observed the results between models III and IV for the urban municipalities and between models II and III for the rural municipalities. In this context, from a statistical point of view, as well as from a technical perspective, we would like to have a parsimonious model. Thus, as comparison models with the SFA, we chose model II for the rural municipalities and model III for the urban ones.
DEA model specification
efficiency scores, variable return to scale–VRS-output-oriented

4.2 SFA Model Specification and Results
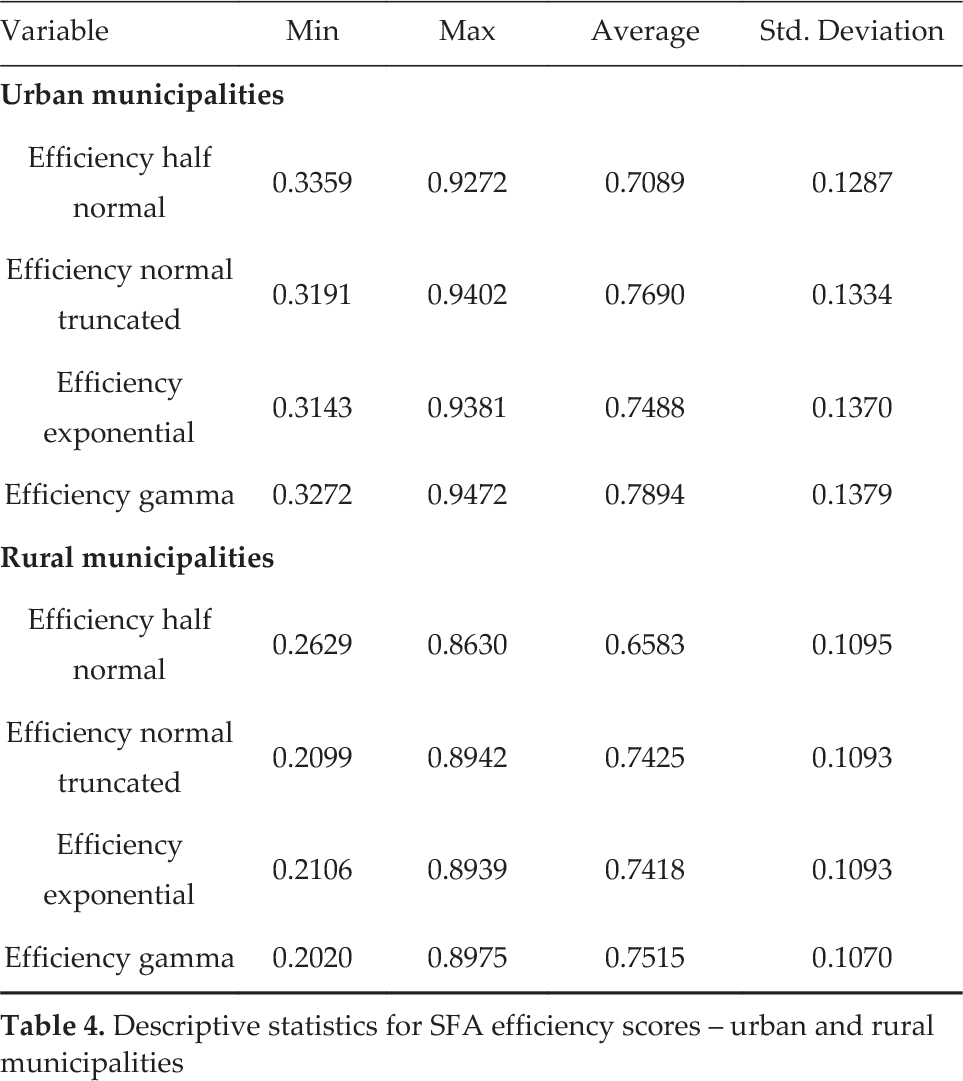
A SFA has the restriction of only using one dependent variable. Thus, in this study, the model was operationalized to ensure compatibility with the DEA version that is outlined above, whilst also providing a proper characterization of the system. Since the DEA model uses two outputs, we combined them into one output, using a principal component analysis. This approach has not been used before. The first component had the most variance and the second one had the least. To avoid having scale problems, we first typified the variables. For both groups, urban and rural, the Barlett test of sphericity verified the correlation between the variables (p ≪ 0.01). One component explained 92.18% of the total variance for the urban municipalities and one component explained 95.1 % for the rural municipalities. For the independent variables, gper, gfunc and gfarm, we used the natural logarithms of each one. Thus, we assumed that they did not have a lineal relationship with the dependent variable. This allowed us to make the variables unsusceptible to heteroscedasticity. We used four scenarios in order to include all of the suggested forms of distributions for the term uj: semi normal, truncated normal and exponential. The results for the rural municipalities showed that the constant term and the variables, gper and gfunc, were statistically significant in all four of the distributions (p value < 0.05). The semi normal was an exception, where the coefficient for gfunc was not statistically significant. These results are consistent with the selected rural DEA model II, which includes gper and gfunc. The positive coefficients imply an increment in the dependent variable —output— and a reduction in the negative ones. As expected, the coefficients for gper and gfunc were positive in the four distributions. The coefficient for gfarm was negative for the truncated normal, exponential and gamma distributions, and positive for the semi normal. For the composed error, the values of the truncated distribution were not significant, except for one case. Regarding the urban municipalities, the results show that both the gper and gfarm were significant for all of the distributions. These results are consistent with the selected urban DEA model III. The coefficients, gper and gfunc, were positive for all four distributions. Unlike the rural municipalities, the coefficient for gfarm was positive. For the composed error, the values of the truncated distribution were not significant, except for one case. As shown in Table Four, for the rural DMUs, the average efficiency score ranged from 0.6583 and 0.7515, with minimum values between 0.2099 and 0.2629 and maximum values between 0.8630 and 0.8975. For the urban DMUs, there were higher efficiency scores than for the rural case, as was expected. Thus, the efficiency scores ranged between 0.7089 and 0.7894, with minimum values between 0.3143 and 0.3359 and maximum values between 0.9272 and 0.9472. When using different distributions, the correlation between the efficiency and ranking scores for uj varied from 0.9583 o 0.9999 for the rural municipalities and from 0.9775 to 0.9984 for the urban municipalities. They were all significant with a p-value < 0.01. Thus, selecting any form of distribution does not seem to affect the efficiency score. Even though the average efficiency score was consistent, the ranking was affected by the type of distribution that was used. This varied from 0.2025 to 0.9939 for the rural municipalities and from 0.1194 to 0.8755 for the urban municipalities, all with a p-value < 0.01. The results for the composed error using a normal truncate were not statistically significant. Thus, we also ruled this one out. Finally, given the high correlation between the semi normal and the exponential, 0.9776 for the rural and 0.9940 for the urban municipalities, we chose to use the semi normal.
Descriptive statistics for SFA efficiency scores – urban and rural municipalities
4.3 Comparison of Results
Table Five shows the results of the average efficiency scores for both groups, using the selected DEA and SFA models.
Descriptive statistics of efficiency scores DEA vs. SFA

To a vast extent, the identification of efficient or inefficient DMUs is congruent with the variables that were used in both approaches. The estimated average efficiency scores were close enough for the urban and rural municipalities using either a DEA or SFA. There was a higher gap for the rural municipalities. The similarity of the results is strengthened by the rank-order and rank-efficiency correlation for both the rural and urban municipalities. As shown in Figure One and Figure Two, respectively, these were positive and high. This result is confirmed by the high correlation of rankings and scores in the highest and lowest efficiency quantile across the methods, respectively. Consequently, only a small number of DMUs seem to have changed their position, relative to the majority of competitors. The efficiency rankings were more stable when measuring the efficiency for the urban municipalities, especially for the parametric methods. This was expected, given the fact that urban DMUs are more homogeneous than rural ones. This indicates consistency in the results. However, the minimum and maximum values were higher for the SFA than for the DEA, as expected. This is because the error term was split in inefficiency and noise for the SFA, and the DEA assumed that the deviation from the frontier was exclusively due to inefficiency. As anticipated, the variance of the SFA was also lower than the DEA's variance. Consequently, this reflected the error normalization of the logarithmic transformation. As stated, the results provide evidence that the efficiency measures were highly correlated between both of the methods. For both of the groups, rural and urban, the values were highly correlated for the scores and ranking, especially for the urban municipalities — 0.7934 and 0.8207, respectively. This is due to the higher homogeneous among the municipalities within the group than for the rural one —0.7319 and 0.7788, respectively.
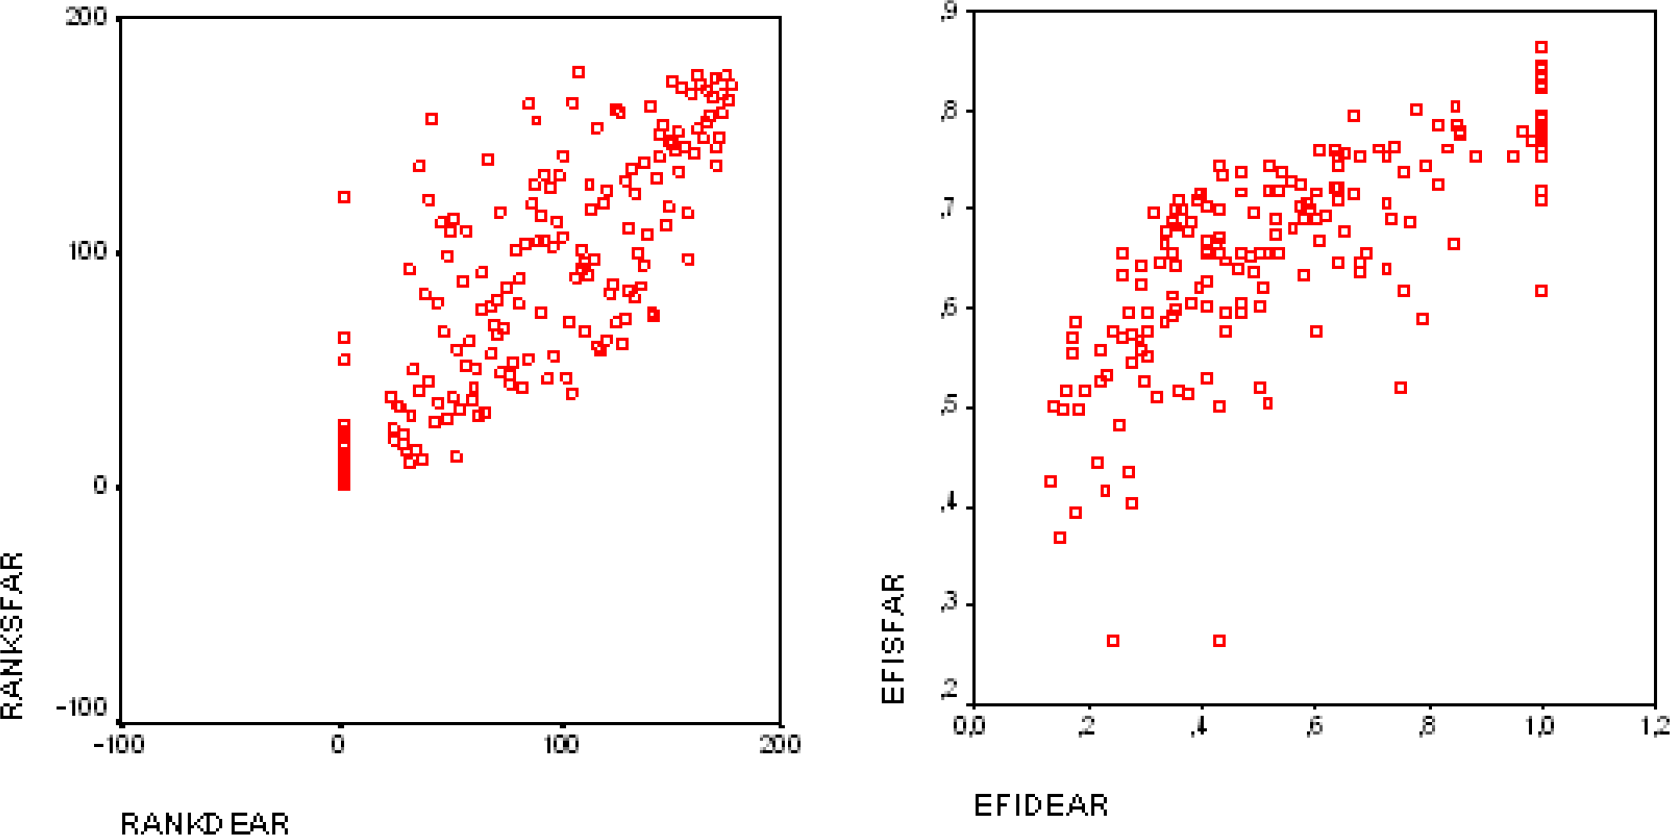
Ranking and efficiency scores: DEA vs. SFA, rural municipalities
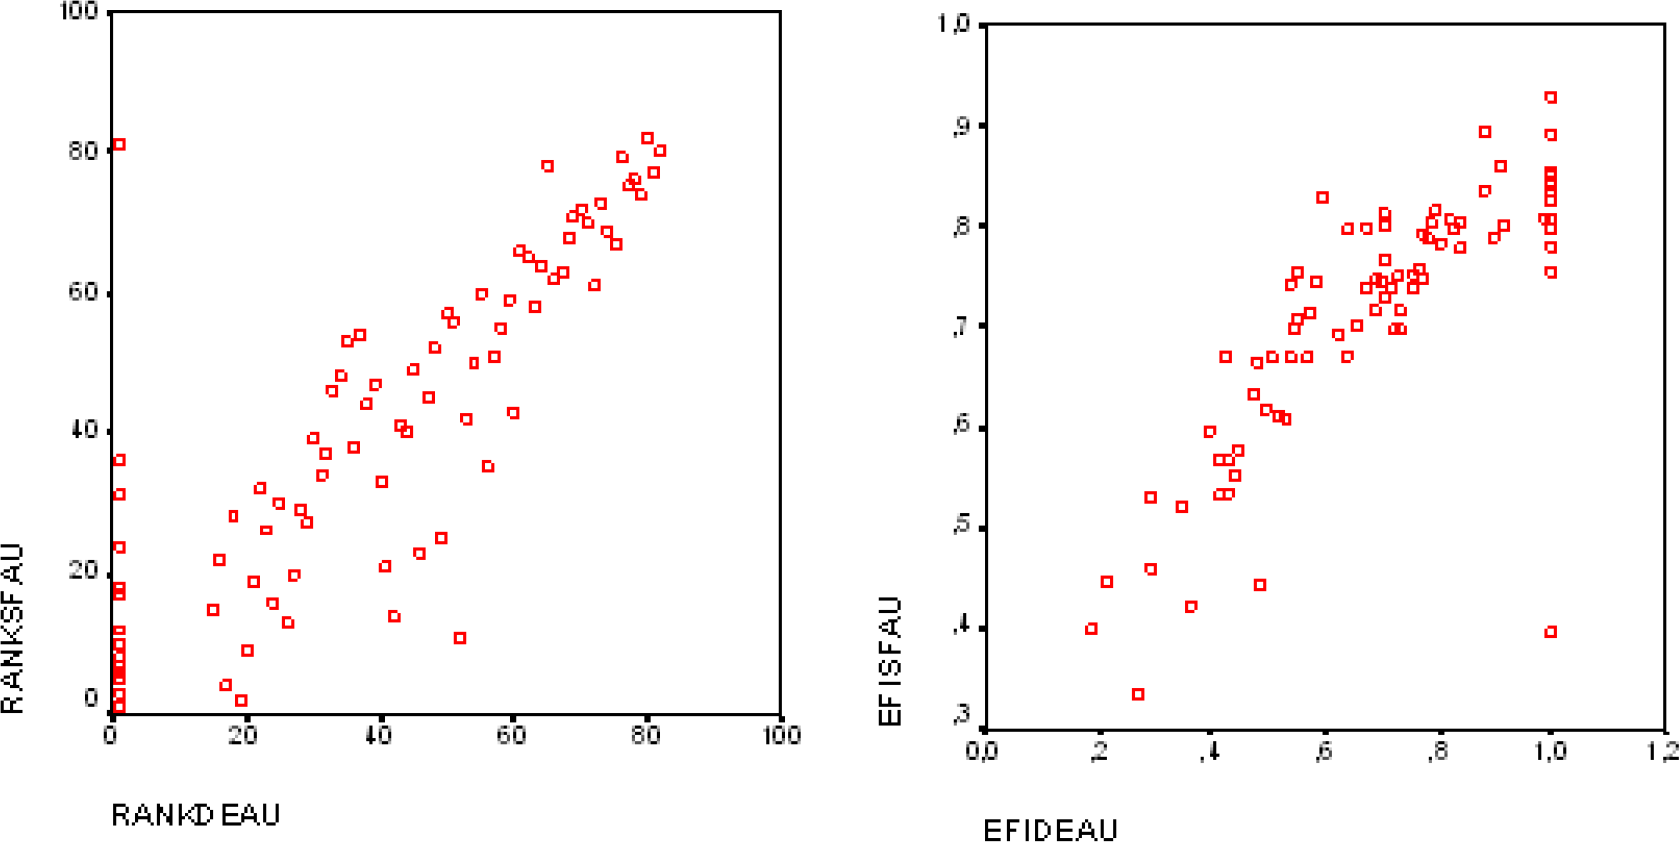
Ranking and efficiency scores: DEA vs. SFA, urban municipalities
The high correlation index suggests a certain level of convergence between both of the techniques. [29] states that correlations are not necessarily the best way to examine the relation between data sets. Thus, an additional analysis is necessary to determine whether both of the approaches are similar for the “best” and “worst” DMUs. We ranked the DEA and SFA scores in descending order. Then, we compared the top 30% and the bottom 15% of the DMUs in the list of rural and urban municipalities, both for efficiency scores and ranking. For the rural municipalities, we compared 34 municipalities – the best and worst 17 -according to their efficiency scores. From those, 71% of the DMUs were identified as “best” by the DEA, e.g., the efficiency score was one. These also had the highest scores for the SFA. For the “worst” DMUs, 53% of the municipalities scored low with the DEA and SFA. Regarding the urban municipalities, 25 of the DMUs – the top 12 and bottom 12 – were compared. Out of those, 67% of the DMUs that were classified as “best” by the DEA were also scored highly by the SFA. For the low scores, 62% of the DMUs had similar results with both of the techniques.
5. Conclusions
The utilization of two of the methodologies for measuring the technical efficiency for 259 municipalities —71% of the country's total— adds robustness to this study. The variables that were identified as inputs and outputs were selected, based on literature and by reaching a consensus with the authorities from the Health Primary Care Department. The sample that was used on each group – for the rural and urban municipalities – does comply with the suggestion that was given by [30], who advised the inclusion of at least 3(m+s) DMUs, where m+s represents the addition of inputs and outputs. Furthermore, for our case, it adds to a minimum of 15 municipalities. We had 82 in the urban group and 177 in the rural group. Not including the input variables, such as the personnel mix, estimating the DEA efficiency scores could prevent us from drawing some meaningful conclusions on which specific staff “team” may require remedial actions. In our particular context, these data are not available. Thus, the study was based on the assumption that staff teams are similar across the units. However, future efforts should be made to disaggregate the input variable of annual medical expenses. Since policy orientation suggests having an “ideal” and “support” medical number of teams, we propose that each municipality collects information regarding the annual medical expenses per number of ideal teams, as well as per number of support teams. The overall efficiency score reflects how operationally efficient a municipality is. The results that were obtained from this study could be the first step in comparing the overall relative performance among units, since we are defining a frontier of “best practice” municipalities that could assist policymakers in making decisions. Several aspects have to be considered when assigning resources and measuring performance. For instance, local governments do not have a constant source of income. This is because the amount that is collected through local taxes varies every year. Additionally, rural municipalities are worse off, since they tend to have a lower income from local taxes than urban ones [31]. Corporations are supposed to be more flexible than municipal offices, in terms of the uses they give to financial resources. We suspect that these and other factors could limit the ability of municipalities to make decisions, thus reducing their opportunities for performance improvement. When using DEA models, the assumption of CRS is appropriate if the performance of the units does not depend on the scale being more adequate to use a VRS orientation. This is not the case for this study. In order to test the sensitivity of the VRS-DEA model, we used four different scenarios by varying the inputs, while keeping the outputs fixed. This resulted in high correlations between the efficiency scores and ranking of the DMUs. The input variable, gper, seems to be the one that influences the efficiency level the most, since, for model I, this is the only input that is included in the analysis. From the four DEA-VRS specifications, we had to select one to compare with the SFA. For the urban municipalities, model III — two inputs/two outputs — and model IV — three inputs/two outputs — had the highest correlation values, 0.98 for scores and ranking. Furthermore, both were very similar regarding the average efficiency scores, the standard deviation and the number of efficient DMUs. In other words, adding a third input variable to the model did not significantly affect the results. Hence, we chose to use the efficiency score and rankings from model III for the urban municipalities. Regarding the rural municipalities, model III and model IV had the highest correlation values – 0.97 and 0.98 for scores and ranking, respectively. However, model II and model III are more similar in terms of the average efficiency scores, the standard deviation and the number of efficient DMUs, despite having a slightly lower correlation. Therefore, we chose model II for the rural municipalities. We cannot draw conclusions regarding the personnel mix because we are not able to disaggregate the input variable annual medical costs or gper. Since these data are not available, efforts should be made by the health authorities to report them. In order to provide stability within and correspondence between the two approaches, we performed a principal component analysis and ran four different scenarios for the SFA, one for each of the possible distributions of the term uj. This approach has not been used before. Similar results within the scenarios made us chose the scores from the semi normal distribution for the term, uj. Therefore, when comparing the SFA and DEA scores and rankings for the rural and urban municipalities, we used one scenario for each approach. For the urban municipalities, the SFA efficiency value reached an average of 70.89%, whilst the DEA value equalled 68.37%. Regarding the rural municipalities, the SFA value averaged 65.83% and the DEA value reached 54.46%. The ranking that was obtained for the municipalities allows us to identify those that can be used as benchmarks for decision-making units with lower efficiency levels. We calculated high correlation scores between the SFA and DEA efficiency values of 0.79 for the urban municipalities and 0.73 for the rural ones. For the rankings, we estimated a correlation value of 0.82 for the urban municipalities and 0.78 for the rural municipalities. We also identified 71% of the DMUs that were classified as efficient by both methods. In order to establish an informed decision-making for PHCs, with regard to which approach should be used to estimate technical efficiency, given the strengths and weaknesses of each method, it would be more appropriate to decide which one to use based upon the objective of the study and the available data, in particular the number of output variables. While attempting to explain the technical efficiency scores discrepancies between both of the methods, the evidence from this study suggests that it is possible to combine two outputs into one by using a principal component analysis before applying a SFA and still obtain results that are similar to DEA. However, a further analysis should be made to combine more than two outputs.
Footnotes
Acknowledgements
The authors wish to express their gratitude to the Department of Primary Care at the Ministry of Health for its valuable aid and to CONICYT for its support through a Doctoral Student Scholarship grant #AT-24020059. The authors also express their gratitude to the Direction of Research of Universidad de La Frontera for their support through the DIUFRO DI10–0027.