
Abstract
This paper aims to describe and analyse possible impacts on selling online by enterprises as the main variable under consideration in the study, in selected European countries using five selected independent variables that represent the information and communication technology (ICT) and the economic development level. Data for 31 European countries were analysed. The paper presents recent trends in European enterprises in using online selling as one of many Internet services. Three groups of countries according to the share of enterprises selling online were recognized. The complete picture about the achieved economic and ICT development level in the countries was obtained by conducted clustering where all six variables were included in the analysis. The main research hypothesis was that economic and ICT developments have a significant impact on the share of enterprises that sell online. The conducted factor analysis sorted five observed independent variables into two groups. The multiple linear regression analysis based on the factors showed that both groups have a statistically significant impact on the share of enterprises that sell online. This means that these two factors together have a crucial role in determining the ICT development level in European enterprises.
Keywords
1. Introduction
Despite the fact that the Internet was introduced in the early 1960s [1], its wide and intensive use began in the 1990s [2]. The percentage of individuals who have used a computer at least once in their lifetimes is greater than 50% in all European countries, whereas the European Union (EU-28) average in 2013 was 81% [3]. At the same time, the share of individuals who used the Internet is only a few percentage points below the share of individuals who used a computer. Therefore, the EU-28 average share of individuals who have ever used the Internet at least once in their lifetimes in 2013 was 77% [4]. The highest Internet penetration rates are among Scandinavian countries. In Iceland and Norway, 97% of individuals used the Internet in the period of the last three months in 2013 [4]. The high rate of the Internet penetration is also caused by its widespread availability. According to [5] nearly all households in the EU-27 could use a high-speed or a broadband connection to the Internet in 2012. However, there are still many opportunities for improvements. Therefore, the EU should reduce regulation of broadband providers and remove other barriers [6]. As far as the EU-28 enterprises are concerned, on average 54% of employees used a computer in 2013 [7]. In Lithuania, the Netherlands, and Finland all enterprises, excluding the financial sector, with 10 or more employees had Internet access in 2013 [8]. In the EU-28, 96% of all enterprises, excluding the financial sector, with 10 or more employed persons had access to the Internet in 2013 [8]. In Finland all enterprises, excluding the financial sector, with 10 or more employed persons had a broadband access to the Internet in 2013 [9]. At the EU-28 countries level, overall 90% of all enterprises, excluding the financial sector, with 10 or more employed persons had a broadband access to the Internet in 2013 [9].
The rising role of the Internet in individuals' and enterprises' everyday life led to the development of many different Internet tools and services for business purposes [10–13]. One such service which has developed as a result of the market's demand was electronic commerce. Electronic commerce, or e-commerce, includes some or all of the following practices: it provides a virtual storefront on websites with online catalogues; it enables buying or selling on websites or online marketplaces; it gathers and uses demographic data which are collected through web contacts and social media; it uses electronic data interchange between enterprises and with customers; and it provides secure business transactions [14, 15]. In this paper, only sale by enterprises via the Internet and/or networks other than Internet/online will be examined.
In the field of e-commerce, there are three basic transaction possibilities: between businesses (business-to-business), between businesses and their customers (business-to-customers), and between customers (customer-to-customer) [16, 17]. In the paper, only situations where businesses or enterprises are included are observed. Thereby no distinction will be made between enterprises' transactions with other enterprises and those with customers. The effect of e-commerce with businesses and customers will be observed together via the main research variable: ‘Percentage of enterprises selling online’ (YSellOn) [18].
There has been research examining the effects of selling online on enterprises. Some research results have shown its negative effect on labour productivity [19, 20]. Notwithstanding, there are many other positive effects of selling online: for example, where selling online resulted in a higher gross value of output [21]. Other benefits of selling online can be found in [22]. Because of significant positive impacts of selling online on modern enterprises, the detailed examination of this topic is justified.
The research question concerns which variables have a significant impact on an enterprise's decision to sell its products and services online and use online sales as an additional selling channel. Previous research included variables such as enterprises' access to the Internet [23], ICT skills of employees and online purchasing by individuals [24], security concerns of individuals [25], and speed of the Internet [26] in observation of their importance in changing the share of enterprises that sell online. However, there has been no research examining whether economic and ICT developments together have a significant impact on the share of enterprises that sell online. Consequently, this paper includes five different and carefully chosen variables representing the economic or the ICT development level in a country.
The main research hypothesis is that economic and ICT developments have a significant impact on the share of enterprises that sell online. The hypothesis will be examined through different statistical methods. Consequently, the descriptive and the outlier analysis, the hierarchical and the non-hierarchical cluster analysis, the factor analysis, and the multiple linear regression analysis based on the factors as independent variables are used in this paper.
The paper is organized as follows: after the introduction, the second part addresses the observed variables, introduces data sources, and conducts the basic explorative variable analysis and outlier analysis. In the third part, the cluster analysis methods are used to group countries according to the observed variables. In the fourth part, the multivariate factor analysis is conducted. After obtaining factors, they are entered as independent variables in the multiple linear regression model where the variable YSellOn was introduced as the dependent variable. In the fifth and final part of the paper, conclusions are made and recommendations for further research are given.
2. Explorative data analysis and research methods
2.1 Research variables
The main variable under the study is the ‘Percentage of enterprises selling online’ (YSellOn). Eurostat is used as the data source [18]. Data taken into account refer to enterprises with 10 or more employees. Furthermore, enterprises from the financial sector were not observed in the analysis. In Table 1, 31 European countries are grouped into three groups according to the values of the variable YSellOn in 2013.
European countries according to the variable ‘Percentage of enterprises selling online value’, n=31 countries, 2013
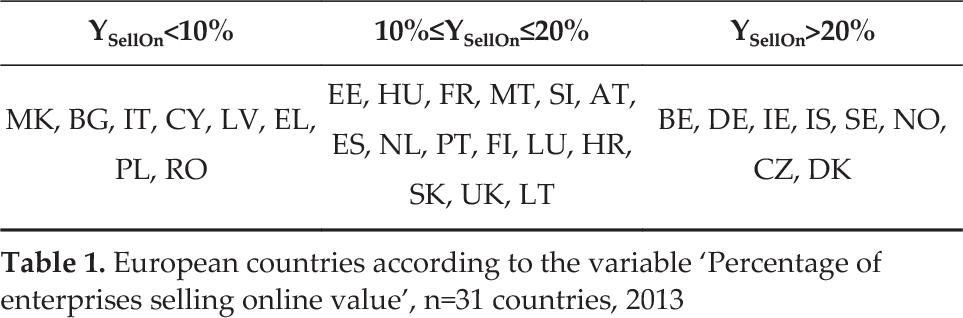
The former Yugoslav Republic of Macedonia (FYROM) had the lowest research value in 2013: in FYROM only 4% of all enterprises with more than 10 employees, excluding financial institutions, sold their products and/or services online in 2013. In addition to FYROM, the group with countries where the YSellOn was lower than 10% in 2013 included: Bulgaria (5%), Italy (5%), Cyprus (7%), Latvia (7%), Greece (8%), Poland (9%), and Romania (9%). On the other hand, the group of countries with the YSellOn value greater than 20% in 2013 consisted of the following countries: Belgium (21%), Germany (22%), Ireland (23%), Iceland (24%), Sweden (24%), Norway (25%), the Czech Republic (26%), and Denmark (27%). The differences between the first group of countries with the lowest YSellOn variable values and the group of countries with the highest YSellOn variable values are quite remarkable. For example, the YSellOn variable value in Denmark is almost seven times greater than in FYROM in 2013. Between those two groups of countries, the group with the YSellOn variable value in the range from 10% to 20% in 2013 is placed. This group consists of almost half of the observed European countries and includes the following fifteen countries: Estonia (10%), Hungary (10%), France (11%), Malta (11%), Slovenia (11%), Austria (13%), Spain (13%), the Netherlands (13%), Portugal (14%), Finland (16%), Luxembourg (16%), Croatia (18%), Slovakia (18%), the United Kingdom (19%), and Lithuania (20%).
2.2 Explanatory variables
It was determined that the main research variable would be explored using five independent variables. These variables have been selected according to the previous research and the conducted literature review. The variable ‘Gross Domestic Product per capita in Purchasing Power Standards' (XGDPpc) represents the economic development level of countries. The values of this variable are given as indices where EU-28=100 [27]. The development level of the Internet use in a country is observed through broadband penetration and so the variable ‘Fixed broadband Internet subscribers per 100 people’ is used (XBbPen) [28]. The society's acceptance of selling online is observed via the variable ‘Last online purchase in the previous 12 months by individuals' as the percentage of all individuals (XOnPurch) [29].
Whereas the previous three variables can be observed as measures of the economic development and the development of the society in a country, the following two variables describes the level of ICT development in enterprises: the percentage of all enterprises with 10 or more employees, excluding the financial sector, that employed ICT/IT specialists (XICTSpec) [30], and the percentage of all enterprises with 10 or more employees, excluding the financial sector, that provided training to their personnel to develop/upgrade their ICT skills (XICTTrain) [31].
2.3 Descriptive statistics
The most recent available data for all the variables were taken into account. For variables YSellOn, XGDPpc, XBbPen, and XOnPurch, data from 2013 have been used. It must be emphasized that the XOnPurch variable value was not available for FYROM in 2013. Because of that, instead of the value from 2013, the value from 2012 has been used for that country. The same approximation has been done for variables XICTSpec and XICTTrain. Namely, for these variables the most recent available data for all countries are from 2012. It is assumed that there were no significant changes in these variables values in the period from 2012 to 2013. Consequently, the data for the variables XICTSpec and XICTTrain from 2012 are taken as good approximations for 2013.
Table 2 shows basic exploratory indicators for the observed variables. Across 31 observed European countries, on average 14.81% enterprises were selling online in 2013. The results showed that, if means are compared, roughly 2.5% more enterprises employ ICT/IT specialists (mean=23.94) than provide training to their personnel to develop/upgrade their ICT skills (mean=21.48). On average, 42.48% of all individuals performed at least one online purchase in the last 12 months in the observed countries. The variable XBbPen has a considerably lower average, i.e., 27%, than the variable XOnPurch. However, the variable XBbPen deviates considerably from the average when compared to the variable XOnPurch. In addition, the variable XBbPen has the lowest coefficient of variation among all the observed variables, whereas the variable XOnPurch has the highest.
Basic descriptive statistics indicators for variables: YSellOn, XICTSpec, XICTTrain, XOnPurch, XBbPen, and XGDPpc, n=31 selected European countries, data for 2013
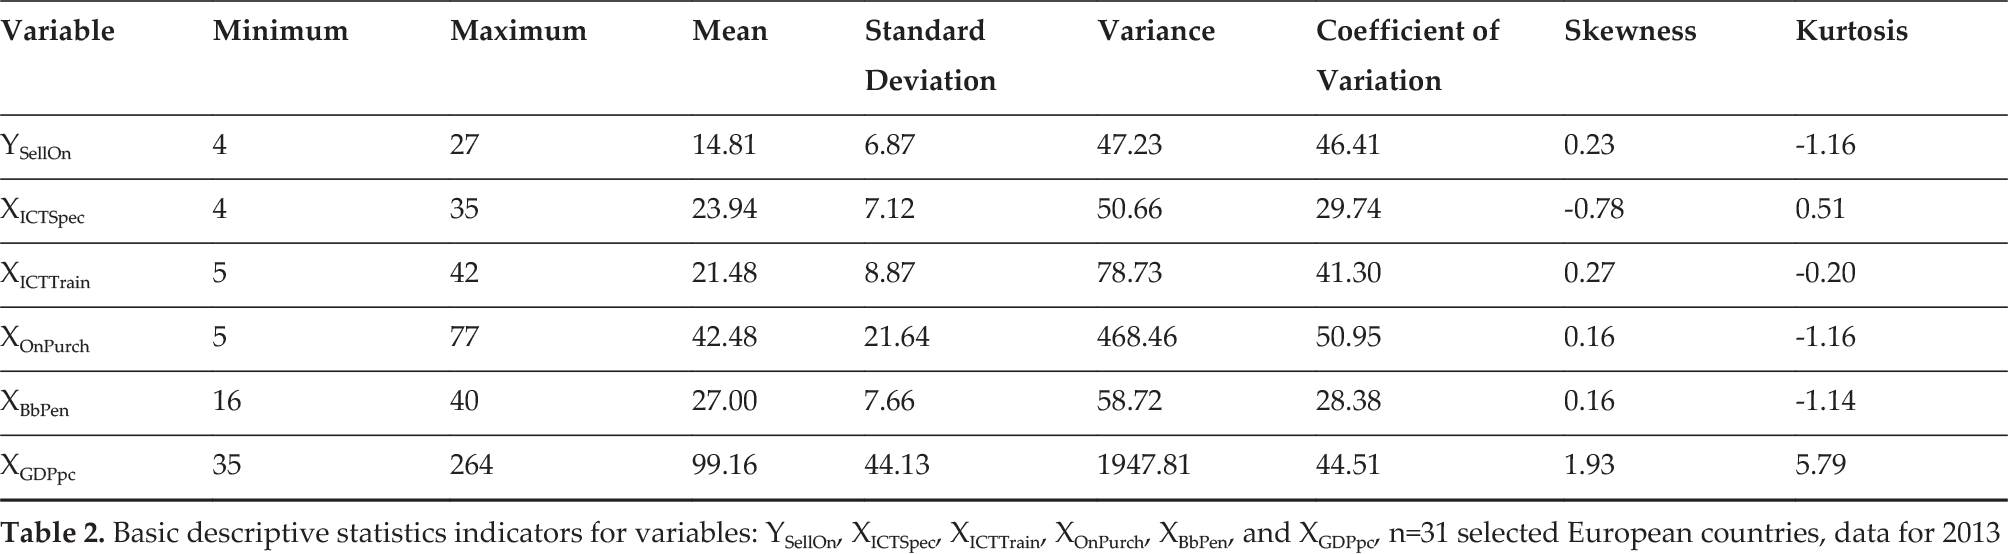
All variables, except the variable XICTSpec whose distribution is negatively skewed, have positively skewed data distribution. The variable XGDPpc has the highest skewness level. The same variable has the highest kurtosis. These results point to the possibility that outliers are present in the XGDPpc variable data.
2.4 Outlier analysis
Before any statistical analysis is conducted, researchers need to check if there are some outliers. An outlier is a data value that significantly differs from other values. The outlier presence could have a serious impact on the statistical analysis results. Within this research, an outlier is defined as the data point that deviates for more than three standard deviations from the variable mean. The standardized value of z=3.7 confirmed that Luxembourg has data with a very high extreme value for the variable XGDPpc. Accordingly, the data for Luxembourg have been omitted from further analysis. Consequently, 30 European countries are observed in further analysis.
3. Cluster analysis
3.1 Hierarchical cluster analysis
Hierarchical cluster analysis was conducted on standardized values of all six observed variables. The centroid clustering method (as an amalgamation (joining) rule) and squared Euclidean distances (as a linkage distance measure) were used in the analysis. According to “the rule of thumb”, as the number of clusters which is the most appropriate to be observed is:

where n is the sample size [32]. In the observed case, the sample size is 30 countries, which means that the number of clusters is k=3.87≈4. The dendrogram, which is shown in Figure 1, shows memberships of countries to one of the four observed clusters.

Dendrogram of standardized values of variables: YSellOn, XICTSpec, XICTTrain, XOnPurch, XBbPen, and XGDPpc, hierarchical clustering, centroid clustering method, squared Euclidean distances, n=30 selected European countries, data for 2013
There are 11 countries in the first cluster: Germany, Sweden, Belgium, Iceland, the United Kingdom, Denmark, Ireland, Austria, Finland, France, and the Netherlands. All the countries in the first cluster are old, highly developed, EU member states. These facts mean that the first cluster could be named “highly developed countries”.
There is only one country in the second cluster—Norway. The dendrogram reveals that Norway is more similar to the countries in the first cluster than to the countries in other two clusters. Therefore, it can be concluded that Norway is also a highly developed country. What makes Norway different from most of the other observed countries, however, is the fact that it has the highest GDP per capita and the highest percentage of enterprises that provided training to their personnel to develop/upgrade their ICT skills.
The third cluster contains three countries: Bulgaria, FYROM, and Romania. These countries are not very economically or technologically developed. So, this cluster could be named “under-developed countries”.
The fourth and final cluster contains one half of the observed countries. The 15 countries in the fourth cluster include: the Czech Republic, Slovakia, Estonia, Latvia, Spain, Italy, Poland, Lithuania, Greece, Hungary, Portugal, Cyprus, Slovenia, Croatia, and Malta. This cluster primarily includes medium developed countries. Consequently, the fourth cluster could be named accordingly. This cluster contains some old EU member states such as Spain, Italy, and Greece. It appears that while they might have a high economic development level, their poor technological development level means that they are not placed together with other old EU member states.
3.2 Non-hierarchical cluster analysis
The non-hierarchical cluster analysis, as was the case with the hierarchical cluster analysis, was conducted on standardized values of all the six observed variables. The k-means approach with Euclidean distances was used. In the k-means approach, the number of clusters is an input parameter. According to the “rule of thumb”, it was decided that the most appropriate number of clusters would be four.
The analysis of variance performed on each variable showed that p-values of all the six observed variables are smaller than 0.0000. This indicates that there was very good discrimination between members of clusters.
According to the conducted cluster analysis, there are seven countries in the first cluster: Bulgaria, Estonia, Italy, Latvia, Poland, Romania, and FYROM. The cluster means plot of standardized variable values, shown in Figure 2, shows that the countries in this cluster have lower average of all variables than in other clusters. This means that countries in the first cluster have lower values of observed variables and that they are not developed. Because of that, this cluster could be named “under-developed countries”.

Plot of cluster means of standardized values of variables: YSellOn, XICTSpec, XICTTrain, XOnPurch, XBbPen, and XGDPpc, non-hierarchical clustering, k-means method, Euclidean distances, n=30 selected European countries, data for 2013
The second cluster is formed from the following 10 countries: the Czech Republic, Greece, Spain, Croatia, Cyprus, Lithuania, Hungary, Portugal, Slovenia and Slovakia. According to the cluster means of variables YSellOn, XICTSpec, and XICTTrain the countries in the second cluster take the second place. The second cluster mean at the variable XICTTrain is just above the fourth cluster mean at that variable. Whereas the second cluster means were similar to the fourth cluster means at variables YSellOn, XICTSpec, and XICTTrain, the second cluster means at the other three variables are more similar to the first cluster means. In this way it can be concluded that in countries from the second cluster, the ICT investments in the enterprises are not followed by economic and technological developments at the individual level.
The third cluster, as the second one, includes 10 countries. The countries that are grouped in the third cluster are: Belgium, Denmark, Germany, Ireland, Austria, Finland, Sweden, the United Kingdom, Island, and Norway. The countries in the third cluster have the highest cluster means at all observed variables except at the variable XBbPen. Regardless this exception, it can be concluded that the countries in the third cluster are highly economically and technologically developed. Consequently, the third cluster could be named “highly developed countries”.
In comparison to the other clusters, the fourth cluster has the smallest number of countries, i.e., only these three countries are grouped in the fourth cluster: France, Malta, and the Netherlands. Considering the cluster means, the situation in the fourth cluster is opposite to the situation in the second cluster. According to the cluster means at the variables YSellOn, XICTSpec, and XICTTrain, the fourth cluster is behind the second one, but at other three variables these two clusters switch their positions. The countries in the fourth cluster even have the highest mean value at the variable XBbPen. Consequently, it can be concluded that in the countries from the fourth cluster, the economic and technological developments at the individual level are not appropriately followed by ICT investments in the enterprises.
4. Factor based multiple regression analysis
Instead of observing an individual impact of selected variables, which has been done in the previous research, in the analysis that follows the impact of economic and ICT developments together on the share of enterprises that sell online will be observed. In that sense, in the first step the number of dimensions (independent variables) is reduced by using the multivariate factor analysis, and in the second step the formed factors were used as independent variables in the multiple linear regression analysis
4.1 Multivariate exploratory factor analysis
In the multivariate exploratory factor analysis, standardized values of five independent variables (XICTSpec, XICTTrain, XOnPurch, XBbPen, and XGDPpc) were used. The principal component method as a factor extraction method was used. Because the factor scores are going to be used as inputs in the further analysis, the varimax factor rotation is implemented [33].
The correlation matrix between independent variables showed that all correlations are higher than 0.3, which indicates that the variables can be used in the factor analysis. The Kaiser-Meyer-Olkin measure of sampling adequacy (test statistic=0.801>0.60) confirmed that the variables are adequate for conducting the factor analysis. The Bartlett's test of sphericity (test statistic=95.506, p-value<0.000) confirmed that the observed data are appropriate for doing the factor analysis. The anti-image matrix showed that all correlations on the main diagonal are greater than 0.50, which additionally justified the application of the factor analysis.
The component plot of standardized observed variables values after factor rotation enabled recognizing two factors (Figure 3). Variables XOnPurch, XBbPen, and XGDPpc entered the first factor, whereas variables XICTSpec and XICTTrain entered the second factor. According to the variables it includes, the first factor could be named “economic and technological developments at the individual level”, and the second one “ICT investments in the enterprises”.
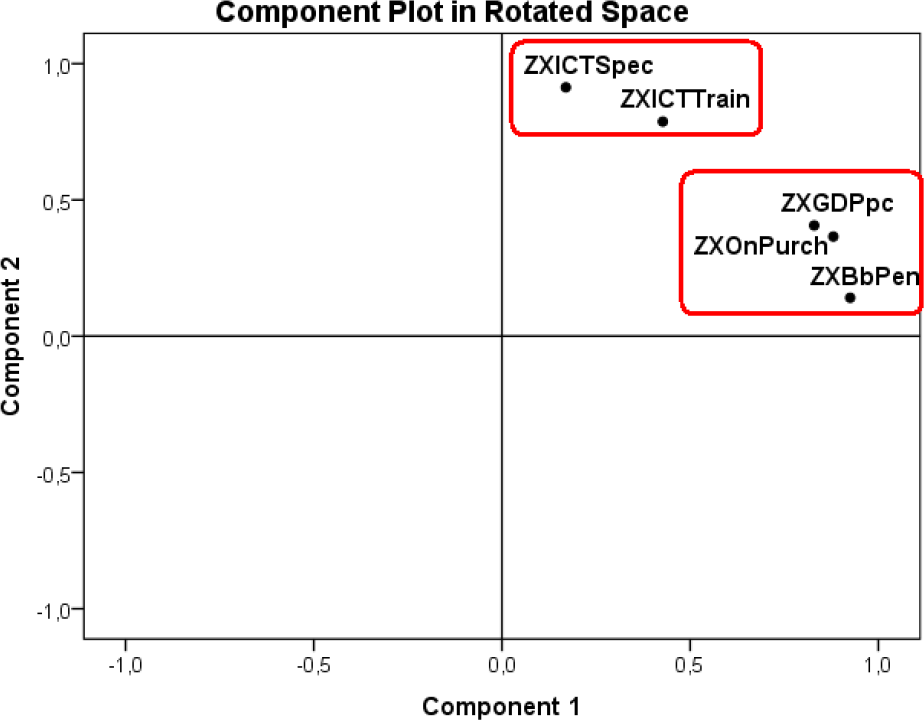
Component plot of standardized values of variables: XICTSpec, XICTTrain, XOnPurch, XBbPen, and XGDPpc, factor analysis (principal components method, varimax factor rotation), n=30 selected European countries, data for 2013
The eigenvalue value of each factor is equal to its variance, and variance of the standardized input variables is one. According to the results, the first factor interpreted 69.73% of the total variance, and the second one 16.31%. The conclusion is that both factors together explained 86.03% of the input variance, which is well above the 60% considered to be a minimum acceptable limit of variance explanation in the social sciences [34].
4.2 Multiple linear regression analysis
In the multiple linear regression model, the variable YSellOn is stated as dependent, whereas independent variables are the two factors that were obtained in the factor analysis. The general form of a multiple linear regression model with the estimated parameters is:

where y-hat is the regression value of the dependent variable, β-hats are the estimated parameters, and x represents the independent variables.
The estimated multiple linear regression model is:

where F1 is the “economic and technological developments at the individual level” factor and F2 is “ICT investments in the enterprises” factor. The model is based on data for 30 countries for 2013. Overall 46.87% of the variance in the variable YSellOn can be explained by the factors (R2=0.4687). The average deviation of the empirical values of the shares of enterprises that sell online from the regression values of the shares of enterprises that sell online is, absolutely, 5.28% (sigma-hat=5.28), or, relatively, 35.74% (V-hat=35.74%).
The conducted diagnostic tests have shown that all multiple linear regression assumptions are met. Therefore, the Durbin-Watson test (test statistic=2.113) and the Breusch-Godfrey Serial Correlation LM test (test statistic=1.183, p-value=0.5535) indicated that at any reasonable significance level there is not enough evidence to reject the null hypothesis which states that the residuals' autocorrelation problem does not exist. Similarly, the Jarque-Bera normality test (test statistic=1.894, p-value=0.3879) indicates that the null hypothesis of normal distribution of residuals cannot be rejected at any reasonable significance level. Also, the Breusch-Pagan-Godfrey test (test statistic=1.701, p-value=0.4272) and the White test (test statistic=5.790, p-value=0.3272) indicate that at any reasonable significance level, there is not enough evidence to reject the null hypothesis which states that the problem of heteroskedasticity does not exist. Because the factor scores from the factor analysis have been used, the presence of multicollinearity does not have to be tested and observed. The F test (test statistic=11.91, p-value=0.0002) pointed out that there is a significant linear regression relationship between the variable YSellOn and the factors. Both individual significance tests showed that “economic and technological developments at the individual level” factor (p-value=0.0012) and “ICT investments in the enterprises” factor (p-value=0.0029) are highly significant in the model.
If the “economic and technological developments at the individual level” factor increases by one standard deviation, but the “ICT investments in the enterprises” factor remains unchanged, the share of companies that sell online will on average increase by 3.54% (according to the standardized model) or by 0.51 standard deviations (according to a standardized model). The regression model indicates that increasing the “ICT investments in the enterprises” factor of one standard deviation, while maintaining the “economic and technological developments at the individual level” factor at the current level, will result in an average increase of the share of companies that sell online by 3.21% (according to the standardized model) or by 0.46 standard deviations (according to a standardized model).
The regression results show that the “economic and technological developments at the individual level” factor has somewhat greater absolute and relative impacts on the share of companies that sell online than the “ICT investments in the enterprises” factor. However, both factors are statistically significant in the regression model, which leads to the confirmation of the main research hypothesis that economic and ICT developments have a significant impact on the share of enterprises that sell online.
5. Conclusion
Despite high Internet penetration rates and Internet use by individuals and enterprises in the observed European countries, selling via the Internet and/or networks other than Internet/online by enterprises is not so widely spread. The previous research has observed only the impact of an individual variable on the percentage of enterprises selling online. In this paper, the joint impact of selected economic and ICT variables on the research variable (YSellOn) has been observed.
The outlier analysis showed that Luxembourg is an outlier according to the variable XGDPpc. Because of that, Luxembourg was omitted and consequently 30 European countries were observed in the further analysis. The hierarchical and non-hierarchical cluster analyses gave similar but somewhat different interesting results. The multiple linear regression analysis based on the factor scores, which were obtained by conducting the factor scores, confirmed that both economic and ICT developments have a significant impact on the share of enterprises that sell online. In that way the research hypothesis was accepted.
Further research should observe all European countries. It could also introduce countries outside Europe. The lack of data could be the biggest problem in that case.