
Abstract
Active robot learners take an active role in their own learning by making queries to their human teachers when they receive new data. However, not every received input is useful for the robot, and asking for non-informative inputs or asking too many questions might worsen the user's perception of the robot. We present a novelty detection system that enables a robot to ask labels for new stimuli only when they seem both novel and interesting. Our system separates the decision process into two steps: first, it discriminates novel from known stimuli, and second, it estimates if these stimuli are likely to happen again. Our approach uses the notion of curiosity, which controls the eagerness with which the robot asks questions to the user. We evaluate our approach in the domain of pose learning by training our robot with a set of pointing poses able to detect up to 84%, 79%, and 78% of the observed novelties in three different experiments. Our approach enables robots to keep learning continuously, even after training is finished. The introduction of the curiosity parameter allows tuning, for the conditions in which the robot should want to learn more.
1. Introduction
In active learning, the robot is an active actor in the learning process. Since the robot can understand and decide what is relevant and what is unknown, it is intrinsically motivated to explore the areas of the learning space that it does not know and ask the user about them so it can add these new data to its knowledge base. The main benefits of active learning are that active robot learners are capable of learning faster and better, and are also perceived as more intelligent by humans [1].
However, once training has finished, the robot does not receive more training unless the human teacher decides to do do. This might limit the robot's performance, since after the training is done there are many situations that the robot might face that were not predicted by the trainer. One solution is to allow a robot to actively participate in its own learning process, by, for instance, letting it ask questions to the user when it perceives any new stimuli.
Notwithstanding, every stimulus that is perceived by the robot can be either noise or be worth learning. If the robot asks the user for the label of each new stimulus, the user might end up considering the robot as being unintelligent or annoying. For this reason, it is important that the robot should ask the minimum number of questions as possible and make them as interesting as possible. In other words, the robot should ask for the most interesting novelties.
We present a system that allows a robot to detect when a stimulus is new and to decide whether it is worth learning or not by assuming that interesting novelties tend to accumulate in form of clusters. When the robot tags new data as strange and interesting, the robot can actively ask the user for a label that describes these data. The decision process is carried out in two steps. First, our system is able to detect if a new visual stimulus is different to anything seen before and, second, it is able to understand whether this stimulus is worth learning. If both conditions apply, the robot asks the user for the label of the stimulus. Otherwise, it discards it.
We validate our approach in the field of pose detection and learning, where a set of users train a robot to detect certain pointing poses. In our evaluation we train the system with a set of poses and test it by showing new poses that it has never seen before. Our system is able to detect new poses and differentiate them from noisy instances by incorporating curiosity, which modifies the behaviour of the novelty detection algorithms to make them more or less sensitive depending on the robot's needs.
The remainder of this paper is as follows: section 2 gives an overview of the concepts involved in novelty detection that are used in the rest of the paper. Section 3 summarizes, using an example, the problem we are addressing in this paper, and introduces some definitions that establish a common language used in our approach. Following this, section 3.1 presents the related work and shows why our approach is novel and different from others. After this section 5 describes our approach, which is evaluated in section 6. Finally, we conclude our paper in section 7 summarizing our contribution and giving some insights into future work.
2. Novelty Detection
Our approach uses novelty detection techniques [2, 3]. Novelty detection is defined as ‘detecting previously unobserved (emergent, novel) patterns in the data’, and incorporating these novel patterns into the normal model afterwards [2]. In essence, novelty detection is applied in classification problems where new data differ in some aspects from the data available during training [3].
Novelty detection tries to detect (or identify) abnormal data; that is, data that differ from the data in the training dataset. It has become very popular in applications with the need for identifying abnormal behaviour such as failure detection in industrial systems, or mass-like structures in mammograms [3]. All of these applications have in common their complexity, which leads to a limited understanding of a direct identification between a cause and a consequence of what is normal and abnormal.
One of the main characteristics of novelty detection is that the set of abnormal examples is under-sampled if compared with the normal set. There is also is a large number of possible abnormal and normal modes. In some of the applications there is a high cost for obtaining examples of abnormal behaviour; for example in industrial damage, to obtain a new abnormal instance. one machine has to be broken on purpose, with its associated cost. This results in typical machine learning classification methods not being suited to detecting novelties, mainly because there are not enough examples to create a normal class and an abnormal class, and because there could be multiple unidentified abnormal classes.
To deal with these issues, novelty detection techniques treat the classification problem as a one-class binary classification. That is, the knowledge base of the robot is considered as only one class: the known or normal class. All the other data that the robot observes might belong to the normal class (if it is known) or to the abnormal (unknown) class.
Therefore, the formal approach in novelty detection is to create a large one-class model of ‘normality’, formed by as many examples of normal instances as possible. The new entries are tested against this model of normality, resulting in some sort of novelty score. Anomalies present high novelty scores, while normal instances present low novelty scores. In essence, higher novelty scores indicate a more abnormal instance.
Thus, when the robot detects unknown data, it can ask the user for the label of this novel entry if it considers that these new data are worth learning. However, differentiating between noisy entries and useful data is not trivial [2].
3. Problem Definition
To give an intuition of the problem, we are going to use the example depicted in Fig.. The figure shows two clusters, N1 and N2, which are the learnt model. These clusters are instances belonging to two different classes; for instance, the user pointing to two different directions. Fig. 1a depicts the initial conditions after the model is built and with some outliers marked as o1, o2 and o3. Asking the user for the labels of each of these outliers might not make sense since they might be noise gathered by the robot's sensors or situations that occurred randomly and which are not worth learning. In Fig. 1b, the system has received more outliers, but some of them have started to form a cluster O3. This cluster might be indicating that some specific event has been repeated over time. Therefore, the robot may decide to ask the user for a label describing this event. Finally, in Fig. 1c, the robot has received a label for the new cluster, and thus has incorporated these data into the learnt model as class N3. Following, we formalize some of these terms in the following definitions: new data, strange data, and interesting data.
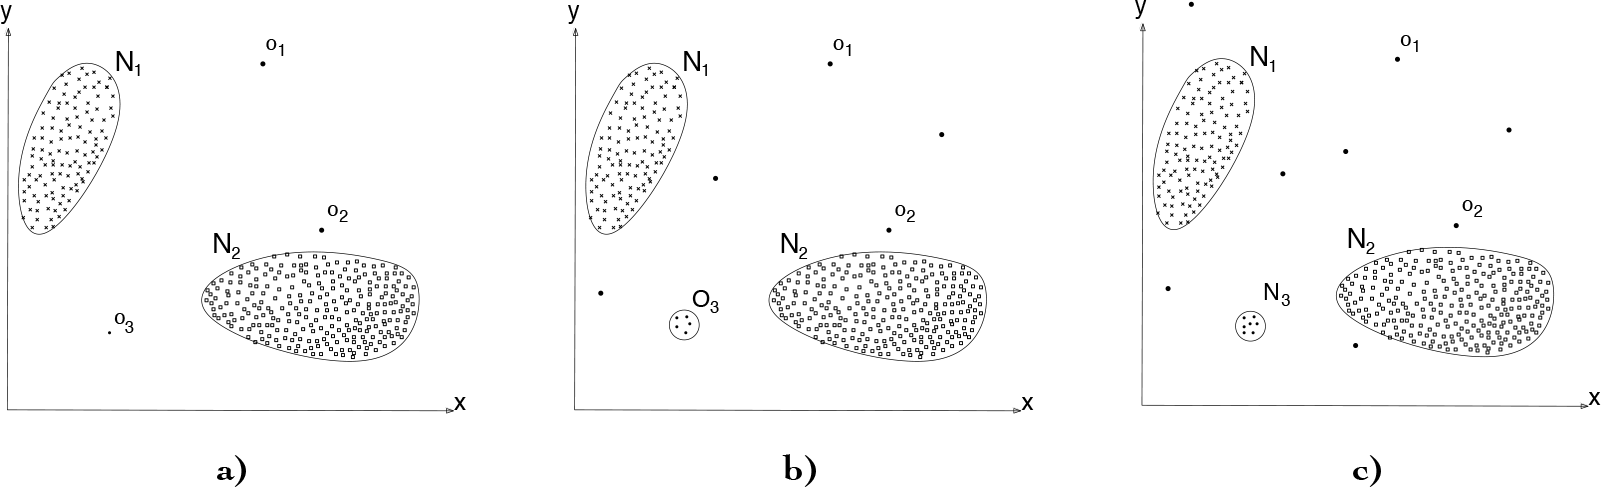
A sequence of anomalies and novelties appearing over time. We assume that noise (anomalies) are uniformly distributed (o1, o2) while interesting novelties tend to form clusters (o3 becoming into O3) that later can be incorporated into the learnt model. Modified from [2].
3.1 Definitions
We refer to
For this purpose we define the term
Since O3 is considered both strange and interesting, the robot may decide that it is worth asking the user for the label of this cluster. Therefore, after identifying a new stimulus as strange and interesting, the robot might want to incorporate this into the learnt model. This step means adding the entry to the set of data considered ‘normal’ and recalculating the model for the one-class classification, thus recalculating the threshold values for the novelty score.
This means that when a new stimulus, similar to the previous novel stimuli, is shown to the system, it will now be identified as interesting and normal; that is, as known. 3.2 Curiosity Factor of the Robot We assume that interesting stimuli tend to form clusters like O3 in Fig. 1c. We need, therefore, a parameter to define which is the minimum cluster size or density that indicates that an interesting event is occurring.
We called this parameter the curiosity factor K of the robot, since it will be key to deciding the tendency of the robot to ask questions to the user. A very curious robot would ask the user as soon as it thinks a strange and interesting cluster is being formed, while s less curious robot would need a much bigger cluster before it asks the user.
4. Related Work
The applications of novelty detection techniques vary widely in the area of application and performance. Ding et al. [4] provide a comparative evaluation of novelty detection methods for ten different experiments in different areas. The datasets in these experiments varied from breast cancer detection to phonemes analysis. The methods used were a One-Class SVM-based algorithm; a nearest neighbour-based technique; a clustering technique, such as K means; and a parametric probability density estimation, a Gaussian mixture. The results showed a better and more stable performance of the K neighbours algorithm. They also showed that the One-Class SVM algorithm was more sensitive to the size of the training data, requiring more data than the other three methods to increase its performance.
The literature presents many problems analysed with novelty detection. For instance, in fields similar to the problem addressed in this paper we can find the work by Drews et al. [5]. The article proposes a framework to detect and segment changes in robotics datasets, using 3D robotic mapping as a case study. The main applications are video surveillance or exploration of dangerous environments. In this case, noise avoidance is very important; the data are pre-processed by two consecutive methods, (i) a simplification algorithm and (ii) a sparse outliers and ground plane removal method. The novelty algorithm used is based on Gaussian Mixture Models (GMMs).
One of the studied applications more related to our work is [6]. In their article, the authors present an approach to learn the semantics of a room from the human user. For this purpose the agent must be able to identify gaps in its own knowledge. They propose a method based on a graphical model to identify novel input which does not match any of the previously learned semantic descriptions. Their method employs a novelty threshold defined in terms of conditional and unconditional probabilities. Our approach also attempts to identify novel inputs by applying novelty thresholds, and is able to make the agent identify gaps in its knowledge. However, we decided to build this novelty filter with algorithms from different fields, to be able to compare their performance, and to use pose recognition as the dataset in the experiments. They do not enter into the problem of abstraction and tolerance to noisy data, a problem that we address in this paper.
In the field of cumulative learning robots, [7] presents an article on novelty detection as an intrinsic motivation for cumulative learning robots. The article describes the theoretical basis of habituation, the task of ignoring perceptions that are similar to those seen during training but being able to highlight anything different. They explain different novelty detection methods for habituation, including “Grow-When-Required” (GWR) networks, a similar approach of expanding the base of knowledge when necessary, as the one used in this paper.
Nehmzow and colleagues conclude their work in [7] explaining that existing novelty detection approaches show a number of strengths and weaknesses, and that there is no single universal method for novelty detection, rather than a suitable choice depending on the task.
To the extent of our knowledge, there is no reference on novelty detection for pose recognition in a human-robot interactive application.
5. Description of the proposed solution
This section describes our novelty detection system and how it is applied to detect poses. Our pose-detection system is described in detail in a previous work [8]. The vision inputs come from a Kinect camera and its software libraries extract a kinematic model of the human body. The shape of the data of our novelty detection system is further described in section 6. In this section we describe the Novelty Detection system rather than how the data for the poses is gathered and pre-processed. More information on the data acquisition and processing can be found in [8].
The process of detecting new poses begins with the arrival of a new pose data from the Kinect (Fig 2). This entry is tested against all other data entries received up to that point. This test consists of evaluating whether the received pose forms a cluster with other poses. If the result is positive, then the entry is considered interesting. After that, the entry is tested against the knowledge base (the model) to determine if this new pose is strange, i.e., if the new pose can be predicted by our model. If the result is positive for both tests, the entry is classified as novelty, and the robot will ask a query to the user, asking for the label of these new data. Once the user answers, the entry is learned by the system by adding it to the robot's knowledge base.

System general scheme. The new entry is first tested to be classified as interesting or noise. If it is interesting, it is then tested to check whether it is strange, or already known by the model. Only interesting but unknown novelties are learned.
If the new pose date are regarded as not interesting they are classified as noise. However, they are not discarded, since we will need them later to check if newer data form a cluster with the currently received instance. If they are regarded as not being strange, they are classified as known and are also kept in the dataset of all entries received.
Note that the system checks first if the new data are interesting instead of strange. The reason behind this is to avoid wasting computational resources in checking if a data entry is strange, prior to detecting whether this instance is interesting or not, i.e., we first acpply a noise filter to the received data.
The step of quantifying both the interestingness and the strangeness of a stimulus is very similar. It mainly consists of obtaining the model of normality M (θ) of a novelty detection algorithm, where θ represents the parameters of the model. This model produces a novelty score z(x), when it is evaluated against new data instance x. Then, we evaluate the novelty score z(x) against a novelty threshmold k

and, if this condition holds, then x is considered abnormal [3].
5.1 Enabling the System to Filter Noise by Evaluating the Interest of a Stimuli
If we want to ask the user as few queries as possible, we need to keep these questions as informative as possible. This implies that the sensitivity of the system should be as low as possible while being capable of detecting novel and interesting events. Summarizing, we need a step that it is able quantify the interestingness of an event and make questions to the user only when interesting events occur. Note that we call uninteresting events ‘noise’.
We assume that interesting events tend to form clusters in the learning space while noise is distributed uniformly. To enable the system to detect clusters, it has to store and track all the past events, or at least the most recent ones. Therefore, the system needs to account for all the entries it has seen recently, to see patterns of repetition. Another approach to detect interesting patterns is to use a novelty detection algorithm and fit it with all the data the system has ever observed. With such algorithms, new events that occur randomly are seen as outliers. However, events that are not noise produce instances that, eventually, will start forming a cluster. Once a cluster appears, the novelty algorithm would stop detecting the elements of this cluster as outliers. In other words, if an event occurs so often that its data stop being an outlier, the robot can consider that it is likely that the event would occur again in the future, and it can decide to ask the user for a label that describes the event.
5.1.1 Obtaining the Noise Score
To enable the system to decide whether a new instance is either interesting or noise, we build a model MI from a dataset I=[i1, i2,…,i m ] that contains all the previously observed instances 1 . These include both the instances added to the dataset and those that are considered noise. 2
This dataset I is expanded every time a new pose is presented to the system. Fitting a novelty algorithm with I, produces a fitting score:

5.1.2 Obtaining the Interestingness Threshold
The interestingness threshold is obtained from the scores of the normal dataset. We use the Extreme Value Theorem (EVT) to obtain its value. EVT is a ‘branch of statistics which deals with extreme deviations of a probability distribution’ [3]. It considers extremely large or small values in the tails of the distribution that is assumed to generate the data to obtain the threshold [3]. For instance, setting the novelty threshold at one σ from the mean, implies that any instance which scores z1>σ or z1<−σ will be considered strange.
Formalizing the equation that represents entries outside the threshold region:
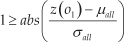
In this example, the score of the new data entry is one σ unit away from the average value, μ of the normal scores. A value of one σ means that a new entry is labelled as normal if it lays within the 68% of the closest scores to the mean of the dataset. If the standard score is higher than 1, the score z(o 1) can be considered high with respect to 68% of the normal entries, and can be classified as strange.
This is for the case in which we want to consider 68% of the closest instances as normal. However, it might be the case in which our model should be more or less restrictive when considering new entries as normal or abnormal. To do so, we introduce the concept of curiosity factor K. In essence, we use a threshold +K and -K, instead of +1 and −1 to allow our model to be more or less restrictive. Therefore, we have:

and if we develop this expression:

where abs
Therefore, with Eq. 5, any value of o1 which produces a noise score below or equal to 1, will be considered interesting.
5.2 Enabling the System to Evaluate the Strangeness of a Stimulus
In the previous step, the system was able to detect if a new stimulus would be likely to happen again. After this step the robot needs to know if this interesting pattern can be predicted by the robot's model. If the stimulus is unknown by the model it means that it is an interesting and unknown event that might be worth learning.
To evaluate if a stimulus is known, we evaluate new instances against the normal dataset. The normal dataset consists of the poses that have been considered normal in the past and that were learned at some point. The model of normality is generated by the novelty detection algorithms using the normal set as the training set. The normal set is expanded as the system learns new poses. The system learns whatever the user teaches it. We consider that the learned poses are a consistent base of knowledge.
5.2.1 Obtaining the Strangeness Score
The model is obtained by using one-class classification methods. These classification methods allow us to compute a score of how well each instance fits the model. The score is calculated differently for the distinct methods used in this paper (see section 6.3.1).
If we consider the normal dataset N=[n1,n2,n3,…,nm] which contains all the instances that have been considered normal, and we fit a model MN with it, we can obtain a fitting score for each of its instances:

The strangeness standard score zstr of a new entry o1 4 , can be calculated as follows:

Note that this is similar to Eq. 2, but using with μ and σ calculated from the dataset
5.2.2 Obtaining the Interestingness Threshold
Following the same procedure as in section 5.1.2, we can obtain the noise threshold:

Here, again we use the notion of the curiosity factor to control how much close to the average should an instance be to consider this instance interesting.
5.3 Curiosity Level of the Robot
The value of K represents where we place the threshold that decides which are the extreme values of a fitting score. By increasing K, we decrease the range for the extreme values and thus are considering more instances as being normal.
This K factor, as we have seen, can be applied to both strangeness and interestingness. This is key to the sensitivity of the system. 1We can increase sensitivity by decreasing the curiosity factor, because, to be normal, the new score will need to be closer to the mean with respect to all other instances in the base of knowledge.
An important remark is to note that, as the value of the curiosity factor depends on the sensitivity degree that we want to achieve, and also on the nature of the data in the application, it needs to be computed empirically.
5.4 Enabling the System to Learn from Novel Stimuli
If a new instance passes the interestingness and strangeness filters, it is classified as a novelty that has to be learnt. This means that the robot asks the user for a label for this instance. Once the robot knows the label of the instance, it can learn it.
The learning process consists of adding the novel data to the robot's base of knowledge; that is, the normal data set. With the new data, the model of normality is recalculated and expanded. Therefore, a new score is added to the set of normal scores, so its mean μ and standard deviation σ are recalculated.
5.5 Description of the Used Novelty Detection Methods
In sections 5.1 and 5.2 we refer to the models MI (θ).and MN (θ). The models highly depend on the novelty detection algorithm being used. In this section we describe the different ND algorithms that can generate models such those described in these sections.
Novelty detection techniques can be classified in the following categories [3]: (i) probabilistic, (ii) distance-based, (iii) reconstruction-based, (iv) domain-based, and (v) information-theoretic techniques. Each category has a series of advantages and disadvantages, and different computational costs. Since there is no single universal method for novelty detection [7], the choice of the appropriate algorithm depends on the task. In section 6, four algorithms have been chosen to test their novelty detection performance for the pose recognition problem addressed.
5.5.1 Probabilistic-based Novelty Detection Methods
These techniques use probabilistic methods that often involve a density estimation of the normal class. An entry in a low density area indicates that there is probability of it being a normal object [3].
The method used in this category is
This paper used the implementation of GMM provided by Scikit-Learn Library [9]. It does not provide directly a normal or abnormal method, but it does provide a built-in function called score. The score represents the log probability of a sample under the model.
5.5.2 Distance-based Novelty Detection Methods
This category includes the concepts of nearest-neighbour and clustering analysis that have also been used in classification problems. It assumes that normal data are tightly clustered, while novel data occur far from their nearest neighbours [3].
This paper tested one method from this category,
The K-means method was also implemented in the Scikit-Learn Library [9]. It does not provide a normal or abnormal label either. The score function in this case represents the opposite of the value of X on the K-means objective [9].
5.5.3 Domain-based Novelty Detection Methods
Algorithms in this category use domain-based methods to characterize the data for the model of normality. These methods typically try to describe a domain containing normal data by defining a boundary around the normal class such that it follows the distribution of the data [3].
Methods used from this category are specifically categorized as ‘outlier detection methods’, and directly provide a label categorizing test data as normal or abnormal.
One of the algorithms chosen was
The other algorithm used is
6. Experimental Evaluation
6.1 Data Acquisition
To carry out our experiment we used the Poses Dataset recorded in a previous work [8]. The dataset consists of 30 users teaching a robot a set of poses captured using a Kinect camera. Each pose is recorded as a data instance I:

where t is the timestamp of the pose, J the set of joints returned by the Kinect and, l the label for that pose. The set of joints J =(j 1, j2,..,j 15) is composed by 15 joints where each joint ji is composed of:
whose fields correspond to its 3D position, and a quaternion defining the joint orientation.
6.2 Interactive Labelling of What the Robot Sees
To fill the label l from Eq.8, the user has to tag the pose she is showing to the robot. The process of tagging (labelling) the poses is carried out interactively by voice during the training stage.
Our robot is equipped with an ASR (automatic speech recognition) system described in a previous work [11]. This ASR is grammar-based, which means that the robot extracts semantic meaning from the user's speech providing she follows certain pre-written grammar rules when speaking. A grammar is defined by the tuple G: (Ph, S) which relates a set of phrases Ph with a set of semantic meanings S. For instance, it is possible to write grammar that relates the sentences “Please, could you help me?” and “Could you give me a hand with this, please?” to the semantic meaning of soliciting assistance to the robot.
We have built one grammar Gp =:(Php,Sp) to detect if a user is telling a pose to the robot. This grammar allows us to detect up to nine pose definitions separated in three different categories: turned, looking, and pointing. The content of set Php is out of the scope of this paper; however, we define Sp since it contains the concepts we will teach the robot:

where sa,sd are the semantic meanings of the user's speech:
Action Semantics (sa). Which can take one of the following values: sa ={turned, looking, pointing}, where:
Turned (sa =turned). Defines that the user has oriented her whole body towards some direction defined in sd. Looking (sa =looking). Defines that the user has oriented her head towards some direction defined in sd. Pointing (sa = pointing). Defines that the user is pointing with her arm towards some direction defined in sd.
Direction Semantics (sd). It can take one of the following values: sd = {left, forward, right}, where
Left (sd =left). Defines that the action defined in sa is executed to the user's own left side. For example, if it is pointing, it is doing it to her left. Forward (sd = forward). Defines that the action defined in sa is executed to the user's front. Right (sd =right). Defines that the action defined in sa is executed to the user's right
When the robot detects a speech, the ASR evaluates it against Gp. If the evaluation produces a valid result, the ASR tags the speech with a label
Some label examples might be lp = (looking,left), which indicates the user is looking to her left; or lp =(turned, forward), which indicates the user is turned to the robot.
Note that the user can express the same semantic meaning in different ways. For instance, phrases such as ‘I'm pointing to the right’ or ‘Look carefully, I am pointing towards my right’ would produce the same semantic meaning: lp = (pointing,right)
6.3 Method
From all the poses the users recorded for the dataset, we only use three of them: pointing left, right and forward (Fig. 3). The main reason for this decision is because the pointing poses were the ones that presented more differences between users, so it was easier to simulate novelties by just adding users that pointed differently (e.g., robot learning labels from right-handed users and then presenting left-handed as novelties). Therefore, although the users trained the system with three labels, they did it differently from ones to others. In fact, we counted an average of three different ways of pointing for each class. That makes, potentially, up to eight different classes of novelties to be detected in our dataset (one training, the rest in the test set).

Example of a user pointing. With permission from [8].
We cleaned the dataset to adapt it to the experiment requirements. Mainly, we removed the parts of the body that were less significant for pose learning: that is, the lower-part of the users' body. In that way, the used joints were head, neck, torso, and right and left shoulder, elbow, and hand. Additionally, we normalized all the data to have the frame of reference in each user's torso instead of the Kinect's.
We evaluated the detection performance of four novelty detection algorithms: Gaussian Mixture Models (GMM), K-Means, One-Class Support Vector Machines (OCSVM) and least squares anomaly detection (LSA). For the first three algorithms we used the Scikit-learn implementation [9], while for the latter we used the LSA author's implementation [10].
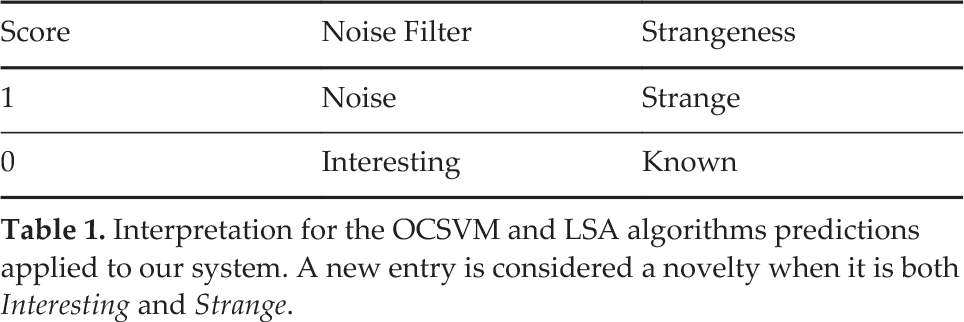
6.3.1 Mapping the Output of the Algorithms
OCSVM and LSA provide directly a numeric label classifying the entries as anomalous (1) or normal (0). Table 1 describes the meaning of these labels in each step of our system. Note that the objective of our system is to detect novelties; that is, instances that are interesting but strange for our model. In terms of these algorithms this would reflect that a novel entry would score 1 and 0 in the Noise Filter and the Strangeness Test respectively.
Interpretation for the OCSVM and LSA algorithms predictions applied to our system. A new entry is considered a novelty when it is both Interesting and Strange.
The output from K-Means and GMM are slightly different. Instead of providing a binary value, their output is a score. (see sections 5.2 and 5.1). Table 2 describes the mapping between the values of these scores and their corresponding
Interpretation for the K-Means and GMM algorithms predictions applied to our system. A new entry is considered a novelty when it is both Interesting and Strange.

interpretation in the Noise Filter and Strangeness tests. Note that a novel entry (interesting but strange to our model) needs a score below 1 in the Noise Filter and equal or greater than 1 in the Strangeness evaluation test.
6.3.2 Graphic Interface
A graphic interface was created to show the results of the tests and the shape of the skeletons we were considering, as can be seen in Figure 4.

Graphical representation of the algorithm when exposed for the first time to new poses. Poses that were used to learn are in red, current observed pose is in black, and previously observed but not yet incorporated are in blue. The figure shows a system that has been trained with pointing right poses (in red) that, after training is exposed to pointing left poses Each row represents a new observation of a pointing left, which is, finally, marked to be learnt in the third row.
Figure 4 depicts an example of how our system operates. The left part is represents the Noise Filter tests while the right part shows the Strangeness evaluations. The 3D plots represent all the observed poses. In red are depicted the poses that have been incorporated to the system which, in the example of the figure, all are pointing right poses. In black the last observed pose is represented. In blue are the observed poses that have not been incorporated into the dataset. The bar plots indicate the score of each algorithm in each test. If one algorithm score is below the threshold (which is 1), then the test is passed (indicated by the bar painted in green) 5 . Table 3 summarizes the colours of the figure and their representation.
Colour codes for Figure 4

In the upper row the system observes, for the first time, a pointing left pose, which is evaluated against the noise filter. Since it is the first time that the system is exposed to that pose, the filter considers the pose as noise. However, the instance is not discarded but stored in memory for further evaluation in case similar poses appear in the future. In the second row, another pointing left pose is observed. This time the filter scores lower results since there is another similar pose in the observed dataset (the previous one). In the lower row, a third pointing left pose is observed. This time it passes the noise filter and, therefore io evaluated against the Strangeness step. Since the pose is not known by the model (scores low in the test), the test is passed, indicating that the pose is a novelty that should be incorporated to the dataset of known poses (red). In this case, the robot would ask the user for a label describing the observed pose.
6.4 Results
In this section we describe the results of the experiment that asses the performance of our approach. We carried out two different experiments, one for evaluating how well the system interprets the interestingness of new data, and another one to evaluate how it calculates the strangeness of these data. We also evaluated how well the system is able to detect novelties that belong to already known classes (e.g., new ways of pointing to the same direction)
6.4.1 Evaluating the Interestingness of new Data
As we defined in previous sections, to prevent asking too many questions to the user, new data are not considered interesting until they do not start forming clusters. In the case of poses, a new pose is considered noise until the robot has seen it several times.
Therefore, we were interested in knowing how many times a pose should be presented to the robot. That is, how many times does the user needs to stand in front of the robot in the same pose, until the robot becomes interested in that pone. Because in the dataset each user showed the same pose only once, we show the same pose with different users.
Fig. 5, shows the interestingness evaluation results. The plot shows the evolution of the noise score for the different algorithms. The X axis represents the cumulative number of users that showed the same pose to the robot, while the Y axis represents the average noise score from the algorithms, extracted from 63 try-outs. A score below the noise threshold, indicates that the entry is detected as interesting.

Noise score evolution when adding from one to five instances of an unknown pose. Points below the threshold indicate that the pose is considered interesting.
One of our design choices is to avoid the robot asking the user the first time it sees a new pose. Therefore, we consider that the algorithm should mark as noise each pose when it is observed for the first time.
We found that setting the curiosity factors to KGMM =3 and KKm,ans = l produced good results for GMM and K-Means respectively. Both GMM and K-means do not start considering a pose as interesting until it is observed, at least three times. On the other side, OCSVM and TSA detected new poses as interesting the first time they observed them. In this way, they are over sensitive to new stimuli. In other words, in our set up, GMM and K-Means acted as better noise filters than the other algorithms. As we will discuss in section 6.5, the value of K has been of paramount importance with respect to the algorithm's performance.
6.4.2 Strangeness Evaluation
The next step after new data are detected as interesting is finding out whether these data are already known by the model or if, on the contrary, the current model cannot predict them confidently.
To evaluate how well the system predicts the strangeness, we train with poses of one class and test it against poses of other classes. In such a set-up, poses with other classes should be classified as novelties (strange) while poses of same class should be classified as not novel (known). For instance, if we train our system showing it only poses of the user pointing to the right, the model should consider strange any other pose that is not pointing to that direction, and vice-versa.
To evaluate the performance of this task, different experiments were carried out with the existing dataset. The dataset was separated by poses, pointing right, pointing left and pointing forward. Each user showed the robot each pose once.
In the experiment we built three different models, one for each pose, and then tested how these models were able to predict the other two poses. For instance, we built a model from instances of users pointing to their left, and then tested with users pointing forward and right.
After building the models and evaluating them independently, we merged and averaged the results to give a general overview of how well the system works. The expected result is that all the entries from different poses should be detected as strange, while the entries from the same pose should be detected as known.
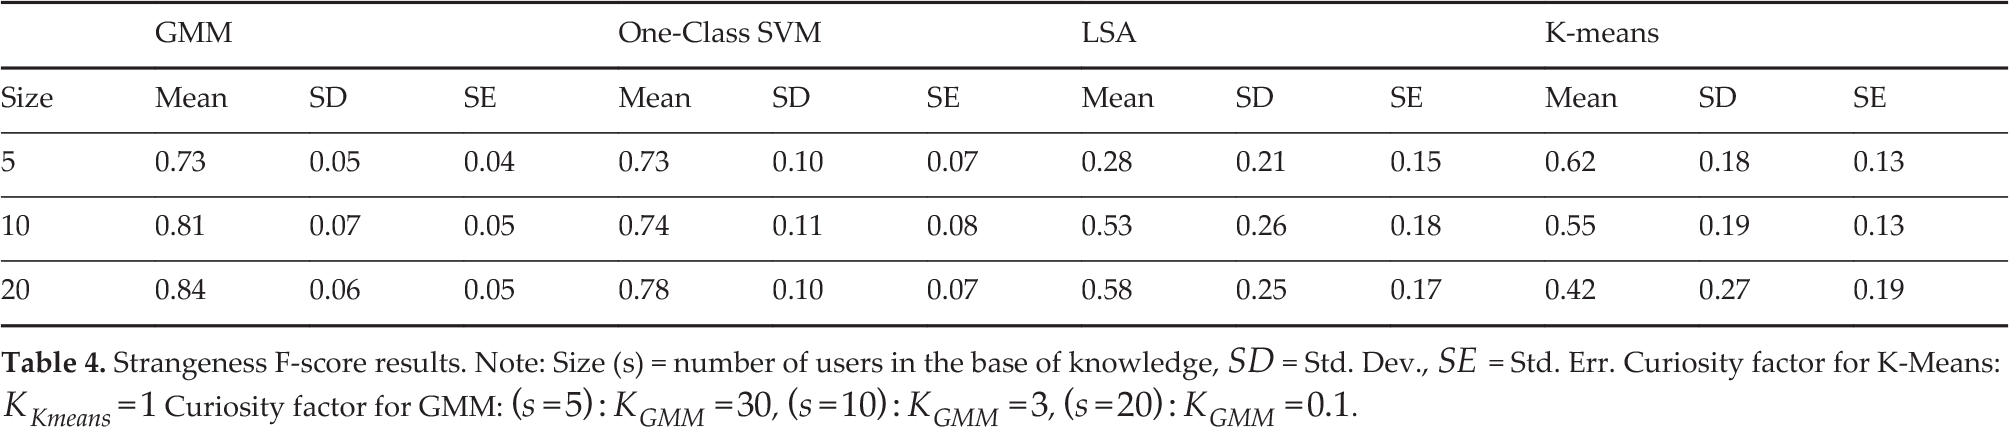
This process was repeated three times, where the model was built with training datasets of 5, 10 and 20 instances for each pose. The test datasets were always of size 20, containing five entries of each of the other two poses, and ten entries of that same pose.
We considered the problem as a one-class binary classification where a known class was marked as negative (0) and new classes marked as positive (1). Table 4 summarizes the results for the experiment using the F-Score [12]. Note that a higher F-score means poses classified correctly, while lower F-scores indicate the model failed at predicting such poses.
Strangeness F-score results. Note: Size (s) = number of users in the base of knowledge,
6.4.3 In-Class Novelties
If compared separately, we found a worse performance of the algorithms when trained with the classes pointing left and pointing forward, so we decided to test these classes more specifically. In-class novelties are defined as novelties within a class. We divided the poses of these classes into sub-classes. The aim is to test if the system would detect if the user is pointing left with her right arm or with her left arm.
To test novelties between classes we carried out the following procedure. The training dataset had five instances (each one from one user). The test dataset consisted of six known instances plus six unknown instances. Note that the ground truth of known instances is non-novelty. That is,
they are instances created by users that pointed in the same manner as the training users did. For example, if the pointing poses in the training dataset were recorded from a right handed person, these six known instances were recorded from other right handed people. The motivation of using known and unknown instances in the test dataset is to evaluate how well our system detects both the known and the unknown.
The six unknown instances (whose ground truth is novelties) were distributed in 2 + 4 sub-classes 6 . Two of them were in-class novelties, that is, novelties that belong to the same class as the known model. For instance, if the training data consisted of examples of right handed people, these two instances were retrieved from left-handed people pointing to the same directions as the training data. The remaining four were novelties belonging to other classes (e.g., pointing-right when the training data were with pointing-left poses). Note that we only used five users to train the system because the division in sub-classes did not allow us to use bigger training datasets.
Our hypothesis is that instances belonging to the same subclass should be detected as normal, while instances from different sub-classes or from different classes should be detected as novel. The sub-classes that we used are described in table 5, and table 6 summarizes the F-Score of the algorithms for these different poses.
Description of the sets for in-class novelty detection

Novelty Detection F-Score [Mean (Std. Dev, Std. Err.)] for in-class novelties.
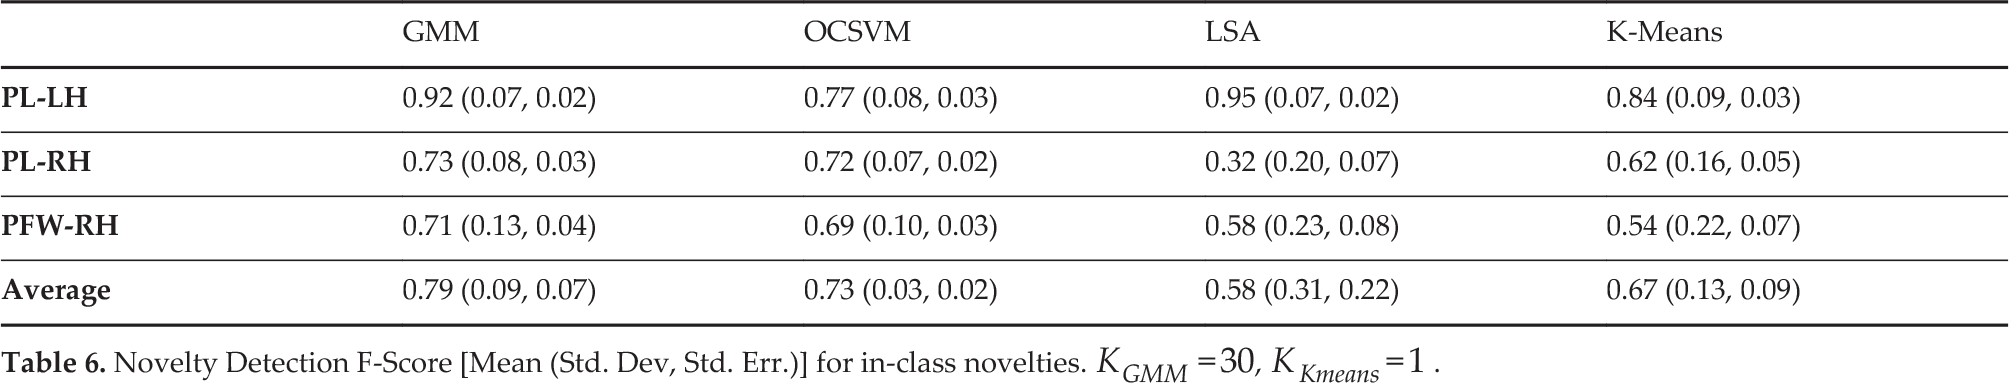
When the average results were considered, GMM performed better than the other three algorithms. In general, the average F-score is similar to the results from table 4, which implies that the system is capable of detecting both novelties that belong to new classes as well as in-class novelties.
6.4.4 Novelties in Multi-Class Systems
In previous tests, we evaluated the capacity of the system to detect novelties when it was trained with a single class. In this section, we evaluate the system to detect novelties, but when it already has learnt two classes. The results of the experiment, shown in table 7, indicate that the system keeps a similar performance compared to the previous experiments. In this experiment, OCSVM performed better than GMM.
F-score obtained when the system was trained with two classes and presented a new one.

6.5 Discussion
The results show that our approach enables a robot to detect when a user is standing in a pose that has never seen before and to decide whether this new pose is worth learning or not.
In general, GMM performed the best to detect when a new pattern started being interesting and to detect when new data were not known by the system (i.e., when they were strange). The key for its good performance was the possibility of modifying the curiosity factor K, which allowed us to tune the algorithm to be insensitive to new stimuli until a stimulus is not observed a certain number of times.
The main drawback of our approach is that as the knowledge base (that is, the size of the training set) grows, K has to be adapted accordingly. Despite K having to be set empirically, we believe it is possible to find the relation between K and the dataset size. However, this requires further work, since K will depend highly on the algorithm used (K-Means, GMM, etc.) and on the nature of the data themselves.
The curiosity factor KGMM had to be adapted depending on the size of the base of knowledge. As an example, if we kept KGMM =3 for a training dataset of 20 users, all the entries were detected as being normal. Thus, KGMM needs to be decreased, to make the system more sensitive. In a trial with five users, KGMM needs to be increased to 30, since none of the entries were detected as normal with KGMM =3, and thus the system is less sensitive. We found that the best values for KGMM were 30, 3 and 0.1 for 5, 10 and 20 users respectively. The curiosity factor for K-Means, KKmeans, on the other hand, was suitable for all the trials.
In our preliminary findings we found good values for

Our work also needs to further explore how well our system will scale to a greater number of classes. Despite our system having to face to up to eight different novelties, we want to know how its performance varies as new novelties are being discovered and incorporated into the model. If the system is designed to be continuously acquiring knowledge, it is expected that, over time, it will be discovering new poses that should be learnt. Eventually, it will have to handle a large number of classes. Despite the algorithms that we used already working well with big datasets, we need to understand how the system as a whole behaves in such situations.
Another limitation of our system is that we learn with a predefined dataset. Despite our approach being valid for the input data, we did not test our system in real time. We still have to see how people react to the robot's questions for new data. In this way, there are two metrics that might be evaluated. First, from the robot's point of view, replicating our work, but in a real scenario, would produce a better estimate of how good our system is at working in real set ups. Second, from the user point of view, it is interesting to know how robot's questions affect the people's perception of the robot's intelligence and capabilities, especially in the long term where people can see how a robot's knowledge evolves over time. Our further work would focus on these two points of view, together with a further exploration of how the K parameter affects learning.
7. Conclusions
We presented a system that endows a robot with the capacity to decide actively whether to learn or ignore novel stimuli when exposed to them for the first time. We separate this decision into two steps: first by deciding if a visual stimulus is interesting, i.e., it is worth learning, and second by deciding whether the current model is able to predict it confidently, i.e., the stimulus is strange to the model. In that way, if a stimulus is both interesting and strange, the robot can actively ask the human for a label tagging the new data. Both steps are based on novelty detection algorithms with an extension to parametrize how curious the robot should be.
Our system has been tested in the application of pose recognition, in which the system learns the poses adopted by a human teacher. To validate our approach, we evaluated our system with 28 non-robotics experts training the robot three different poses. We compared four novelty detection algorithms, for both the noise filter (interestingness filter) and the strangeness detection filter and we found that GMM and K-means are more suitable for the noise filter, while GMM stands out as a strangeness filter.
The main advantage of our approach is the use of the curiosity factor K. This factor enables the robot to adapt the algorithm to specific application domains. That is, K enables the robot to be very sensitive or insensitive to novelties depending on the application requirements. For instance, we tuned K to make the robot insensitive to new stimuli until these stimuli are presented a determined number of times.
However, using K as a parameter to model the robot's curiosity presents two main issues that have yet to be solved. First, finding a good value for K has to be performed empirically. Therefore, the designers of the system must tune this parameter manually before the system can be applied in a certain domain. Second, as the knowledge base of the robot grows, the robot starts becoming less sensitive to new stimuli. One way to mitigate this is by automatically adapting K to the training dataset size, but, since the value of K has to be defined manually, the designers have to calculate beforehand how different values of K will affect the robot's curiosity as it gains more knowledge.
Footnotes
1
If these data are too big, it is possible to use a memory of recent events and use only the data that have been stored in that memory
2
Notice that the instances considered to be noise are needed so we can evaluate later if they form clusters
3
The standard score formula can also be denominated as the normal score or z-score in the literature
4
The convention is using the letter to label outliers
5
Note that, since the important value is the threshold, the scales of the bar plots are not in scale to facilitate a better visualization of the plots
6
We consider a sub-class the instance of one class that differs from the rest in some aspect. For instance, a pointing pose would be different if executed right-handed than if performed left-handed
8. Acknowledgements
The authors gratefully acknowledge the funds provided by the Spanish Ministry of Economy and Competitiveness through the project ‘Aplicaciones de los robots sociales’, DPI2011-26980.