
Abstract
At the factory level, the manufacturing system can be described as a group of processes governed by complex weaves of engineering strategies and technologies. Decision-making processes involve a lot of information, driven by managerial strategies, technological implications and layout constraints. Many factors affect decisions, and their combination must be carefully managed to determine the best solutions to optimize performances. In this way, advanced simulation tools could support the decisional process of many SMEs. The accessibility of these tools is limited by knowledge, cost, data availability and development time. These tools should be used to support strategic decisions rather than specific situations.
In this paper, a novel approach is proposed that aims to facilitate the simulation of manufacturing processes by fast modelling and evaluation. The idea is to realize a model that is able to be automatically adapted to the user's specific needs. The model must be characterized by a high degree of flexibility, configurability and adaptability in order to automatically simulate multiple/heterogeneous industrial scenarios. In this way, even a SME can easily access a complex tool, perform thorough analyses and be supported in taking strategic decisions.
The parametric DES model is part of a greater software platform developed during COPERNICO EU funded project.
1. Introduction
With increasing competitiveness, factory simulation tools have become more strategic and important for gaining business advantages. Even for SMEs, taking strategic decisions needs a few key performance values but these depend on a lot of information driven by managerial strategies, technological implications and layout constraints [1–3]. Many factors can affect decisions, and their combinations have to be carefully managed to determine best solutions and optimal performances. Discrete Event Simulation (hereafter DES) can support decisions by providing effective models and giving the opportunity to play what-if games, moving towards optimal scenarios [4,5].
In this paper a way to create an adaptable and flexible DES model that can be automatically tailored to many manufacturing systems is proposed and discussed. The goal of the DES-based parametric model is to offer a smart way to configure and interpret the results coming from advanced, complex simulation tools, avoiding the time and moneyconsuming process of building and validating.
Based on a known, flexible DES language, a fully parametric model has been realized. By accessing the model any user can represent manufacturing processes, simply browsing between alternatives and inputting the required values to parameters.
Thus, an innovative combination of a smart parametric-driven configuration and the traditional optimization opportunities of DES can be obtained [6,7]. The traditional approach consists of formulating the problem, building the simulation, running the model and analysing the output. In this way the effort and support of a simulation expert is fundamental. Even if penalizing the visualization of flows or the free-to-model architecture, the novel approach leads to many advantages when speeding up the process between data input and result collection [8]. The user can interact with the model by configuring a pre-defined architecture and would automatically receive simulated performance values [2,9].
The parametric modelling approach has been developed within the Arena Simulation software package [10]. The parameterization is the method chosen to reach the desired high level of configurability and adaptability of the DES-based model [11,12].
The model is intended to simulate multiple manufacturing systems, and thus the design phase dealt with defining how to differentiate from a logical point of view physically different environments. The answer is a combination of options and parameters. The parameters are the way that guarantees to the user an immediate access to simulative results [13–15].
The interaction between potential users and the model is critical. Thus, the design of the model architecture cannot consider only the simulation environment, but the software development has comprehended the understanding of how the user would potentially interact and how the data flows should be. The model is now able to accomplish these main objectives:
easy configuration for web application;
data management without excessive detail level;
automation of the model configuration and performance assessment;
no direct use of the commercial-on-the-shelf tools.
The parametric model is actually integrated into the COPERNICO system. Once the information and the data, depending on the cladistics classification [16], have been gathered from the user an automatic process is put in place.
The process configures and modifies a parameterized Arena template by acting on the SIMAN code. Output/statistics are collected automatically and, appropriately organized, can be displayed on the web.
2. The model within COPERNICO SW platform
The parametric DES model fits within the COPERNICO system: once the information and the data, depending on the cladistics classification, have been gathered from the user, an automatic process is put in place. The process configures and modifies a parameterized Arena template by acting on the SIMAN code. Output/statistics are then collected automatically and can potentially be shown on the web.
A well-structured workflow is hidden behind this process (Figure 1). Once the user accesses the COPERNICO system it is immediately addressed to a diagnostic section. By following a guided path, answering thorough questions, the user's manufacturing system(s) profile is determined by following an evolutionary classification approach.

The parametric DES model within the COPERNICO system.
The cladistic classification is based on what can distinguish any manufacturing system from another. The cladistics considers that manufacturing systems can be classified into an evolutionary tree based on the similarities between them. The differences between species in this evolutionary classification could be easily related to the parameters. In this way it is possible to determine if the parametric model can be applied to the user's case and to reduce the number of the parameters required.
Having determined the general characteristics of a manufacturing system through diagnosis, a first prototype of a virtual factory including the specification of all the processes, systems and resources is required. To address this, other interactions with the platform functionalities and data capture systems are needed. A web-based requirement capture tool has been developed within the platform to speed up the data gathering process in order to tailor the parametric model on the diagnostic state already configured.
The workflow (Figure 2) is fairly simple, and includes the trajectory between the user accessing the COPERNICO system via the web and achieving the desired results from the simulation engine. The user interacts in this process by providing information and data, but the process itself is fully automatic:
Diagnostic: the user accesses the system via the web. Once logged in it is addressed to the diagnostic section. At the end of this process, the user has been classified according to the cladistics approach. Some parameters are set up automatically according to the classification;
Requirement capture for simulation: once classified, the user has to enter information and parameters needed for the simulation. The list of requirements is embedded in the requirement capture tool. In this phase, the user not only inserts the values of the parameters but also determines the complexity of the simulation giving dimensions to the arrays. Once completed, all the arrays and the data gathered are stored to speed up the configuration of alternative scenarios;
Simulation engine: values and requirements captured must be translated in DES language to realize a tailored simulation model. This software engine automatically transforms the DES template to a case-specific DES model. The engine is also responsible for running the model in batch mode and collecting the main statistics;
KPIs management: the key performance indicators must be created from the simulation results. Nowadays a list of KPIs is hard-coded within the tool, but it would be possible to also build up case-specific KPIs;
Display: once managed and calculated, the KPIs are displayed to the user in a common format, downloadable from the web and open for comparison against alternative scenarios.
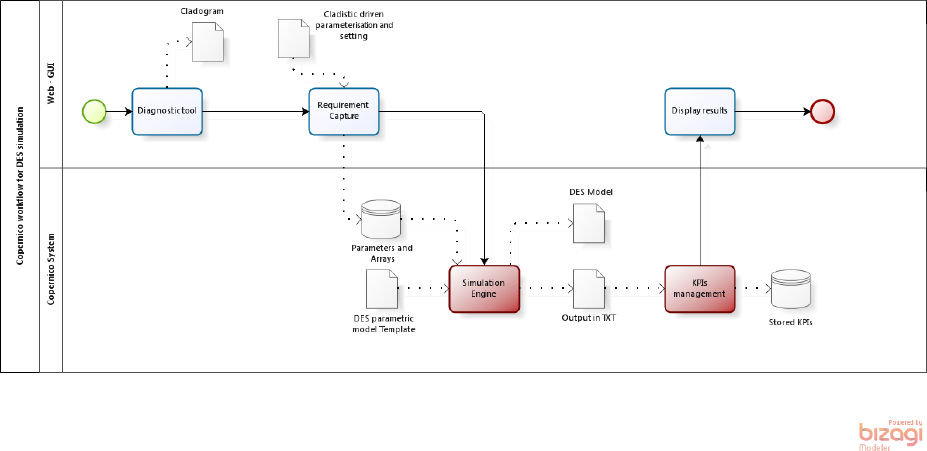
Integration of the model within the COPERNICO system. Data exchange and end user interaction.
3. Parametric DES model
The parametric model has been realized, taking into account that the architecture:
has to enhance the configurability of the model from a remote web application;
has the scope to support strategic decisions, avoiding any exceeding detailed information;
has to require a simple, not over-complicated data gathering;
has to foresee a potential interface with the user's data warehouses;
has to facilitate the automatic configuration process;
has to avoid any direct use of the simulation engine;
has to foresee data exchange with other in-use tools.
3.1 The model template
The parametric model is thought of as a unique structure able to auto-evolve at the end of the user's configuration process.
At the beginning the model is a template, and the configuration process would directly and automatically resize it. To do this, a basic model has been created representing the starting point from where to evolve once the user has defined the complexity and peculiarity of his manufacturing process. The evolution of the model from the seed depends on the dimension of the problem, as defined by the user at the end of the configuration process. This dimension is given by a set of arrays. A combination of these arrays would describe one or more manufacturing streams. The key dimensions of the parametric model are: WST-workstation, PRO-product, OPE-operator, MAC-machine, LVL-level (production sequence).
At the end of the configuration process the maximum value of these arrays determines the dimension of the model, whilst the parameters associated to them univocally characterize it.
By resuming the complexity of the problem, the model can potentially simulate either a set of operations or multiple parallel processes as multi-sequences of multi-product sequences of multi-operator sequences of operations. What varies is the dimension of the problem given by the arrays and the parameters associated to them.
The seed is an elementary structure representing the simplest manufacturing system: a single workstation (WST equal to 1) where a single product (PRO equal to 1) is worked manually (OPE equal to 1 and MAC equal to 0) once on this workstation only (LVL equal to 1). The template is fully realized in an Arena environment, and three key parts compose it.
3.1.1 Setting and order modelling
This section is related to the order generation. The configuration process will not alter the Arena code behind this, but only the dimensions of the matrices arrays' dependent thought to store the parameters as valuated by the user. In this section the ordering process is described through the following parameters. Table 1 and 2 list all the parameters required by the user [17,18].
Parameter describing setting and order section.

3.1.2 Manufacturing system
This portion of the model is related to the manufacturing process and is fully parametric. In the template it depends on the key arrays, all set up at their minimum value (1x Product, 1x Process, 1x Workstation, 1x Operator, 0x Machine). This is the part of the Arena code altered after the user has finished the configuration.
3.1.3 Statistics
This section remains mostly unaltered during the configuration process and is thought to calculate the statistics at the end of the processes. These are the values recorded in the output generated by the model.
3.2 Exporting the code of the model
Once completed and validated, the Arena template has been exported in the SIMAN language, the code behind Arena. Doing this, it is possible to facilitate the integration with the ESB and the web as a consequence. Furthermore, it facilitates the task of automating the process of realizing a model tailored on a user's needs from the template. On the other hand, this choice denies the possibility of representing the flows on the screen with the visualization of the COTS. For this reason this approach has been addressed as lightweight, because it is thought to return the user statistics obtained through DES and not DES animation.
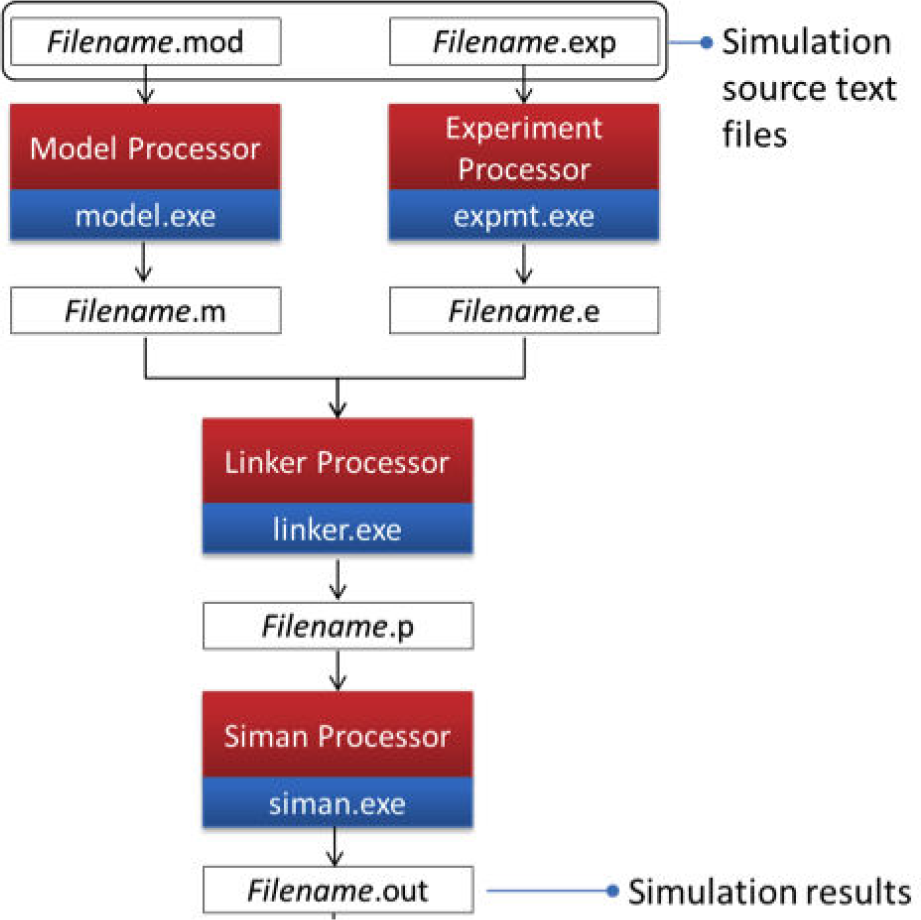
Arena is the object-oriented version of SIMAN. When an Arena model is built it is possible to export the source code. Two TEXT files are in fact created:
MOD file, where the architecture of the model is stored
EXP file, where parameters with values and dimensions are stored
This exporting process has been completed once the template has been defined, tested and validated (Figure 3).

Generating a.txt template from Arena code.
3.3 Test plan
The capability of the parametric model (whatever the simulation logic) to represent multiple manufacturing systems and scenarios has been tested. The test plan has been realized both in the Arena environment and, partially, directly within SIMAN.
In any case, the goal of the test plan is to verify the capability of the model to furnish statistics in multiple cases, with the model growing in complexity and variable in array dimension rather than parameter values.
The test plan execution is summarized in a matrix, where tests are descripted with a reference layout, the general settings and the correlation between test and species. This matrix is complementary of that shown in Task 1.2.
The model testing plan has been designed taking into account the classification of first generation cladograms. Many species have been evaluated from an analysis and simulation point of view. The tested scenarios here are thought of as the minimum model dimensions representing a manufacturing system.
The test plan permits to verify if the model can simulate and retrieve statistics combinations of the following:
Manufacturing lines (with all the variants listed in cladograms) or jobshops;
Single or multiple processes;
One or multiple products (multiple can be either finished products or sub-products);
Dedicated or shared resources (machines and operators);
Single or multiple capacity;
Make to Stock or Make To Order strategy;
Pull or push logic function of designed buffers;
Orders from customer
The full test plan is composed of more than 50 different tests. Part of the test plan is shown in Figure 4.
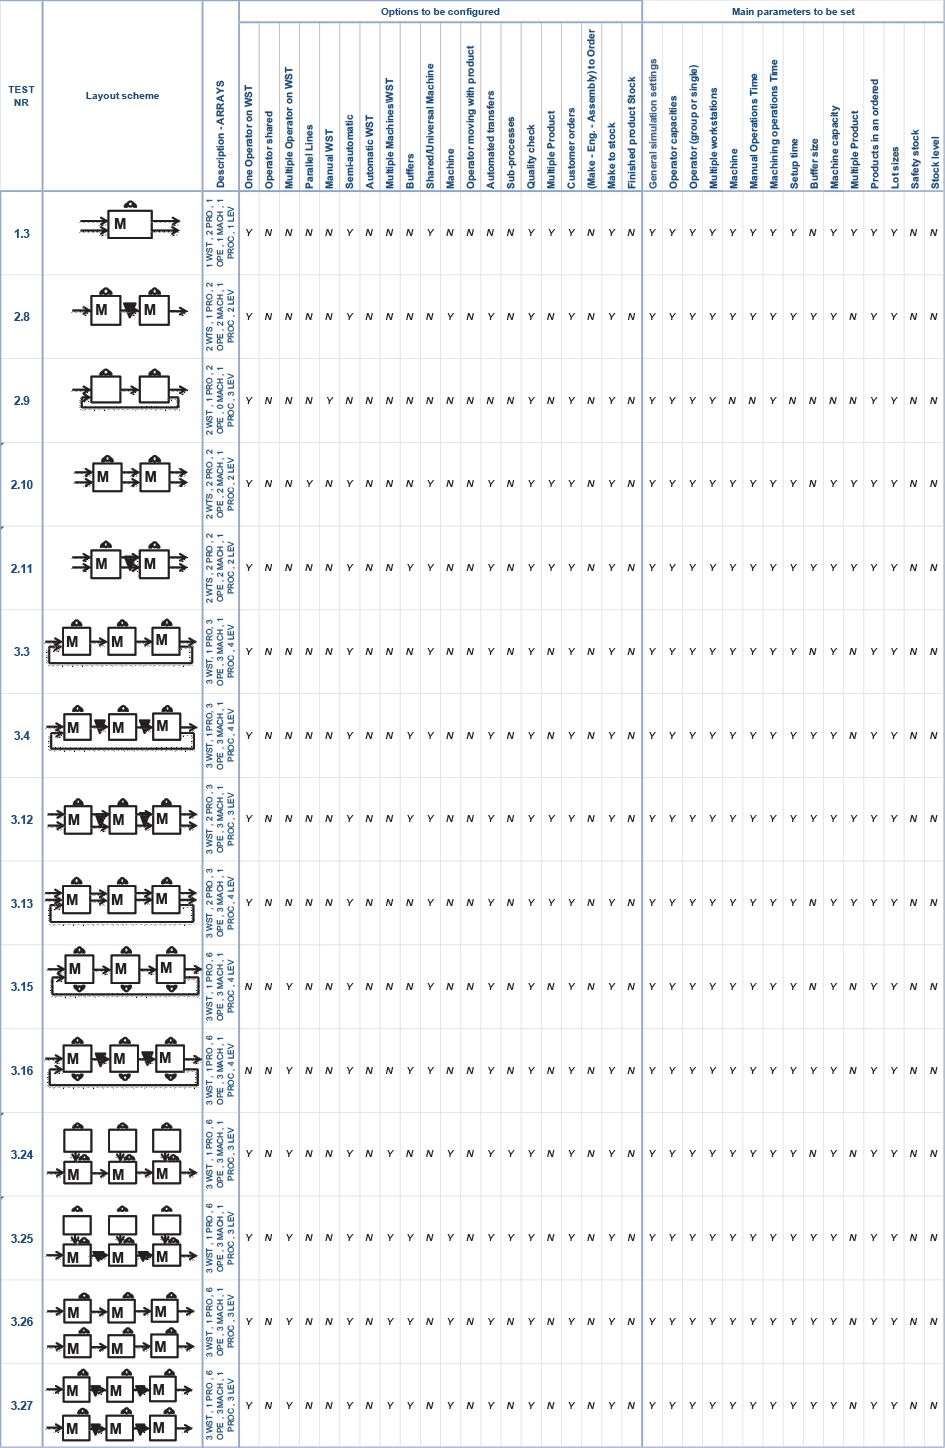
Part of the dry-run test plan with simple layouts.
4. Automating the model configuration and simulation
The automatic generation and running of a case-specific DES model, together with an automatic display of high-level key performance indicators, are the main goals of the developed software and workflow.
4.1 Configuring the model: data gathering
In order to give accessibility to the model, a web application has been realized within the COPERNICO platform. The tool thought to address the user to a DES tool has been called requirement capture tool (RCT).
The tool is a sequence of web pages that the user has to visit to complete the configuration process. For the parametric model, the user browses these pages, selecting between options and valuating parameters. In this way, an appropriate configuration process supports the flexibility of the model.
The RCT is divided into six main sections:
General settings
Product (PRO)
Operator (OPE)
Machine (MCH)
Layout (WST)
Production sequence (LEV × PRO)
Figure 5 shows a screenshot of the RCT, dealing with the ‘General Settings' configuration page of the case presented in this paper.

A screenshot of the COPERNICO requirement capture tool used to gather data and configure the model.
4.2 Generating and configuring the model with end-user data
Once the model template has been completed, the data coming from the user and stored appropriately in the central databases can be used to configure the model. All of the data and information the user has inserted through the RCT depend on one or more arrays. These dependencies act on two text files (.MOD and.EXP, see Figure 3) differently.
In the.MOD file, the rows of the code referred to the workstation section of the model (Table 2) must be duplicated as many times as indicated by the number of workstations the user has configured.
Parameter describing the manufacturing system.

Parameter for statistics calculation.

In the.EXP file, all the parameters must be dimensioned and valuated appropriately.
This process has been mapped in detail. In fact, altering the code manually would be extremely time consuming. However, since the model has been conceived as a template, a path can be defined in order to resize the model and its complexity automatically after the user has given dimension to his manufacturing system. Furthermore, the two SIMAN text files have been organized in homogeneous blocks to facilitate the automation of generating a configured model from the template.
In Figure 6 some actions needed on the.EXP files are listed, in particular:
The Variable Machine_ID(1) must be modified as Machine_ID(n), where ‘n’ is the number of workstations configured. In the same row the machine IDs must be inserted separated by commas;
The Variable Nr_Levels(1,1) must be modified as Nr_Levels(1,p) where ‘p’ is the number of products configured. In the same rows the number of workstations visited by every product must be written separated by commas;
The variable OPE_Capacities(1,1) must be modified as OPE_Capacities(l,p) where ‘l’ is the number of workstations for the product with the largest sequence. In the same rows, the operator capacity for every product and every sequence must be listed (between sequence first, between products then) separated by commas'
The expression Seize M WKT1.Queue must be duplicated in many rows as the number of workstations configured. Every row must have the same structure, except the number 1 which must progress up to ‘n’, number of workstations configured.

Some actions needed to configure the.EXP file.
Supposing that the user configured a process like this in Figure 7 with a machine (MAC equal to 3) and one operator (OPE equal to 3) for every workstation. The system is composed by three workstations (WST equal to 3) and two products have been configured (PRO equal to 2). ‘Product 1’ process is Wst1-Wst2-Wst3 (three levels), whilst the Product B process is Wst1-Wst3 (two levels). The actions in Figure 6 generate from the template code.
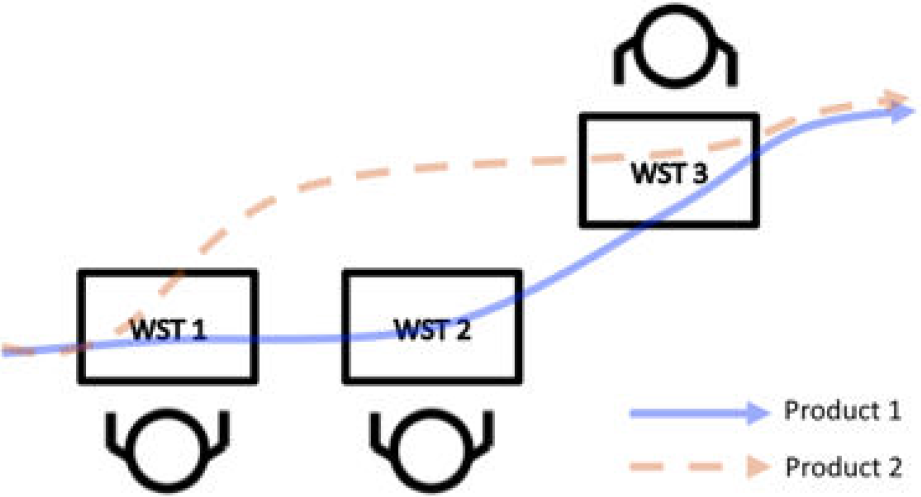
A simple manufacturing system.
Machine_ID(1),CLEAR(System),CATEGORY(“User Specified-User Specified”),DATATYPE(Real),0:
Nr_Levels(1,1),CLEAR(System),CATEGORY(“User Specified-User Specified”),DATATYPE(Real),:
Ope_capacities(1,1),CLEAR(System),CATEGORY(“User-Specified-User Specified”),DATATYPE(Real),:
Seize M WKT1.Queue,FIFO„AUTOSTATS(Yes„):
the configured code
Machine_ID(3),CLEAR(System),CATEGORY(“User Specified-User Specified”),DATATYPE(Real),1,2,3:
Nr_Levels(1,2),CLEAR(System),CATEGORY(“User Specified-User Specified”),DATATYPE(Real),3,2:
Ope_capacities(3,2),CLEAR(System),CATEGORY(“User-Specified-User Specified”),DATATYPE(Real),1,1,0,1,1,1:
Seize M WKT1.Queue,FIFO„AUTOSTATS(Yes„)
Seize M WKT2.Queue,FIFO„AUTOSTATS(Yes„)
Seize M WKT3.Queue,FIFO„AUTOSTATS(Yes„):
The completion of the configured.EXP file is a redundant sequence of actions like these. For this reason, a Java script has been realized in order to automate the model generation starting from the template.
This Java tool is part of the COPERNICO backbone. It runs on the ESB. It can be activated the following way:
The ESB publishes services to upload simulation data into the system. This simulation data is not Arena specific: it is general, ‘simulation tool neutral’, in order to be able to process it with different simulation tools;
The ESB publishes services to request an Arena simulation on the data uploaded during the first step;
When this second service is called, the ESB retrieves the neutral simulation data from the central database, and activates the Arena interface tool. It translates the neutral data to the Arena specific.exp and.mod files;
The last step depends on the scenario: it is possible from a technical point of view to launch the Arena in batch mode, and run the simulation automatically; otherwise it is possible to send (e.g., via email) the Arena input files to an expert who performs the simulation manually and sends back the results.
4.3 Running the model
Since Arena is an object-oriented version of an older DES language called SIMAN, when an Arena model runs it recalls a sequence of executable files in order to collect some default general statistics and those personalized as implemented in the template.
The result of the Java scripting is the alteration of the Arena template or, better, the configuration of the model acting on two text files:.EXP and.MOD.
Those files contain, respectively, the parameters and options collected from the users (.EXP) and the virtual layout (.MOD). The batch of executable files to obtain statistics from these two files can be automatically processed (Figure 8). At the end an.OUT text file is generated containing all the statistics.
Running the model in batch mode.
4.4 Returning statistics
The model runs in background, and at the end only the statistics of interest have to be returned to the user. All of the statistics are stored in the.OUT file. In the same method as the inputting process, the reverse data and information flow from the model to the user has been mapped. Thanks to this it is possible to return the KPIs in an automatic way with another Java process. The tool captures the rows in the text file containing the statistics to be displayed, variable both in value and in array size (for example the lead times and the counters vary with the number of products configured; instead the utilization varies with the number of machines and so on).
After this Java tool processes the.out file, the simulation results are stored in the central COPERNICO database. The client applications that are interested in the result are able to retrieve it via ESB services. Most of the time this client is only the web application that is reading back the simulation results in order to visualize it.
Figure 9 shows a portion of the.OUT file taken from an SME scenario, where some performances have been calculated:
The average order fulfilment time of the orders. This is an example of a statistics without any dependency;
The average order fulfilment time and lead time by product (PRO). A row for every product configured;
The average lead time and cycle time by workstation (WST).
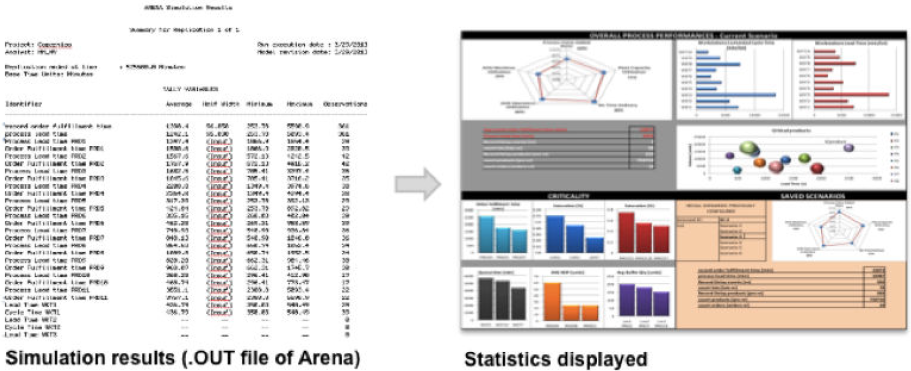
Generating and display statistics.
Currently the user cannot implement personalized KPIs, but those listed in the ‘statistics' table are shown for every user accessing the model. The output can be returned to the user in a graphical way that is easy to understand.
5. A SME test case
An Italian SME has approached the model, interested in monitoring the effect of some potential scenarios on the work in process and the product lead times within its shop. The SME produces aluminium parts for the some of the major automotive manufacturers in Europe. DES tools can support decisions quantifying the impact on performances after re-layouts, machinery modifications, new product introduction, new lot strategies or new forecasted demand.
The model is used to simulate the current scenario first, since it needed to be validated in the as-is environment. The model provided the desired flexibility in simulating the company processes. Many parameters stored in the databases can be easily altered by the company in order to build alternative scenarios and compare statistics very quickly.
The as-is scenario takes into account many different resources like stamping presses, deep drawing, welding and cutting machines. A group of seven operators is shared in the shop, composed of ten workstations. Ten different products have been simulated with a given manufacturing stream. Before exiting the system, every product has to complete a production sequence of two to four steps (LVL).
The main parameters have been inserted in the central databases using the RCT. Part of the data gathered are shown in Tables 4, 5, 6 and 7. Tables 6 and 7 shows two products only. Simple assumptions have been made autonomously by the user. The user also entered the following information: the factory works 16 hours on two shifts.
SME case: data gathered relating to products.

SME case: data gathered relating to workstations

SME case: data gathered relating to production sequences.

SME case: data gathered relating to the times associated to the production sequences. Manual and machining times refer to a single product.

No buffers have been designed. Transportation between workstations is provided by forklifts (assumed always available) with a speed of 2.2 m/s.
The first action the user has performed is to give dimensions to the arrays. Then, in the parametric model structure, all the data depend on combinations of these arrays; thus, it is pretty simple, from an end user perspective, to gather data and configure the model.
Currently the data gathering and filling process may require some time, as redundant activity may be required; further developments would connect the required data capturing to the company databases. After this process is completed, the parametric model runs in the background and the statistics of interest are returned to the user. All of the statistics can be easily displayed.
5.1 As-is scenario
Currently the company operates with a make-to-order strategy, The plant does not have a valuable degree of automation, and thus a pool of operators is enough to satisfy the workforce requested on the machinesThere are no manual workstations in the layout. Generally, big lot sizes are produced and long setup times are needed on the stamping machines. Order frequency has been estimated, looking at historical data.
The as-is layout is shown in Figure 10.

SME case: as-is layout.
Once simulated, the parametric model returns a set of statistics and KPIs of interest.
The output generated by the simulation displays values, graphs and diagrams, enabling a quick understanding of issues and opportunities. The returned statistics are divided into:
Overall Process Performances – Key performances: expressed at manufacturing system level (value added time, plant saturation, machine utilizations) or at workstation level (cycle time, lead time). Other statistics are related to product/process such as the product lead time, the number of products simulated and the average number of lots completed;
Criticality – Critical products: in bubble charts it is possible to match every simulated product volume with costs and lead times;
Criticality – Critical elements: the section contains a series of histograms for queuing times and saturation by workstation together with the average WIP and order fulfilment time by product;
Comparisons: an easy way to compare the key performances against other scenarios already saved.
5.2 Alternative scenarios
What if scenarios have been played by the user, observing high-level impacts on the key performances? In particular four alternative scenarios have been tested. Unaltered parameters can be reused from the as-is configuration.
Finally,
The scenarios can be evaluated by comparing a few key performance indicators at plant level (see Table 8 – simulation run 300 working days).
Comparing scenarios: key performance indicators at factory level.
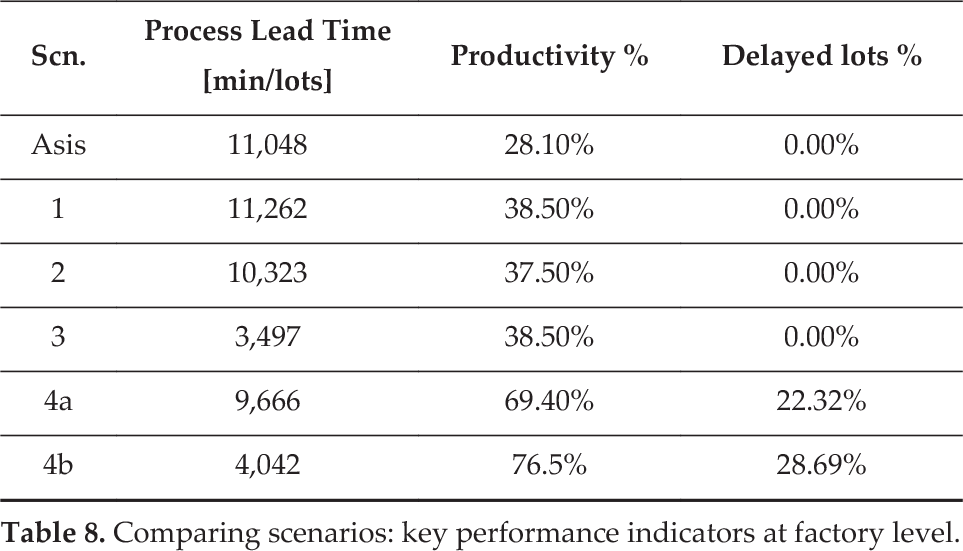
Even if absolute value would be reviewed, the model is able to return comparable statistics in order to support the strategic decision-making process.
6. Conclusion
The current use of advanced simulation tools is limited by the cost, time and knowledge needed to build models, validate results and perform what-if analyses. DES models are generally flexible enough to be applied to a wide range of manufacturing and distribution processes. This paper shows how to give accessibility to an advanced, flexible DES tool, giving to any company the possibility to use it without having any experience of simulation languages. In this way, even SMEs can be further supported in taking strategic decisions.
The model and the entire workflow as it is has been successfully applied not only to the SME case described in this paper, but also to another jobshop of a SME producer of iron tools and to an assembly line of a large company producing washing machines.
The solution proposed can be enhanced further. As it is the first release of the software, further development would be provided by:
facilitating data gathering by interfacing the data warehouses and the configuration window (RCT);
adding complexity to the template, including additional manufacturing cases as material supply logics, priority rules, operator skills;
refining the simulation of customer demand;
adding the possibility of simulating a production schedule or production scheduling intelligence.
Footnotes
7. Acknowledgements
The authors acknowledge the support of the European Commission through the 7th Framework Programme under NMP-2008-3.4–1 Rapid Design and Virtual Prototyping of Factories (COPERNICO: contract number 229025–2).