
Abstract
Hysteresis of piezoelectric actuators is rate-dependent at high frequencies, but most of the hysteresis models are rate-independent and cannot describe the rate-dependent hysteresis nonlinearity independently. In this paper, a modified Prandtl-Ishlinskii (P-I) model is proposed to characterize the rate-dependent hysteresis of piezoelectric actuators under sinusoidal excitation. This model is formulated by a mth-power velocity damping model in conjunction with the rate-independent P-I model. The parameter identification of this model is divided into two steps using different experimental data and algorithms. The particle swarm optimization is introduced first to identify the rate-independent parameters, and the nonlinear least square method is adopted afterwards to identify the rate-dependent parameters which are functions of the excitation frequency. Moreover, the proposed P-I model is developed to describe hysteresis nonlinearity under triangular excitation by introducing weighted functions, i.e., Λ i . Finally, the model results attained under the sinusoidal and triangular inputs at different frequencies are compared with the corresponding experimental data. The comparisons demonstrate that the proposed P-I model can well describe hysteresis nonlinearity under sinusoidal excitation up to 1,500 Hz and triangular excitation up to 250 Hz, respectively.
Introduction
Piezoelectric actuators (PEAs) have been widely used in a variety of applications, such as atomic force microscopes [1], lithography [2] and micro-manipulation [3]. The advantages of piezoelectric actuators are quick response, large force, high positioning resolution, small size and small thermal expansion during actuation. However, the main drawback in the output displacement of the PEA is hysteresis nonlinearity, which can cause positioning inaccuracy and even lead to the instability of the closed system.
The direct solution to deal with the hysteresis effect is inverse compensation, aiming to cancel the hysteresis effect by constructing the inverse of a hysteresis model. A number of hysteresis models are available in the literature describing hysteresis nonlinearity, such as the Bouc-Wen model [4], the Dahl model [5], the Preisach model [6] and the P-I model [7–9]. Among these models, the Preisach model and its subclass P-I model are by far the most well-known and widely used phenomenological models. However, most of these models cannot describe the rate-dependent characteristic of the PEA.
In contrast to the rate-independent hysteresis model, the shape of the rate-dependent hysteresis loop varies with the input frequency. It was reported in the literature that the hysteresis effect can be modelled in series with the dynamics of the actuator, i.e., the output of the rate-independent hysteresis model is the input of the dynamic model [10]. Instead of separately modelling the two interacting dynamic effects, some researchers treated their combined effect phenomenologically and proposed the modified rate-dependent hysteresis model to account for hysteresis nonlinearity at varying actuation frequencies. Mayergoyz [11] proposed a rate-dependent Preisach model by employing output rate-dependent density functions. Bertotti [12] proposed a dynamic generalization of the scalar Preisach model by assuming the input rate-dependent behavior of delayed relays. By introducing the dependence of the Preisach function on the input variation rate, Yu et al. [13] developed a new dynamic Preisach model. Mrad and Hu [14] presented a dynamic Preisach hysteresis model to describe hysteresis nonlinearity of piezoceramic actuators up to 800 Hz by adopting an average input rate-dependent density function. Xiao and Li [15] characterized hysteresis nonlinearity in the 0–300 Hz frequency range by a modified Preisach model which featuring the weighted sum of density functions.
The modifications mentioned above generally focus on the Preisach model by including the speed of the input in the density functions. It should be noted that as a subset of the Preisach model, the P-I model is simpler and its inverse can be computed analytically, making it more attractive for real-time applications [7]. However, as far as we know, there are only a few studies focusing on the rate-dependent P-I modelling. Ang et al. [16] and Tan et al. [17] observed in their tests that the slope of the measured hysteresis loop of a piezoelectric actuator varied almost linearly with the input rate. Thus, they modelled the rate-dependence by linearly varying the weights of the backlash operators according to the input rate. However, in this way, the actuation frequency is limited in the low range, such as 40 Hz. By introducing a dynamic threshold in the play operator, a rate-dependent P-I model [18] is proposed to describe rate-dependent hysteresis up to 500 Hz. However, the dynamic threshold has a complex format with many parameters, making the rate-dependent P-I model hard to adjust and implement. As an alternative, a dynamic threshold with a simple format is utilized in [19–21] to develop a new rate-dependent P-I model, which has a relatively simple format with fewer parameters and the analytical form of an inverse. However, the accuracy of this model will deteriorate when the frequency increases.
In this paper, a mth-power velocity damping model is proposed, which is in conjunction with the rate-independent P-I model to formulate a modified P-I model for the description of rate-dependent hysteresis. The parameter identification is divided into two steps using different experimental data and algorithms. The rate-independent parameters are identified by the particle swarm optimization, and the rate-dependent parameters are identified by the nonlinear least square method, and then can be fitted to the frequency by the polynomials. It should be noted that this combined P-I model is restricted to the sinusoidal inputs. In order to characterize the hysteresis under triangular excitation, the modified P-I model is developed with weighted functions. The validity of the proposed P-I model is demonstrated by experiments under both sinusoidal and triangular inputs over a wide range of frequencies. The contributions of this work are threefold:
Distinct from the works [16–21], the modified P-I model proposed for rate-dependent hysteresis in this work is constructed by a rate-independent P-I model in conjunction with a mth-power velocity damping model.
The proposed P-I model can describe hysteresis nonlinearity well under sinusoidal excitation up to 1,500 Hz, while the actuation frequencies in the previous studies are all below 800 Hz.
By introducing the weighted functions Λ i , we develop a new modified P-I model to precisely describe the hysteresis behavior under triangular excitation up to 250 Hz.
The remainder of this paper is organized as follows. Section 2 describes the experimental setup and hysteresis test. Section 3 introduces the rate-independent P-I model and its parameter identification. The modified P-I model for the description of rate-dependent hysteresis is proposed in Section 4. Section 5 demonstrates the effectiveness of the proposed hysteresis model under sinusoidal and triangular inputs, and Section 6 draws conclusions.
Experimental setup and hysteresis test
Experimental setup
The experimental platform is shown in Figure 1(a). A prototype of the XY stage [22] is fabricated using the wire electrical discharge machining (WEDM) technique with aluminium 7075. The two pre-selected PZTs are mounted to drive the stage, and a dual-channel high-voltage amplifier (HVA) with a fixed gain of 20 (a bandwidth of 10 kHz) is used to provide excitation voltage (0–200 V) for the PZTs. Two capacitive sensors (Probe 2823 and Gauging Module 8810 from MicroSense, range of + / – 10 μm with an analogue output of + / – 10 V and bandwidth of 10 kHz) are adopted to measure the displacements of the end-effector along the X- and Y-axes. A dSPACE-DS1103 board equipped with 16-bit analogue-to-digital converters (ADCs) is utilized to output the excitation voltage for the HVA and capture the real-time displacement information from the capacitive sensors. The block diagram of the whole experimental setup is shown in Figure 1(b).

The experimental setup: (a) experimental platform; (b) block diagram
To study the rate-dependent property of the PZT, a series of sinusoidal input signals with fixed amplitude (50 V) and increased frequencies (in the range of 10–1,500 Hz) are applied to the PZT through dSPACE and the voltage amplifier. The relationship between the input voltage and output displacement can be seen in Figure 2. It demonstrates that an increase in the frequency of the input voltage not only yields greater width of the hysteresis loop, but also reduces the peak-to-peak output displacement of the PZT, which has been illustrated in a few reported studies [18]. Furthermore, the hysteresis loops under a fixed frequency and increasing amplitudes are illustrated in Figure 3. It is obvious that the hysteresis effect is also amplitude-dependent. It should be clarified that, in this work, we mainly focus on frequency-dependent hysteresis behaviors. The hysteresis curves with both major and minor loops are not addressed in the remainder of this paper.
Rate-independent Prandtl-Ishlinskii model
The P-I model is widely used to describe hysteresis nonlinearity due to its reduced complexity and the analytical form of the inversion. Mathematically, the classical P-I model can be written as [7]:

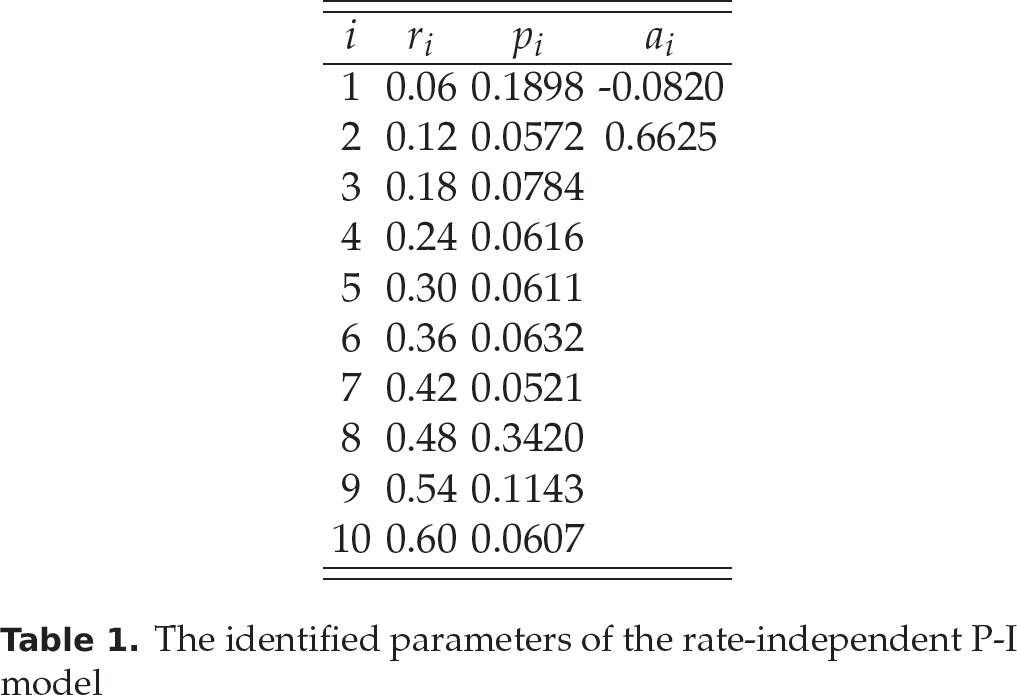
The identified parameters of the rate-independent P-I model
where υ(t) and y(t) are the control input and output displacement, respectively, a is a positive value and p(r) is the density function. Since the density function p(r) generally vanishes for large values of r, the choice of R = ∞ as the upper limit of integration is widely used in the literature for the sake of convenience. Fr[υ](t) is the one-side play operator, which is defined as:

where r is the input threshold of the play operator and T is the sampling period.
Considering the fact that the classical P-I model is developed for the description of symmetric hysteresis, an asymmetric P-I model was proposed in our previous work [8] to characterize the asymmetric hysteresis of piezoelectric actuators, which is defined as:

where g(υ(t)) = a1υ3(t) + a2υ(t) is a polynomial input function with constants a1 and a2, and p(r) and Fr[υ](t) are defined the same as those in the classical P-I model (1).
In order to be conveniently implemented, a discrete form of the model is given as follows:

where pi denotes the weighting value of the play operator with the fixed threshold value

Measured hysteresis loops at different sinusoidal frequencies

Measured hysteresis loops with different amplitudes at 100 Hz.
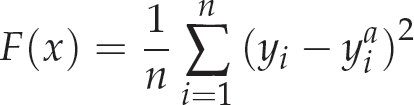
where n is the total number of the experimental data, yi and yia are the predicated data via the rate-independent asymmetric P-I model and the experimental data at the ith sampling time, respectively, and x = {p1, p2, …, pN, a1, a2} denotes the identified parameters, which are summarized in Table 1. In this work, the rate-independent P-I model uses the play operator of order 10 (N=10), and the 10 Hz sinusoidal signal is used as the rate-independent experimental data for the identification.
The P-I model mentioned above is just based on the rate-independent situation, but the real hysteresis problem is rate-dependent (as mentioned in Section 2.2). Therefore, some modifications of the rate-independent P-I model are necessary, which are discussed in Section 4.
Modified P-I model
Examination of the hysteresis loops in Figure 2 shows that hysteresis nonlinearity has a relationship with the input variant rate. Based on the observed variations in hysteresis behavior, a mth-power velocity damping model [24] is employed in this work to account for the rate-dependent effect, which is usually expressed as:
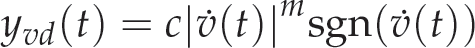
where c is the mth-power velocity damping coefficient and m is a positive constant. The function

Although the power m can take any positive value, some previous studies use the fixed integer value for the exponent m, and thus only the coefficient c is considered as the model parameter to be estimated. However, both the coefficient c and the power m will be estimated later in this work to improve the identified results.

The response characteristic of the mth power velocity damping model under the sinusoidal input with different frequencies
The dependence of the mth-power velocity damping model is investigated under the sinusoidal inputs with different frequencies (10, 100 and 500 Hz), while the parameters are selected as: c = 0.2,m = 1. Figure 4 illustrates the outputs of the proposed damping model. The results exhibit the increasing width of the hysteresis loops with an increase in the frequency of the input.
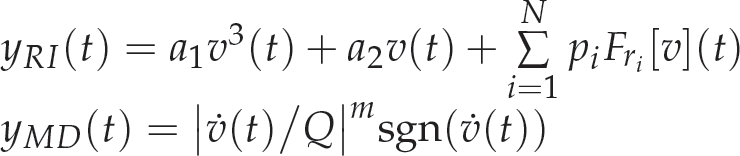
By incorporating the mth-power velocity damping model into the rate-independent P-I model, a modified P-I model for the description of rate-dependent hysteresis can be written as:

where yRI(t) is the rate-independent P-I model output stated previously in Eq. (4), k is a constant, and the term Q = 2πf A is employed to normalize

where:
When k is equal to one and c is equal to zero, the modified P-I model for rate-dependent description can be directly reduced to the rate-independent model.
The parameter identification of the modified P-I model is to identify the parameters p1, p2, …, pN, a1, a2, k, c, m. According to the type of experimental data used for identification, these parameters can be divided into two groups: the rate-independent parameters including p1, p2, …, pN, a1, a2 and the rate-dependent parameters including k, c, m. The rate-independent parameters are identified under a 10 Hz sinusoidal excitation, while the rate-dependent parameters are identified under a series of sinusoidal excitation in the 10-1,500 Hz frequency range. As the first group parameters have been identified in Section 3, we will focus on the identification of the second group parameters in this section.
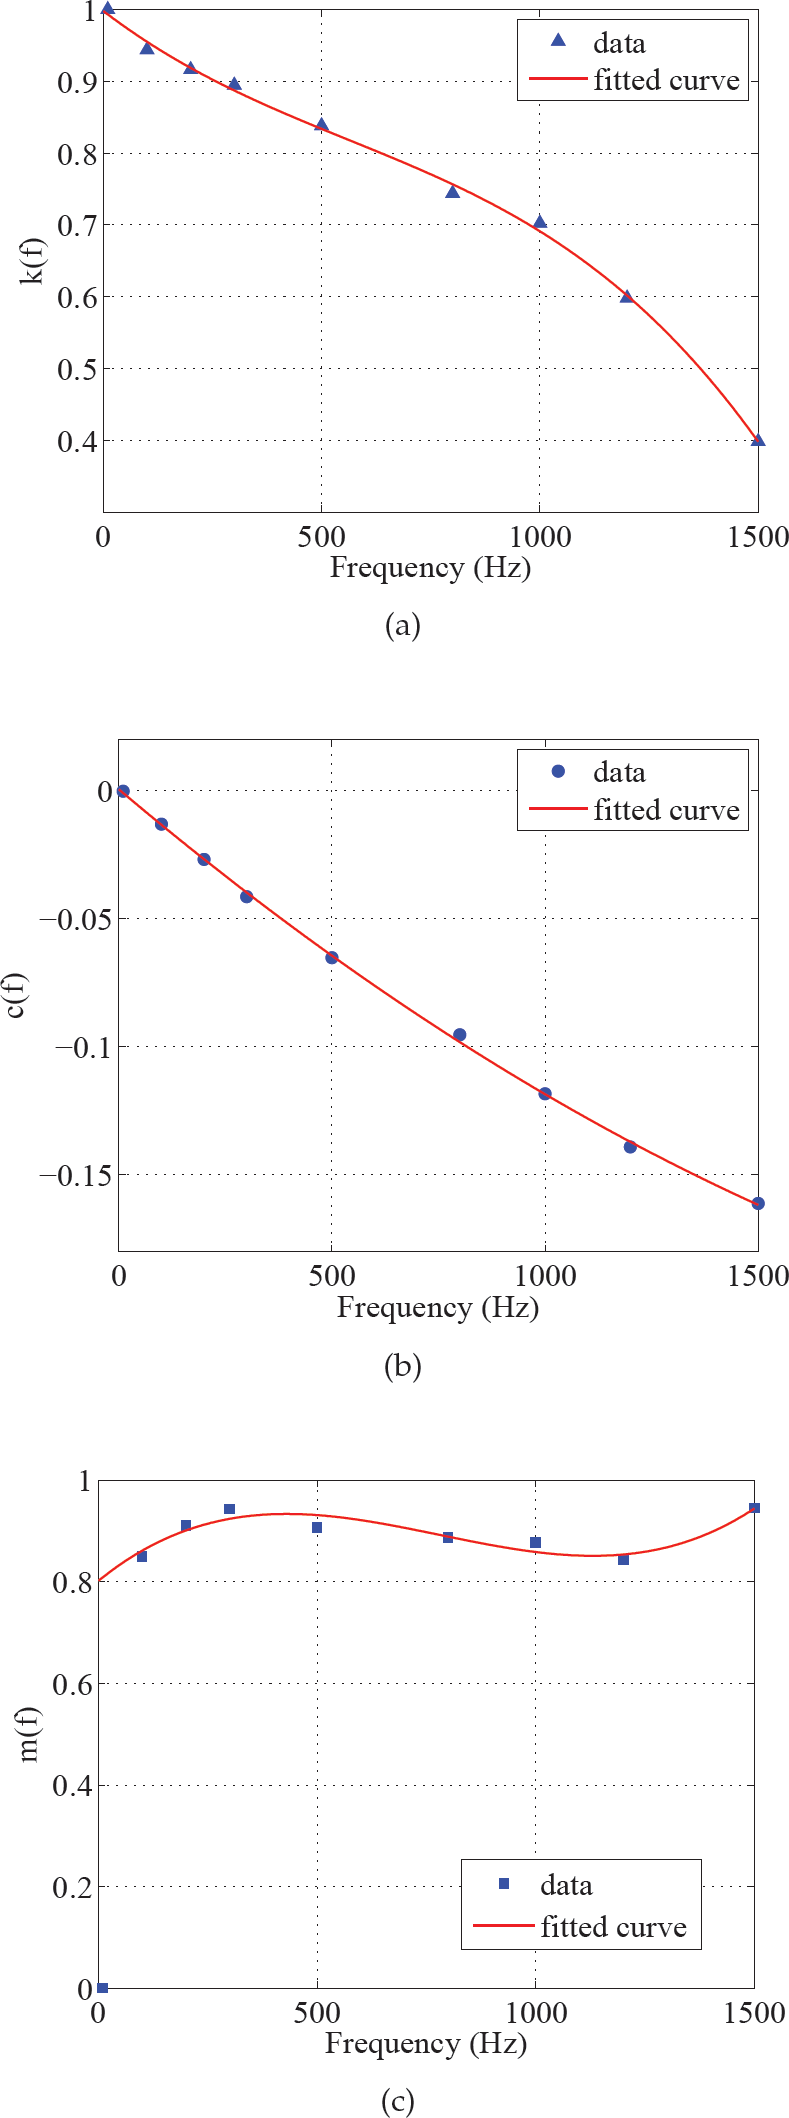
Parameters of the modified P-I model versus frequency from 10 Hz to 1,500 Hz and the corresponding fitting curves: (a) k(f); (b) c(f); (c) m(f)
The coefficients of parameters k(f), c(f), m(f)

A series of sinusoidal input signals with fixed amplitude (50 V) and increased frequencies (in the range of 10–1,500 Hz) are applied to the PZT, as shown in Figure 2. The input voltage υ(t) and output displacement ya(t) are used to identify the rate-dependent parameters, which can be considered in the form of x = {k, c, m}. Thus, Eq. 9 can be written in the form of (11):

The purpose is to find x via the nonlinear least square method for which the following criterion must be minimized:

The optimization problem can be implemented through the lsqnonlin function in the MATLAB optimization toolbox, and the parameters are plotted against the frequency in Figure 5. Figure 5 (a) and (b) show that the higher the frequency, the smaller that k will be, while the larger that |c| will be. The parameter m exhibits insignificant change against frequency, and thus it can be approximated by a constant 0.9 or fitted by a polynomial for better accuracy.
In this work, the three parameters are all approximated by a polynomial function with respect to the frequency using the curve-fitting toolbox in MATLAB. The identified parameters k, c, m are expressed as follows:

where f denotes the sinusoidal frequency and the coefficients are summarized in Table 2. Note that in Figure 5 (c) the point with a frequency equal to 10 Hz (m(f = 10Hz)) is omitted when fitting the curve, because the corresponding parameter c(f = 10Hz) is close to zero - in this case, the value of m is of no importance.
The modified P-I model mentioned in Section 4.1 is just based on a mono frequency sinusoidal input signal. When the excitation is not the sinusoidal input, such as the triangular wave which is widely used in atomic force microscopy, this model will lose efficacy. Therefore, some modifications of the P-I model mentioned above should be necessary for the triangular wave. Motivated by the Preisach model proposed in [15] which featured with the weighted sum of μ-density, we also employ the weighted functions in this work. As such, Eq. (9) is rewritten as:

where i and M denote the index and total number of harmonics, f0 is the fundamental frequency of the triangular wave, k(if0) and c(if0) are two rate-dependent parameters calculated from Eq. (13) and Λ i denotes the weight for the ith harmonic.
According to the Fourier series theory, the triangular wave can be combined by harmonically related sinusoidal signals. It can be described as:

where
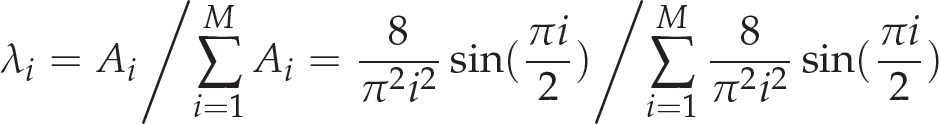
The frequency spectrum is plotted in Figure 6 for the triangular wave with a 100 Hz fundamental frequency (where B = 70, A = 50, M = 9), and the corresponding values of Λ i are also plotted in Figure 6. Based on these weights, the model output can be calculated according to Eq. (14).
After all the parameters of the modified P-I model are identified, some experiments are carried out to verify the effectiveness of the proposed hysteresis model. The first experiment is to investigate the performance of the modified P-I model under the sinusoidal signals with different frequencies. The hysteresis loops, estimated rms errors and maximum errors are measured and summarized. The second experiment is to investigate the performance of the proposed hysteresis model under the triangular wave with different frequencies.

The frequency spectrum for the triangular wave with a fundamental frequency of 100 Hz: (a) Ai; (b) Λ i

Measured responses (blue line) at 10, 400 and 1,200 Hz compared with those predicted from the (a)-(c) rate-independent P-I model [8], the (d)-(f) rate-dependent P-I model based on dynamic thresholds [19, 20], and the (g)-(i) proposed modified P-I model for the description of rate-dependent hysteresis

In the first experiment, the 100 V p-p sinusoids with frequencies in the range of 10–1,500 Hz are used to drive the piezo-stage, and the displacement responses are collected by the dSPACE system. Figure 7 shows the comparison of the measured hysteresis loops with those predicted from the modified P-I model under the sinusoidal input signals at 10, 400 and 1,200 Hz. The hysteresis loops predicted from the rate-independent P-I model [8] and the rate-dependent P-I model based on dynamic thresholds [19, 20] are also plotted in Figure 7 for comparison. The dynamic threshold function used in the rate-dependent P-I model [19, 20] is defined as:

Comparisons of the measured results and the predicted results from the modified P-I model under triangular input signals at different frequencies: (a) 100 Hz; (b) 250 Hz; (c) 500 Hz
A complete comparison of these three hysteresis models under sinusoidal excitation in the 10–1,500 Hz range is shown in Figure 8 in terms of the maximum error and the rms error, which are defined as:
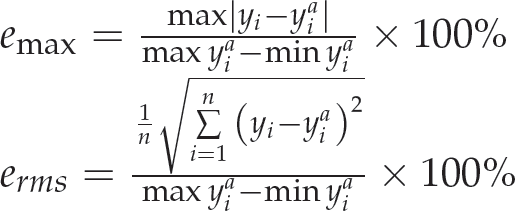
It can be clearly observed that the proposed modified P-I model significantly reduces the estimated errors in contrast to the other two hysteresis models. From Figure 8, we can see that the maximum error and the rms error of the rate-independent P-I model increase linearly with frequency. When the frequency increases to 300 Hz, the maximum error and the rms error increase to 11.1099% and 7.1648%, respectively. These large estimated errors indicate that the rate-independent P-I model cannot describe hysteresis nonlinearity well at high frequencies. The results also clearly show that the rate-dependent P-I model with the dynamic thresholds, as proposed in [19, 20], yields large errors at high excitation frequencies. The maximum error exceeds 37.7% at a 1,500 Hz excitation frequency, while the rms error approaches 15.3%. In contrast, the maximum error and the rms error of the proposed modified P-I model are limited to 6.5% and 3%, respectively, throughout the entire frequency band of 10–1,500 Hz. It is shown that the proposed modified P-I model can characterize the hysteresis behavior very well even at high frequencies.
In the second experiment, the 100 V p-p triangular waves with different fundamental frequencies are used to test the effectiveness of the proposed hysteresis model. The hysteresis loops, the displacement responses and the estimated errors are plotted in Figure 9. From Figure 9, it can be seen that the responses from the modified P-I model can match the measured responses very well at both 100 Hz and 250 Hz. The maximum errors of these two cases are 0.1110 μm and 0.1091 μm, which are 2.45% and 2.46% respectively. In addition, the maximum error at 500 Hz is up to 9.40%, showing that the proposed model cannot characterize hysteresis nonlinearity well under triangular excitation with too high frequency. As mentioned in Sec. 4.3, the triangular wave is composed of a ninth-order harmonic wave at the very least. Thus, the componential frequencies of the triangular wave with a 500 Hz fundamental frequency reach 4,500 Hz. This is higher than the sinusoidal frequencies in the parameter identification. Therefore, the modelling accuracy under triangular excitation with a 500 Hz fundamental frequency can be improved by increasing the sinusoidal frequencies in the parameter identification.
The mth-power velocity damping model and the rate-independent P-I model are formulated to derive a modified P-I model for predicting rate-dependent hysteresis nonlinearities. The parameters of this model are divided into rate-independent and rate-dependent parameters, which are identified by particle swarm optimization and the nonlinear least square method, respectively. The rate-dependent parameters are fitted by polynomials through the curve fitting toolbox of MATLAB. Comparisons of the model results with the measured data revealed very good agreement under sinusoidal inputs in the 10–1,500 Hz frequency range. However, this P-I model is restricted to the sinusoidal inputs. To characterize hysteresis nonlinearity under the triangular input signals, the proposed modified P-I model is combined with the weighted functions, i.e., Λ i . Comparisons of the model results with the measured data show that the modified P-I model with weighted functions can describe the hysteresis well under the triangular wave up to 250 Hz. The experimental results for both sinusoidal and triangular inputs demonstrate the effectiveness of the proposed modified P-I model for the description of rate-dependent hysteresis.
Acknowledgements
This work was supported by the National Natural Science Foundation of China under Grant Nos. 51405293 and 91023047, and the Specialized Research Fund for the Doctoral Programme of Higher Education under Grant No. 20130073110037.