
Abstract
Due to the emergence of e-commerce and the proliferation of liberal return policies, product returns have become daily routines for many companies. Considering the significant impact of product returns on the company's bottom line, a growing number of companies have attempted to streamline the reverse logistics process. Products are usually returned to initial collection points (ICPs) in small quantities and thus increase the unit shipping cost due to lack of freight discount opportunities. One way to address this issue is to aggregate the returned products into a larger shipment. However, such aggregation increases the holding time at the ICP, which in turn increases the inventory carrying costs. Considering this logistics dilemma, the main objectives of this research are to minimize the total cost by determining the optimal location and collection period of holding time of ICPs; determining the optimal location of a centralized return centre; transforming the nonlinear objective function of the proposed model formulation by Min et al. (2006a) into a linear form; and conducting a sensitivity analysis to the model solutions according to varying parameters such as shipping volume. Existing models and solution procedures are too complicated to solve real-world problems. Through a series of computational experiments, we discovered that the linearization model obtained the optimal solution at a fraction of the time used by the traditional nonlinear model and solution procedure, as well as the ability to handle up to 150 customers as compared to 30 in the conventional nonlinear model. As such, the proposed linear model is more suitable for actual industry applications than the existing models.
1. Introduction
Returned products come in all different sizes, shapes, and conditions. Many of them are received damaged, without original packages, and mixed up with other products. As such, returned products are more difficult and costly to handle than original products. Indeed, the logistics of handling returned products accounts for nearly 1% of the total U.S. gross domestic product (Gecker, 2007). To elaborate, a study conducted by the Reverse Logistics
Executive Council once reported that U.S. companies spent more than $35 billion annually on handling, transportation, and processing of returned products (Meyer, 1999). More recently, it was found that product returns cost businesses more than $100 billion a year and caused an average profit loss of 3.8% (Petersen and Kumar, 2010). This estimate does not even include the expenditure associated with disposition, redistribution, administration, and transformation of returned products with limited commercial value into productive assets. In addition, other hidden costs may be incurred from compliance with the Sarbanes-Oxley Act for returned inventory reporting, the risk of returned products ending up in the grey market, and customer credit reconciliation. In 2011 alone, for example, product returns cost U.S. consumer electronics retailers and manufacturers nearly $17 billion: an increase of 21% since 2007. Product return rates over the past three to five years have increased by 57% and 43%, according to retailers and manufacturers, respectively, as surveyed by Accenture (Baig, 2011). Unfortunately a high rate of product returns is not confined to the manufacturing and retail industry: across the various industries, Norman and Sumner (2006) reported that the total U.S. revenue impacted by product returns is estimated between $52 billion and $104 billion. As shown in Table 1, some industries in which return rates are nominal can still suffer significantly from poor management of returned products.
The Impact of Product Returns on Industry-Wide Revenue

Despite increasing attempts to reduce return rates, product returns have become a necessary evil. In general, product returns stem from two phenomena: (1) consumer returns of products to the retailer due to defects, damages during transit, product recalls, impulse purchases, and inaccurate order fulfilments; and (2) supplier returns of overstocked or unsold items to the manufacturer as part of the ‘buyback’ policy. Regardless of product type, reverse logistics involving product returns presents different types of logistical challenges. Products are usually returned to ICPs in small quantities and thus increasing the unit shipping cost due to lack of freight discount opportunities. One way to address this issue is to aggregate the returned products into a larger shipment. However, such aggregation increases the holding time at the ICP, which in turn increases the inventory carrying costs. Considering this logistics dilemma, the main objectives of this research are to: (1) minimize the total cost by determining the optimal location of ICPs and direct customers to designated ICPs; determining the optimal collection period of holding time at the ICP; and determining the optimal location of a centralized return centre (CRC); and then (2) to transform the nonlinear objective function of the proposed model formulation into a linear form that significantly eases the computational complexity; and (3) conduct a sensitivity analysis to the model solutions according to varying parameters such as shipping volume.
2. Literature Review
Reflecting the growing worldwide attention to eco-efficient supply chain management, there exists abundant literature dealing with various kinds of reverse logistics problems (see, e.g., Fleischmann et al., 2000; Fleischmann, 2003; Mead et al., 2007; Srisvastava, 2007; Chanintrakul et al., 2009; Pochampally et al., 2009; Pokharel and Mutha, 2009; Min and Kim, 2012). Generally speaking, reverse logistics is concerned with distribution activities involving product returns, source reduction/conservation, recycling, substitution, reuse, disposal, refurbishment, repair, and remanufacturing (e.g., Stock, 1992; Guide et al., 2003; Van Wassenhove and Guide, 2003; Min et al., 2006a). Some of the earlier pioneering studies on reverse logistics include Min (1989), Geoffrion and Graves (1974), Melachrinoudis et al. (1995), and Del Castillo and Cochran (1996).
To elaborate, Min (1989) developed a multiple objective mixed integer program (MIP) designed to select the most desirable shipping options (direct versus consolidated) and transportation modes for reverse logistics involving recalled products. Although he considered a trade-off between transportation time and cost associated with reverse logistics, his model did not take into account inventory carrying costs. Geoffrion and Graves (1974) developed, implemented, and successfully applied a solution technique to a real problem for a major food firm based on Benders' decomposition. Considering a multiple planning horizon, Melachrinoudis et al. (1995) developed a multiple objective integer program for the dynamic location of capacitated sanitary landfills. Following suit, Jayaraman et al. (2003) presented a MIP to solve the two-level hierarchical location problem involving the reverse logistics operations of hazardous products. They also developed heuristic concentration procedures combined with heuristic expansion components to handle relatively large problems with up to 40 collection sites and 30 refurbishment sites. Schultmann et al. (2003) combined a two-stage location model with a simulation model for planning a reverse-supply network involving the recycling of spent batteries in the steelmaking industry. Despite their success in solving practical reverse logistics problems, none of these prior studies dealt with the possibility of making trade-offs between freight rate discounts and inventory cost savings resulting from consolidation of returned products.
More recently, Zaarour et al. (2014) developed a mathematical model that analysed both discrete and continuous cases of collection periods for product returns in the sustainable supply chain. Min et al. (2006a, b) presented a nonlinear integer program for solving the multi-echelon reverse logistics problem involving product returns. To overcome inherent computational complexity involved in the non-linear program structure, they utilized genetic algorithm (GA). Their contributions include the consideration of freight consolidation possibilities across geographical areas and holding time. In particular they explored a possibility that returned products would be aggregated at the ICPs and then held up for a few days for freight consolidation before those returned products would be trans-shipped from the ICPs to the CRCs for asset recovery, remanufacturing or disposal. Their models and solution procedures were designed to determine the optimal locations of ICPs and CRCs from sets of candidate locations, the optimal collection period at the ICPs, and the most desirable shipping volumes from the ICPs to the CRCs. Srivastava (2008) further conceptualized a product return process within the reverse logistics network consisting of collection centres and two types of rework facilities set up by original equipment manufacturers (OEMs) or their consortia for a few categories of product returns under various strategic, operational and customer service constraints. Tan and Kumar (2008) approached a reverse logistics model from a profit-maximization perspective rather than a typical cost-minimization perspective. Min et al. (2008) employed an MIP and GA to solve the reverse logistics problem involving the consolidation of product returns in e-commerce environments. Chandiran and Rao (2008), and Kannan et al. (2009) went a step further from these prior studies by considering a two-way flow coordination/integration of both forward and reverse logistics activities. Also, Du and Evans (2008) considered two conflicting objectives of reverse logistics: costs and tardiness of cycle time. In addition, Chang et al. (2011) proposed routing strategies that optimally integrate forward distribution and reverse collection to help logistics service providers reduce their operating costs when providing transportation services.
Given a lack of effort in combining the location-routing problem with the balanced allocation problem in the closed-loop supply chain network, Sheriff et al. (2013) proposed a paper to include the simultaneous consideration of location, allocation, and routing decisions.
However, these prior studies assumed away the stochastic nature of customer demands and product returns, despite the fact that product returns were often characterized by considerable uncertainty on their timing and quantity (de Brito and van der Laan, 2009). To handle the uncertain and random nature of returned products, Zhou and Min (2011) developed a stochastic reverse logistics model that could determine the number and location of CRCs where unknown quantities of returned products from retailers or end-customers were collected for manufacturers' or distributors' repair facilities. As summarized above, a majority of existing reverse logistics models have, thus far, focused on only the product recovery, recycling, and reuse opportunities of the reverse logistics network for used products which have ended their life cycles, while neglecting various consolidation and channel selection decisions for returned products that may help the eco-efficiency of the closed-loop supply chain (Mead et al., 2007; Srisvastava, 2007; Chanintrakul et al., 2009; Pochampally, 2009; Pokharel and Mutha, 2009). Also, none of these prior studies examined the dynamic interplay between shipping volume (i.e., return rates) and the collection period for returned products. To overcome the aforementioned shortcomings of these prior studies, this linearization allowed us to optimally solve a large reverse logistics network problem that has not been solved efficiently by the existing models and approximation solution procedures. In particular, to better reflect reality, the proposed model was designed to consider both capacity restrictions and service requirements, while taking into account different types of costs, including facility establishment/maintenance costs, inventory carrying costs, handling costs, and shipping costs with potential freight discount opportunities. Furthermore, this paper performs sensitivity analyses by varying product return rates, and then assesses their impacts on multiple collection periods and total reverse logistics costs.
Thus, the paper develops a model under a special structure that allows the decision maker to make the optimal trade-off between inventory carrying and shipping costs. In an effort to improve the chance of industrial applications, the linearization of the nonlinear-MIP—commonly employed by the previous studies—enables an increase in the geographical service areas and shipping volumes between the ICPs and the CRCs.
3. Model Design
Prior to developing a model that built upon the nonlinear-MIP proposed by Min et al. (2006a) and transforming it into a linear form with the expanded variables and constraints, we made the following assumptions: (1) the possibility of direct shipment from customers to a centralized return centre is ruled out due to a small volume of individualized returns; (2) the transportation cost between customers and their ICPs is negligible given the short distances between the two parties; (3) the location/allocation plan covers a planning horizon in which customer demand patterns and transportation infrastructure remain stable without dramatic changes; (4) an ICP has adequate capacity to hold returned products during the collection period; (5) all customer locations are known and fixed a priori.
The rest of the paper is designed as follows: section 3 presents the linearization of the objective function, the model experiments and the computational results, and section 4 deals with the concluding remarks and proposed future research to handle potential limitations.
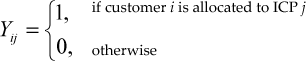
i = index for customers; i ∈ I
j = index for ICPs; j ∈ J
k = index for centralized return centres; k ∈K
X jk = volume of products returned from ICP j to centralized return centre k

T = length of a collection period (in days) at each ICP

otherwise
aj = annual cost of renting ICP j
b = daily inventory carrying cost per unit
w = annual working days
ri = volume of products returned by customer i per day
hj = handling cost of unit product at ICP j
ck = annual cost of establishing and maintaining centralized return centre k
mk = maximum processing capacity of centralized return centre k in new returns per day
dij = distance from customer i to ICP j
djk = distance from collection point j to centralized return centre k
l = maximum allowable distance from a given customer to an ICP
T̅ = maximum length of a collection period (in days) at an ICP. This upper bound on the length of collection days is necessary to assure that return lead time is not too long for the customers
where E is the standard freight rate ($/unit), αjk is the freight discount rate according to the volume of shipment between ICP j and centralized return centre k, and βjk is the penalty rate assessed for the distance between ICP j and centralized return centre k.
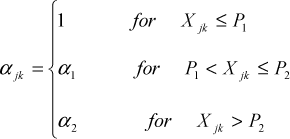

Figure 1 shows how much we are benefitting from the economies of scale (i.e., freight discounts) and/or penalized due to distance for a certain shipment X jk between ICP j and CRC k that are d jk distance away. Although only two price (freight rate) breakpoints are specified for consolidated shipment (P1 and P2) and distance (Q1 and Q2), any number of breakpoints can be accommodated by the proposed model, which can mimic class (freight) rates in practice.
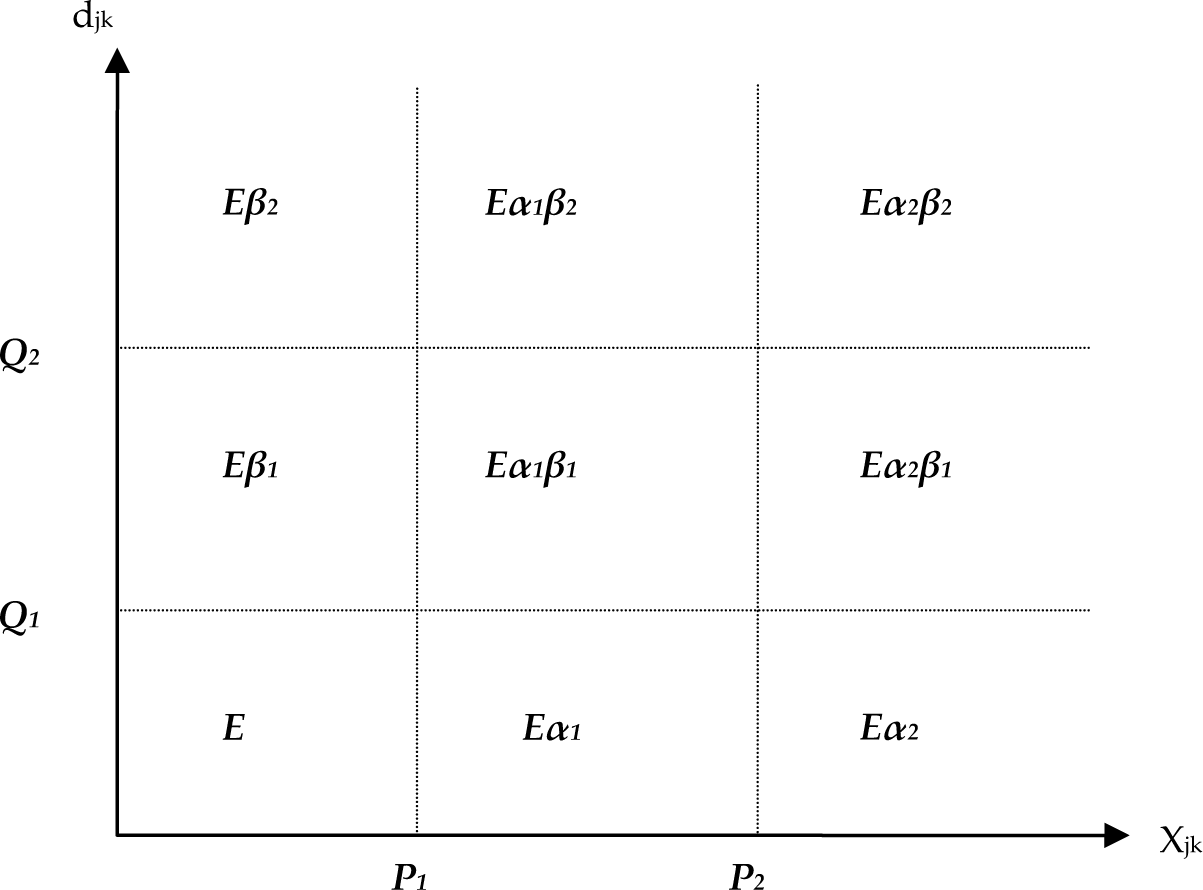
Unit transportation cost function
Minimize

Subject to
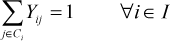

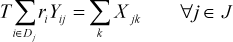


The objective function (1) minimizes the total reverse logistics costs, which comprise five annual cost components: the cost of renting the ICPs, the cost of establishing and maintaining the CRCs, the handling costs at the ICPs, the inventory carrying cost, and the transportation cost. Constraint (2) assures that a customer is assigned to a single ICP. Constraint (3) prevents any return flows from customers to be collected at a closed ICP (M is an arbitrarily set big number). Constraint (4) makes the incoming flow equal to the outgoing flow at each ICP. Constraint (5) ensures that the total volume of products shipped from ICPs to a centralized return centre does not exceed the maximum capacity of the centralized return centre. Constraint (6) preserves the non-negativity of decision variables X jk . Constraint sets (7)–(9) declare decision variables Y ij, Z j and G k as binary.
3.1 Linearization of the objective function
The non-linearity of the summation term
For any given (j,k) pair, β jk can be easily determined by the known value of d jk . Parameter α jk, however, depends on the value of decision variable X jk and therefore cannot be determined in advance. We use the following transformation to linearize the term

and

where W1
jk
and W2
jk
are binary variables and M is a big number. Accordingly, when W1
jk
= W2
jk
= 0, then Xjk = U1
jk
≤ P1 is in the first range; when W1
jk
and W2
jk
= 0, then U1
jk
= P1, U2
jk
≤ P2 - P1, U3
jk
= 0 and Xjk is in the second range. Finally, when both W1
jk
and W2
jk
take the value of 1, then Xjk is in the third range (See Figure 2). The term

where

Transportation cost function
According to (10) and (11), each continuous variable Xjk is replaced by
3.2 Model experiments and computational results
For comparative purposes, we used the same problem solved by Min et al. (2006a), although their model was designed to solve simpler reverse logistics problems than our proposed model. The problem consisted of 30 customers, ten ICP locations, and five centralized return centre locations. The input data are recapitulated in Table 3.
Parameter values for an example problem

Cost breakdown results of models using the data given in Table 3

We used the modelling language and optimizer LINGO Version 14 (2013) to solve our model. The average computational time it took LINGO to solve the example problem with 30 customers, ten ICP sites, and five CRC sites was 12 seconds. Table 4 compares our results to those obtained by the nonlinear MIP model developed by Min et al. (2006a) along with the results obtained by a naïve greedy approach using AutoCAD (by assigning each customer to its closest ICP and each ICP to the closest CRC site). Our results show an improvement of almost 10% over the nonlinear MIP model. At the additional $200 cost of opening one more ICP, our MIP model yielded both inventory and transportation cost savings at the combined amount of $20,745 over the nonlinear MIP model. This discrepancy can be explained by the fact that the MIP model is solved for the exact optimal solution, while the nonlinear MIP model is solved by an approximate algorithm for a local optimum. Due to such a significant cost-saving opportunity made possible by the proposed model, this model can encourage companies to better exploit reverse logistics situations with more complexity and on a greater scale.
Looking at the breakdown of the different costs, the linear model managed to minimize the total cost by lowering the total annual cost of renting ICPs through renting fewer of them, lowering the total inventory costs, and lowering the total transportation costs. The total annual reverse logistics costs showed an improvement of almost 10%. To check the ability of the proposed linearized model to solve large problems and to find a relationship between the optimal collection period T and the parameters of the model, we broadened the scope of the work by increasing the geographical service area to 100 by 100 miles. We then tested the model on three different problem sizes with 50, 100 and 150 customers. For each customer group size we ran ten replications, where the geographical locations of the customers, ICPs and centralized return centres were randomly generated every time. The daily return rates for the customers were also randomly generated within a range [0, 20]. The number of ICPs and CRCs remained unchanged at ten and five, respectively.
Starting with 50 customers, the results summarized in Table 5 show that the optimal collection period T obtained was four days in one instance, three days in eight instances, and two days in one instance. Next, for each replication, we added 50 customers to the existing data and re-ran the model. We did this one more time by adding another 50 customers to each replication. We noticed that by increasing the number of customers from 50 to 100, and then to 150, the optimal collection period stays as it is, or moves to a lower value in a similar fashion (see columns of Table 5).
Behaviour of T as the number of customers increases

As the number of customers is increased the daily return rate also increases, and therefore the volume of products returned from the ICPs to the CRCs increases. This means that the full effect of the economies of scale operates right from the beginning. On the other hand, computational results indicate that the optimal collection period increases as the daily return rate decreases and/or the breakpoints for freight (shipping) discount increase (P1 and P2).
4. Concluding Remarks
Despite being a common occurrence, product returns should not be viewed as a bitter pill to swallow but as a company's core ‘value-adding’ activity in terms of their profit potential. With this in mind, we developed a new mathematical model that can help companies to minimize the waste of returned products while reducing the costs of collecting, consolidating, and trans-shipping returned products. Furthermore, to demonstrate the robustness of the proposed model, we conducted a series of sensitivity analyses according to varying product volumes and collection periods. Furthermore, to increase the chance of actual industrial applications, we succeeded in transforming the complex non-linear form of the model into a simpler linear form. This linearization allowed us to optimally solve a large reverse logistics network problem that has not been solved efficiently by existing models and approximation solution procedures. In particular, to better reflect reality, the proposed model was designed to consider both capacity restrictions and service requirements, while taking into account different types of costs including facility establishment/maintenance costs, inventory carrying costs, handling costs, and shipping costs with potential freight discount opportunities.
To elaborate, this paper makes both practical and theoretical contributions to the closed-loop supply chain literature. Given the growing tendency of customers to return products due to more lenient return policies and more frequent online purchases, the handling of product returns has become more challenging than ever before. Thus, the proposed model was designed to cope with the various challenges of product returns. In particular, the model can be applied to practical reverse logistics problems involving the returns of various consumer products including apparel, home appliances, mobile devices, copiers, compact discs, and computer peripherals. From a theoretical standpoint, the proposed model was proven to be efficient in determining a functional relationship between the product return rate and the optimal collection period. It also helps to find the minimum cost solution for typical reverse logistics situations where multiple customers return their products to multiple ICPs during different periods and then these returned products are trans-shipped to multiple CRCs. Herein, multiple customers were divided into clusters where each cluster was within the market segment (territory) covered by a single ICP. In addition, the linearization of the model eased computational complexity and thus enabled us to find the optimal solution for larger customer bases, while handling the problem with broader geographical service areas and varying shipping volumes between the ICP and the CRC, and predicting where and when the optimal solution would occur.
Future research is proposed to deal with both deterministic and probabilistic models and to be able to provide solution algorithms to both cases. In addition, further sensitivity analysis will be required to handle bigger geographical areas and a larger number of customers, ICPs and centralized return centres. To handle these and other challenges related to inventory and transportation costs, an attempt to collect real data is underway to test the validity of the model proposed.