
Abstract
Information management is essential in construction projects. Existing research has identified and discussed problems in communication and information transfer among different stakeholders, such as the loss of information caused by fragmentation and information islands. However, there are few statistics about the direct time waste caused by information loss arising from poor communication and information management. Existing surveys relying on self-reporting questionnaires and interviews often contain various biases. This paper presents a direct observation of two construction sites in China in relation to wasted time and the information flows in these time-wasting events. Analysis of the observation data provides objective and comprehensive statistics on time wasted due to inconsistent information, dislocation and ambiguity. This research also analyses the correlation between participants, information carriers, information loss and the amount of time wasted. Finally, the wasting of time is analysed from the perspective of information flows and problems that cannot be addressed by information technologies are discussed.
1. Introduction
The construction industry has been characterized as showing low productivity and low efficiency. Ballard [1] discovered that over 50% of site work had not been finished on time according to weekly plans. Buildings are constructed by distributed participants with different or even conflicting interests and each participant has several personnel onsite. A typical onsite organization involves the owner, one or several designers, more than one contractor and subcontractor, several consultants, several suppliers and government administrators.
Thus, construction requires close collaboration of all personnel from different participating bodies. Large quantities of information are transferred onsite in various forms to facilitate construction. The failure to communicate effectively has a negative influence on the productivity and efficiency of the projects [2, 3]. Howard et al. [2] examined fragmentation in the construction industry both vertically and horizontally and argued that this fragmentation of information between different participants in projects was a barrier to productivity enhancement. Sometimes the information loss is obvious in the creation of information; sometimes the information loss on a construction site is hidden in the analysis and use of information. Additionally, inefficient collaboration among participants has been identified as part of the reason for frequent overrunning in terms of time and cost [4]. The consequences of information loss can be found in various incompetent construction performances, such as cost and schedule overruns, quality defects and safety issues.
Information is considered as one of the seven important flows on site, the others being people, materials, equipment, space, previous work and external environment [5]. Gurley and McManus [6] pointed out that with detailed and reliable information transfer, construction waste was expected to be significantly reduced. Furthermore, the innovative research by Tribelsky and Sacks [7] developed a series of indices that measured the information flow among designers at the detailed design stage, including action rate, package size, work in progress, batch size, development velocity, bottleneck indicator and rework. These indices successfully made the information flow measureable; they also used these indices to confirm the correlation of the stability of information flow and the satisfaction and overall efficiency of design [8]. The research on information flow also reveals how the inefficient transfer of information negatively influences construction productivity. Nielsen and Sayar [9] paid special attention to the information flow between site and head office and found that huge amounts of time were wasted in this process. Another study examined the productivity of construction sites in Alberta and found that inadequate communication and unavailability of required information were the two major reasons for extended completion times [10].
A huge amount of effort has been spent improving information management in the construction industry. The Annual Working Commission 78 of the International Council for Innovation and Research in Construction is dedicated to the reporting and exchanging data on the development of information technology as applied in the construction industry for the benefit of researchers all over the world [11]. Froese [12] divided the development of information technology in construction into three stages: the stage using single tools to assist specific work tasks, the stage using computers for supported communications and the stage integrating all applications as a cohesive, overall system. He argued that the technology in the first stage is mature, the technology in the second stage is still developing and being adapted, while technologies in the third stage have not been widely applied [12]. The project information portal, which is a widespread application in the second stage, was reported to save as much as 30%-60% of communication time, as well as reducing the time of the whole construction cycle by 5%, and the total project cost by 5% [13]. Research in 2001 by Nielsen and Sayar [9] proposed a Web-based information flow model to describe the general flow in the construction process; they considered this as one possible application of a collaboration platform for information technology usage. A critical review also analysed 83 papers published in reputable academic journals in construction management between 2000 and 2009. The review discussed the information technology that supported collaborative work both in design and project management, as well as the information systems for integrated inter-organizational management [14]. Dawood and Akinsola [3] developed a system to improve the information exchange in project teams, especially the exchange and management of site documents. They found that the system showed a saving of more than 90% in man hours. Since schedule management is the centre of project management [6], many researchers chose improvements in time and schedule issues to illustrate the advantages of information technologies and other advanced information management techniques.
The information flow on construction sites is different from the flow in the design stage. Firstly, the information on site is transferred between different parties with their own interests or even conflicting interests; secondly, the information is not only in the form of drawings but also in the form of spoken language; thirdly, the information management system is not widely used on site compared to the design stage, especially for craftsmen, only 5% of whom were reported to be using information technology on a daily basis [15]. There are still many problems in information transfer and communication between project participants. As Xue and Shen [14] point out, internet-based information management does not fully solve the problem because processes are not standardised and true electronic collaboration may not be in use. While many researchers have reported good results and quantitative improvements when information technology was applied on actual construction sites, there is a lack of research on the information loss during the construction stage, especially on construction sites in China, which is undergoing huge development all over the country. Furthermore, research data were usually collected in satisfaction surveys and the collection of data on efficiency improvements was not described in detail. As a result, although researchers are well aware of the huge amount of information loss and its negative effect on productivity, there is no reliable research on what and how much information is lost on actual construction sites.
The aim of this research is to analyse how information is lost on construction sites. The information loss is identified and measured by analysing wasted time in construction processes. The results are assumed to have both industrial and research benefits. Data for time-wasting events on construction sites were collected by the method of observation. They were examined by text analysis to explore the cause of time wasting, identify information loss and analyse how information was lost and how time was wasted. Finally, this research discussed the problems that cannot be addressed by information technologies or by the eighth flow in the lean construction paradigm. The observations and qualitative analysis are believed to potentially benefit future research on information technology applied on construction sites to boost productivity.
2. Research methods
2.1 Observations vs. questionnaire
The information flow plays a vital role in facilitating the construction process. The research on information loss requires a large quantity of objective data to analyse the flow of information and any defects in the flow. Construction sites are very complex, with many participants and factors involved in the process that can fail for various reasons. Therefore, extensive analysis is required to identify root causes of waste, which requires detailed records about the events. Furthermore, these records have to be correct and accurate: inauthentic data can lead to biased conclusions and deviations can lead to misunderstandings.
However, self-reporting questionnaires and surveys are the most widely used methods in construction research. For example, according to a recent review of research methodologies in construction safety management, 52.3% of examined papers used quantitative methods, essentially questionnaires; 51.2% of qualitative research used interviews as the main qualitative research method [16]. The existing research on information and information flow on construction sites also used questionnaires and surveys [15]. Self-reporting questionnaires are prone to various biases. Social desirability bias, or SDB, is the general tendency to present oneself in a socially or culturally desirable manner that follows accepted standards of behaviour [17]. SDB jeopardizes the authenticity and reliability of self-reporting surveys with misleading answers [18]. The possibility of SDB existing in construction management research is due to its social sensitivity and the research methodologies adapted, such as non-experimental self-reporting surveys and questionnaires [19].
Compared to questionnaires, direct observation has several benefits as a research methodology. Firstly, data obtained from observational techniques are direct and primary, especially with regard to processes and behaviours [20]. Since these techniques do not rely on the honesty of respondents, biases are reduced or eliminated. Thus data collected from observations are more objective and accurate. Secondly, observations collect rich data. By following a standard protocol to collect data, the observations of the onsite work and information flow are able to record the beginning, the progress and the consequences of the time-wasting events to determine if any information loss happened in the process and to analyse root causes of these events. They can also enable analysis of a variety of attributes of the related information, for example, the parties involved, the information carrier and the total time wasted as well as the analysis of the patterns of information loss and their correlation with the time wasted. Furthermore, the onsite environment requires and allows objective, honest data to be collected. With carefully designed observation, rich data are expected to be collected. This research used a direct observation method to collect data in order to objectively analyse the information flow and loss in project management. Therefore, the observation method was applied in this research to obtain objective and unbiased data on information loss.
2.2 Data collection
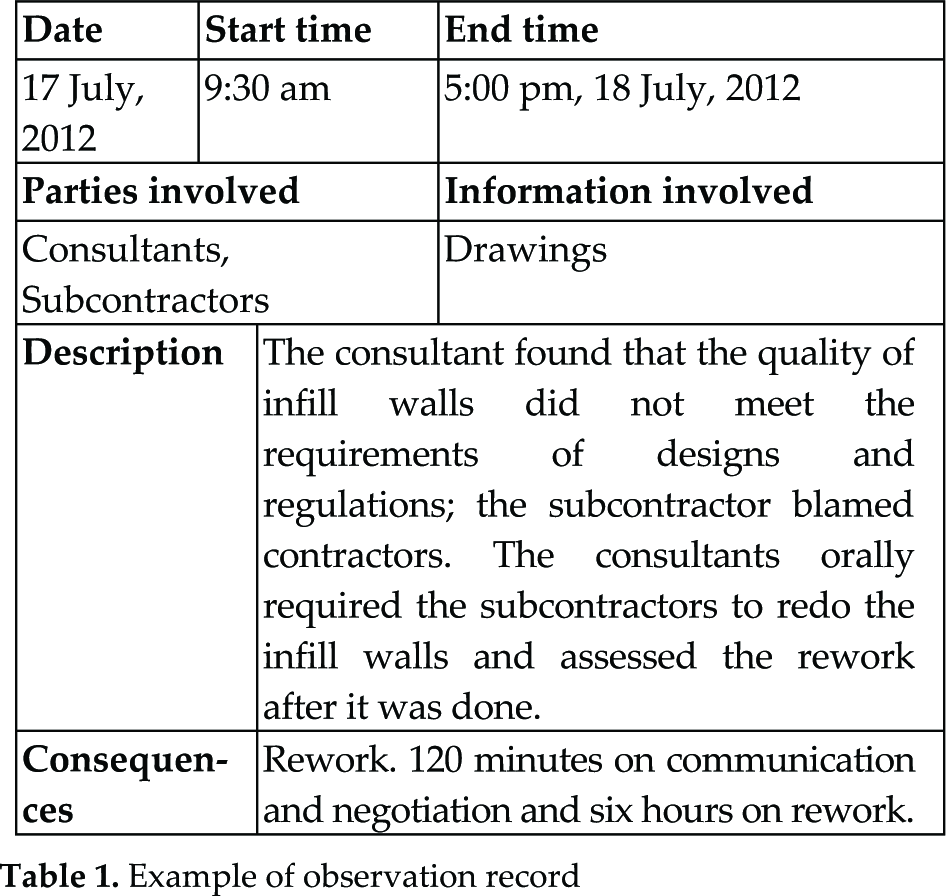
As Mahoney [20] points out, detailed instructions are required to guide observations. Therefore, protocols to record attributes of time-wasting events were developed, as shown in Table 1. The attributes included: the date of events, start and end time of the process, a detailed description of the work process, the parties involved and the consequences of the problem. These attributes were chosen based on the purpose of the research, which is to measure time loss, to analyse how information is lost and how that causes time loss in construction. The protocol was tested on one of the Wuhan Metro sites for 20 working days in order to refine it. For example, the original design did not specify the exact time of process commencement and fulfilment; when it was found that the time had to be recorded instead of the dates, the protocols changed. Details of every work process were also documented carefully so that they could be traced in the future for causal analysis. The time taken to handle every step of the working processes was documented.
Example of observation record
Using this protocol, researchers observed two construction sites in China. The first study observed the onsite management procedures on a typical site in Middle China (Site A) for 61 days (days without complete instructions were not counted as part of the formal observation). The second study observed the onsite management procedures on a typical site in North China (Site B) for 92 days. These two construction plants were chosen because they represented projects in different places in China.
Although there is a plan to expand this research to 10 more locations in the future, this sample size is deemed sufficient based on the research of Guest and Bunce [21], who pointed out that for research describing perception or behaviours, the minimum requirement for the number of non-probability purposive samples is 12. The researcher accompanied the consultants all day to keep track of their daily work and every process they handled in the work. When a problem occurred, notes were taken to record consultants' instructions, decisions, dialogues and other parties' reactions. The researchers followed each problem until it was solved and recorded the time taken to solve it. Consultants were chosen to be observed because they were independent and they had to cooperate with all other stakeholders, including owners, contractors, subcontractors, suppliers, etc. Because of their importance onsite, information flows involving all participants could be traced, recorded and analysed. The observations recorded the events, formats, results, and participants in onsite time-wasting. The records were examined carefully to understand whether and how the deficiencies and failures in information transfer and communication caused wasted time.
Semi-structured interviews with construction participants were also conducted on communication barriers and the consequences of inefficient information transfers as supplemental data gathering. This was done after recording the details of the information transfer and work processes. Consultants were interviewed because they were independent and experienced. They were interviewed after every instance of a time-wasting process was observed. Questions for the interview included the following: (1) Do you think the event that happened could be avoided? (2) If not, do you think the procedure could be shorter? (3) In your experience, how much time does it take to complete such a procedure, if everything goes according to plan? (4) What happened in this instance that caused the procedure to take longer than necessary? (5) If the event could be avoided, what should be done in the first place? (6) What do you believe is the leading cause of the delay? Note that the answers to these questions were used to analyse the supposed time taken and the time lost in the time-wasting events and the problems and causes of these events. In addition, the answers to Question 5 were used to verify the descriptions.
3. Observation analysis and results
In total, 196 construction events that involved time-wasting to some degree were recorded, including 79 events on Site A and 117 on Site B. The observation data records for the information flows were analysed. These events were filtered by whether the waste was caused or related to information loss. Delays were then calculated by comparing the allocated time and actual time taken for each work process. In the second part of the analysis, text analysis was used to determine the causes of information loss that led to time being wasted. In the third part of the analysis, the relationship between wasted time, information formats and participants involved was examined.
The personnel on Site A included the project manager, 13 engineers and trade managers in charge of safety, quality, materials, documents, cost control and techniques, one chief consultant and five consultants, as well as the owner's representative for Site A. Similarly, the personnel on Site B include the project manager, 14 engineers and trade managers in charge of safety, quality, materials, documents, cost control, subcontractor coordinators, one chief consultant and four trade consultants, as well as one owner's representative. The organizational structure on both sites is shown in Figure 1.

Organizational structure chart
3.1 Paths of information
There are many types and huge amounts of information flow on construction sites, following certain paths according to laws, regulations, contracts and working processes. Many of these paths involve more than two stakeholders and problems emerged in information transfer and communication. The first analysis of the observation data documents the information flow paths for all working procedures as a basis for further analysis.
A typical organizational structure of all onsite parties includes owners, contractors, subcontractors, consultants and designers. A working process usually involves more than one party and requires coordination among different parties. The information path for change orders is illustrated in Figure 2.

A typical flow of information for change orders
3.2 Calculation of losses
It is well known that problems in the communication and information life-cycle lead to schedule overruns and time wasting, but construction sites are complicated and not all time-wasting events are caused by information problems. Furthermore, some events perceived as time-wasting by contractors are not perceived as wasteful by designers. Here, only the events that were considered time-wasting by the contractors and were related to information problems are included in the following analysis. Questions were asked to help determine if the time wasting was related to information problems: “What could be done to avoid this event?”; “Is it related to information?” Therefore, only 70 events from Site A and 70 events from Site B were filtered. For example, on 17 April, 2012, on Site A the concrete mixer truck was delayed by three hours because of a traffic jam; this event was not considered as a time-wasting event caused by information problem; the contractors could do nothing even if they were aware of the jam. Other examples of excluded events include on one 24 April, 2012, where the subcontractors spent 20 minutes negotiating with contractors about the difficulty with flange welding caused by ground settlement. Another is the 70 minute work stoppage caused by a negotiation of cost issues on 1 May, 2012.
Estimated time used was obtained from the interviews with the chief consultants. Their estimations were believed to be credible and valid because the two chief consultants were experienced, with 17 and 13 years of experience in the construction industry respectively. As they were independent from contractors, they were able to estimate the time used without bias. On the other hand, the actual time elapsed for non-routine work procedures was assumed to be the actual time used. As the records included the exact time of commencement and fulfilment of construction processes, it is possible to calculate the total time in minutes. Construction procedures overlap with each other. An event starting at 9:00 am and ending at 5:00 pm does not indicate that this event took 8 hours, because in the meantime other work could be completed. It is essential to break down these events and to exclude any time lost not related to information problems. The statistics show that the total time wasted takes up 59.6% of all time used in these two projects. Figure 1 shows how many minutes were wasted in every event. The black points represent the data from Site A and the grey points represent the data from Site B. Most events were small and did not take long for construction parties to communicate, negotiate and take action: 57 out of 70 events on Site A were solved within an hour and 34 out of 70 events were solved within an hour in Site B.
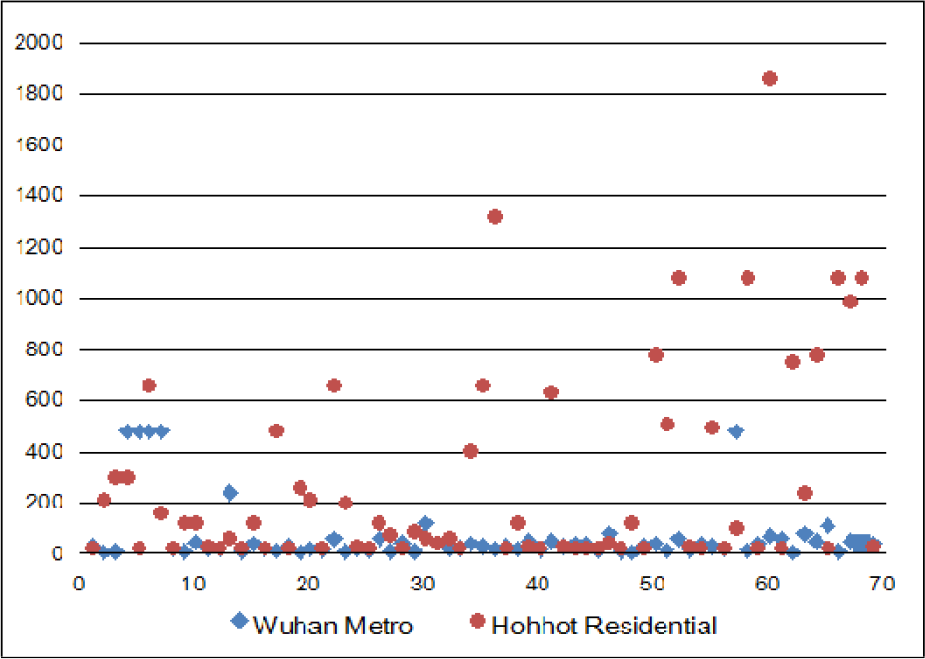
Minutes wasted on two sites
There are four different consequences of time loss: changes, reworks, suspensions and delays. Changes refer to changes in the design; reworks refer to work that must be redone; suspensions refer to the time of work suspended or completely stopped for further information and instructions, while delays refer to any other time wasted. Table 2 lists the frequencies, actual time used, time wasted, the ratio of time wasted to actual time used, overall time wasted and overall time used for the four different consequences. The statistics show that reworks happened often and took up more than half of all time wasted and a third of all time used. Changes happened only twice, but a large quantity of time was wasted on these two events, which took up 71% of the actual time used for these two events. Delays happened most frequently but the amount of time wasted was not great.
Actual time used versus estimated time used

By breaking the events down into procedures with single actions, the time wasted was better explained. Text analysis was applied to examine the observation records. Text analysis is commonly used in the data processing of observations, interviews and other research methods that involve visual, written or spoken data. Besides psychology, which obtains a large quantity of data from the interview and observation of participants [22], research in safety research also uses text analysis and observations to analyse accident types and major causes [23]. Text analysis provides keywords, clusters, diagnosis, mechanisms and so on [23]. The observation records accurately describe the beginning, the middle and the consequences of each event. The texts in the “Description” category were divided into sub-sentences according to the verbs. These sub-sentences were examined again to make sure every sub-sentence stood for one single action. For example, “The consultant found that the quality of infill walls did not meet the requirements of designs and regulations; the subcontractor blamed contractors. The consultants orally required the subcontractors to redo the infill walls and assessed the rework after it was done” was divided into the following actions: find, blame, require, redo and assess.
Several key words emerged as repetitive verbs to describe repetitive actions, including assess, find, negotiate, notify, rework, communicate, explain and wait. “Assess” describes the action of consultants assessing the structure; “find” describes the action of consultants or any other participants finding any problems; “negotiate” describes the action of participants negotiating over the problems; “notify” describes the action of consultants notifying the contractors or subcontractors either orally or officially with notifications; “rework” describes the process of rework; “communicate” describes the action of several parties gathering together to discuss problem-solving approaches; “explain” describes the action of one participant explaining the information to other parties; and “wait” describes the status of work stopped in order to wait for more instructions. Assessing and finding were the routine work of consultants and should not be considered as time wasting, while negotiating, communicating and explaining were extra work for different participants in communication and collaboration. Reworking and waiting took a large amount of time and can be reasonably considered as waste. As a result, four tags indicating time wasting were added to each event: negotiation, rework, explanation and waiting. Negotiation includes all situations with the keyword “negotiate” and “communicate”. Table 3 lists the amount of time wasted in the events with these four tags. The statistics showed that most events involved explaining, while negotiating also happened frequently. Reworking did not happen often but the associated time was the greatest, because the time taken to rework was counted as time wasted.
Time wasted and information processes

3.3 Problems in the information management
The structured protocols for recording observation data allowed the analysis to identify the causes of information loss. Text analysis was applied to examine the observation records. In this research, the text analysis was expected to extract a list of keywords to categorize the causes of information loss and to explain how time was wasted due to failures in information. The analysis involved iterative reading in detail of the text data to properly identify appropriate causes. Data used included the detailed records of construction procedures and the descriptions of the process from both the forms and the semi-structured interviews. Even though computerized programs have been used to assist text analysis [24], in this research, the observation records were processed and analysed manually with Office Excel to count word frequencies and calculate total waste.
The answers to the semi-structured interviews with construction participants were also used to analyse the problems in implementation. For example, on April 30, 2012, the contractors discovered the drawings did not match the real conditions and they waited eight hours to for designers to make a change to the drawings. In the interview, the contractors, designers and consultants suggested this event could be avoided if the site information provided to the designers was correct in the first place. Three causes of time losses emerged from the text analysis, which will be explained in detail below.
3.3.1 Time was lost when information was inconsistent
Text analysis shows that inconsistency appeared 82 times in the observation records. This inconsistency caused confirmation, communication, negotiation and rework. The observation showed that 16899 minutes of time were wasted due to inconsistency, which made up 71% of all time wasted and 43% of all time used. This is the major cause of time-wasting and schedule overruns. Inconsistency in information slowed construction processes due to the time spent on correction, confirmation, changes and re-authorization. There were several kinds of information inconsistency.
Information was lost when the attributes of the objects were not consistent with designs. For example, in the construction site in Wuhan Metro, the consultants found that the designed gap between the middle plate and the concrete support was too narrow to construct, so they initiated a change order to re-design the plate and support, which led to 50 minutes of negotiation and the change took seven days for redraw, re-authorization and rework.
Information was lost when the attributes of the objects were not consistent with regulations. For example, on the residential site, the consultant found that the rebar in the structural columns did not meet the requirements in the regulations. The consultant negotiated with the contractors and subcontractors and asked the owners to investigate the problems. The contractors were urged to redo the rebar, which led to 200 minutes of negotiation, investigation and rework.
Information was lost when the designs were not consistent with field conditions. For example, seven days were wasted because the designers misunderstood the survey information and failed to design ground beams, until the consultants investigated the construction site and decided that ground beams were essential. For example, on Site B, the bending angle of the rebar in the shear wall was inconsistent with the regulations; consequently, the consultant had to inform the contractor which resulted in the rework of the rebar. The rework cost 5.5 hours of wasted time for the assessment, rework and reassessment.
3.3.2 Time was wasted when information was dislocated.
Text analysis shows that dislocation appears 50 times in the observation records. The observation showed that 4938 minutes of time were wasted due to dislocation, which made up 21% of all time wasted and 12% of all time used. Generally, information is dislocated when the right information is not delivered to the right person at the right time. For example, on 2 August, 2012, the residential project had to stop because the rain had made the ground too soft, so that 1080 minutes were wasted in waiting for decisions to strengthen the ground. This wait could be avoided if the details of the ground problem were delivered to the owner. Dislocated information also includes the displacement of the carrier of information and the loss of information during communication among different participants and hierarchies. These may be considered as random and avoidable mistakes, but the survey showed that it happened five times, including three times on three consecutive days from 15 April to 17 April, 2012 after a design change was made. This showed that the storage of drawings and documents was not in good order and that the problem should not be ignored.
The major problem with dislocated information is out-dated communication tools: paperwork, telephones and meetings. Previous research promoted the use of digital-based information after discussing why paper-based documents slowed the construction process and caused information loss. However, current practice still heavily depends on paper-based documents. In fact, trying to make the transition between digital and paper information has made the process even longer. In his exploratory study, Tsai [25] illustrated the barriers that arose when workers recorded material details with a pen and paper and had to transfer the information to application systems and operation devices. It lengthened the process and caused unnecessary consumption of time. In this research, an example of this situation also occurred. The government administration required the consultants to submit emergency plans for the wet season by phone calls; the chief consultant wrote them on a piece of paper and had a general consultant type them into the computer and print them into paper documents for distribution. From start to finish, this process took four hours—at least three of which could be saved if all information was held digitally. Furthermore, in a paper-based system, information can be and is easily lost. In this research, the contractor and the consultant wasted 30 minutes looking for new drawings which were misplaced.
3.3.3 Time was wasted when information was ambiguous.
Text analysis shows that ambiguity appears 13 times in the observation records. The observation showed that 1368 minutes of time were wasted due to ambiguity, which took up 6% of all time wasted and 3% of all time used. The absolute value of time wasted due to ambiguous information was not great, but the ratio of time wasted to actual time used was as high as 76%, which was the highest of the three causes. This means that when information was ambiguous and required further confirmation or explanation, 76% of the time used to deal with the event could be saved.
Technical information, directions, questions, answers and feedback must often be communicated to various parties who have definable rights and responsibilities in the construction process. This situation causes information flow to slow down, be blocked or to be miscommunicated (as in the child's game of ‘pass the secret’). When this happens, work comes to a halt while the information and directions necessary for work to continue are awaited. For example, in this research, the consultants found a design error: insufficient steel support bars on the 15th floor. This was because the 15th floor was different from the standard floor and extra bars were needed to guarantee the structural safety. The consultants had to inform the designers and coordinate with the contractors to change the design. This delay would have been avoided if the design error had never occurred.
Overly specialized expression also blocked communication and information flow. Participants record field information according to their habits and specialty. It also occurs when surveyors, designers or other construction parties fail to follow the standards on drawings. As a result, recorded field information can be disordered and scattered. It may easily be misunderstood and misused by other parties, causing delays and wasted time. For example, a 27 hour-long process was recorded which could have been finished in nine hours. The contractors did not specify the technical requirements to the subcontractors and the consultants informed the subcontractors to suspend work until they obtained full information. In addition to this, large amounts of time were spent in routine technical meetings for participants to explain and understand information from their different specialties.
3.4 Time wasted and information flow
When the information was generated on construction sites, it generally went through the following processes: the generator passed the information on to the receiver, or the receiver acquired information from the generator; then the receiver processed the information and stored it or gave feedback to the generator. This research analysed the amount of time wasted as related to different information formats, participants and information process.
3.4.1 Time wasted and information formats
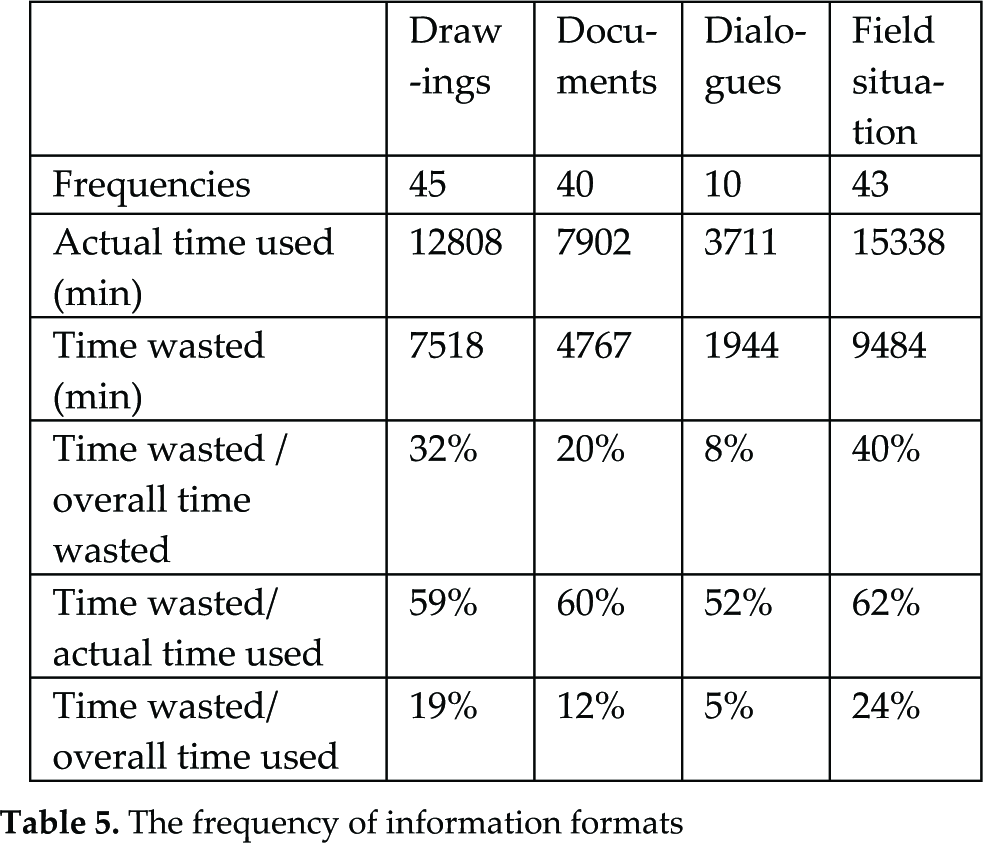
Unlike the research of Tribelsky and Sacks [7] which focused on the detailed design stage, the information on construction sites includes more than drawings and the packages of attributes in the drawings. Four formats of information appeared onsite: drawings, documents, dialogues and field situation. Drawings are easily understandable, referring to any working drawings that are used to guide the building process; documents refer to the documentary paperwork required by laws, standards and contracts as records and notices; dialogues refers to the conversations among participants that are not written down; and field situation refers to the information regarding site conditions. The frequency of information transfer by category in the empirical observation is listed below in Table 2. It shows that the events with the longest time wasted are related to drawings. Either the drawings were not consistent with the site situation, or the as-built was not consistent with the drawings. Other situations with drawings were also involved. Documents were much less likely to cause long periods of wasted time, while onsite information stays somewhere in between.
3.4.2 Time wasted and participants
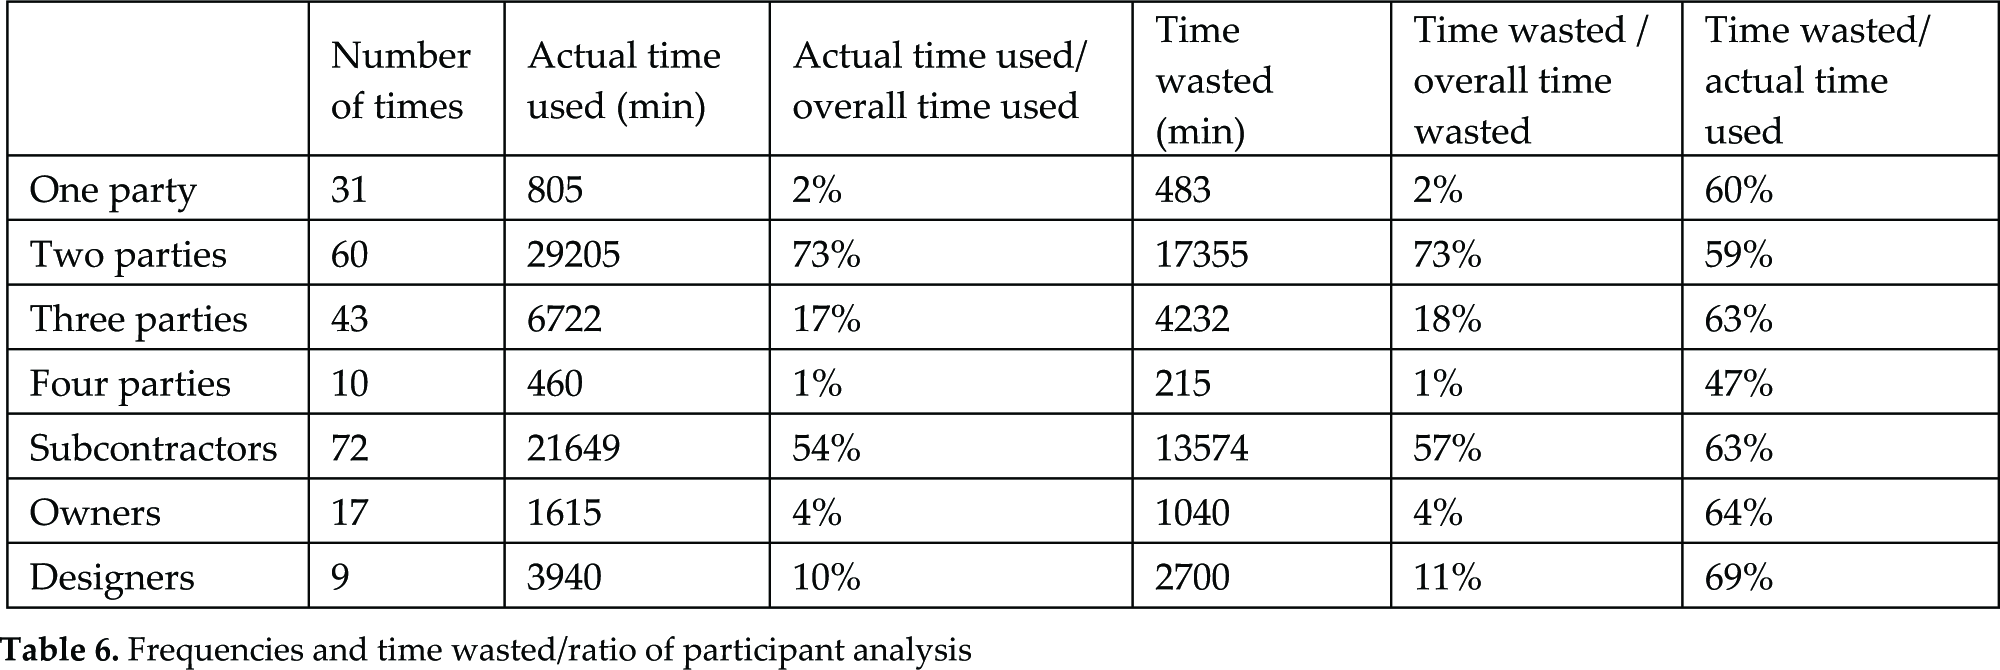
Observation records showed all the participants in every time-wasting event. Almost every event involved consultants and contractors, which was easily understandable because they were the major parties in the construction processes; however, attention should be paid to the events with more than two participants, as well as the specific participation of designers, owners and subcontractors.
Table 6 shows how many participants were involved when each event happened and how much time was wasted when particular participants were involved in the event. It suggests that as more participants became involved in the communication and collaboration, the time wasted significantly increased. The first column shows that the most time wasted involved the designers; the third column shows that when the owners were involved, less time was wasted; the similarity of the second column and the fourth column suggests that the involvement of subcontractors did not lengthen or shorten the time wasted due to communication problems.
Causes and losses

The frequency of information formats
Frequencies and time wasted/ratio of participant analysis
4. Discussion
The observations on the construction process on two sites in China revealed that nearly 59% of all time used was spent in negotiation, rework, explanation and waiting caused by information on construction sites. The consequences of information loss included changes, reworks, suspensions and delays. The text analysis of observation records and semi-structured interviews identified three causes of information problems: inconsistency, dislocation and ambiguity. In addition, the correlations between the time wasted and the information formats and participants were analysed.
This research also demonstrated the feasibility of the applied research methodology. Direct observations removed subjective biases that may be associated with self-reporting questionnaires. Also, conducting textual analysis on structured observation records and supplementary semi-structured interviews identified causes and consequences of information loss. These results are believed to be credible and accurate. However, the data collection process can be more carefully designed to calculate the loss in minutes of every action.
The answers to Question 6 in the semi-structured interview with project participants and the text analysis of the descriptions could facilitate an analysis of the causes of these time-wasting events. The leading causes of the time-wasting events corresponded to problems in information management.
The analysis of causes of information problems suggested that the wasting of time and resources can be avoided or reduced. Information technology has improved the construction industry's productivity in information collection, delivery, processing and storage. The information technologies help to monitor in real-time key construction processes and automatically push the information collected to the receiver for decision making. They help save time on requiring and locating information and avoid the mistakes of out-dated information. The information platform and integration shortens the information path, provides automatic processing of information and also has the benefit of avoiding out-dated information. For example, the building information modelling (BIM), which is the most important application in the third stage of the development in information and communication technology [12], is able to detect design errors and allow necessary changes to be made before construction begins, to show all participants exactly what will be built and how it will be built and to provide all the information associated with it, as well as to provide real-time monitoring and comparison. Barlish and Sullivan [26] reported a 42% reduction in the frequency of change orders and a 67% reduction in the frequency of schedule modifications after BIM was launched. Marshall-Ponting and Aouad [27] concluded that nD modelling to support communications had great potential to overcome the problem of information loss in construction processes based on discussions from several workshops.
This research also reveals that to increase the benefit of information technologies requires more than just delivering the right information to the right person at the right time. The amount of minutes of time wasted because of the ambiguity of information was 1230, which made up 6% of all time wasted and 4% of all time used. In her recent paper, Pasquire [28] argued that except for the seven flows of construction proposed by Koskela [5], common understanding should be regarded as the eighth flow on site. In this research, time was found to be lost because expressions were too specialized. Although the proportion of ambiguity was not large, it should be considered in information management. By clarifying the ambiguity and providing understandable information to the receiver, the information flow could be facilitated.
However, information technology cannot solve every problem. This research shows that 4546 minutes were spent on negotiation, which made up 19% of all wasted time and 11% of all working time. The root cause is the reluctance to collaborate. Information needed for the next procedure was withheld by one participant, either consciously or unconsciously. Two typical examples in this research include the fact that contractors did not provide information about a structure's size to subcontractors and that contractors covered hidden structures without consultants' assessment. Information errors, on the other hand, lead to frequent work suspensions. Large amounts of time were wasted in verifying and correction of information, coordination and re-authorization. Major corrections involving designers resulted in time-consuming changes, but many minor corrections interrupted working procedures and caused short but frequent work suspensions. The loss was caused by the conflict of interest rather than technological failures and would be very difficult to solve by technological advances. According to our experience, some participants would like to withhold certain information whenever possible to win them extra time and money from change orders; this problem may not be solved by cutting-edge information management tools but perhaps it could be by process re-engineering and management revolution.
5. Conclusions
This paper presents the research results of an observation study on two different large construction sites in China. Specifically, it analysed how much time was wasted by ineffective information management and communication. Wasted time was recorded by four categories: changes, reworks, suspension and waiting. It took up to 59.6% of all time used during the observation period. There are four categories of information recorded and categorized: drawings, documents, dialogues and field information. Problems in information management were also analysed and three problems were discovered. Time was wasted when information was inconsistent, dislocated and ambiguous. These astonishing results can be attributed to four causes: information errors, blocked paths, specialized expression and reluctance to collaborate. The analysis of the observation records showed that inconsistency and ambiguity in drawings would likely to cause much time wasting and thus more attention should be paid to them. This situation may be caused by more participants becoming involved when changes have to be made in drawings, since more participants bring about more communication and collaboration, a longer information flow and significantly increase the potential for time wasting.
By analysing the information formats, participants and information transfer process, this research showed how the information flowed on site and how these factors influenced time wasted in construction. It also showed the potential to improve productivity with advanced information technologies, not just ensuring that the right information is being delivered to the right person at the right time. Should the technologies deliver well-explained or understandable information to the receiver, information will be made to flow fluently. The causal analysis also showed that there were some problems the technologies could not solve; wasted time was caused by conflicts of interest among different participants and should be solved with management approaches.
Planned future research by this research team will expand the observation to various projects across China. With the structured protocols of the observation research methodology, it is possible to conduct similar direct observations in more projects to get a comprehensive picture of information loss and avoid case-dependent factors.