
Abstract
The need for an efficient means of managing emissions and identifying potential hazard black spots in construction processes effectively and at the lowest cost possible has been highlighted in the construction sector. This study illustrates an integrated 5D model developed for quantifying carbon emissions and simulating the pattern of emissions of construction processes as a whole using virtual prototyping technologies. The predicted construction emissions data for each activity is generated and plotted to visually demonstrate the emission rates alongside the integrated four-dimensional VP framework of the construction project. The model also consists of a pro-active construction management system (PCMS), which assist the project team to detect sources of danger to on-site workers and provide pro-active warnings to them so as to avoid fatal accidents that are often caused by falling from heights and being struck by moving objects. A Hong Kong high-rise housing development project is used to exhibit the application of the carbon emission visualisation and potential accident detection system. This tool aims to encourage construction industry practitioners to become more environmentally conscious and pro-active in carbon mitigation and safety performance.
1. Introduction
Site environmental and safety performance are now considered critical performance indicators of modern construction projects, in addition to the concerns of cost, time and quality [1]. With the global warming phenomenon reaching alarming levels [2], the construction industry is considered to have an important responsibility in reducing and mitigating carbon emissions as a result of its “fuel-intensive nature and large share of carbon emissions of the industry”[3]. Meanwhile, the construction site has long been considered one of the most unsafe and accident-prone workplaces amongst all industries worldwide. Poor site safety performance may cause legal liability for the contractors and clients, and also lead to project financial losses and contract delays. Official statistics from the Labour Department of Hong Kong indicates that two major hazard concerns on construction sites are i) striking against or being struck by moving objects; ii) being struck by moving vehicles [4, 5]. To enhance site safety performance, it is necessary to enhance the capacities of the project team and on-site workers in detecting and avoiding any potential construction site hazards.
The current boom in the construction sector in Hong Kong has led to a continued growth in carbon emissions and the risk of site hazards associated with increasing construction activities [6]. It is therefore important to improve the industry's carbon consciousness, monitor the carbon performance of a building project and maintain safe working environments. This means that stringent emission reduction plans need to be implemented during all construction phases; additionally, detection of surrounding sources of danger on-site is also required. Better visualisation of the environmental impact of construction activities and potential accident ‘black spots’ on construction sites help to reduce industry-related carbon footprints and enhance site safety performance. This study illustrates the use of virtual prototyping (VP) technology for developing a 5D model (i.e., a time linked three-dimensional model delivering estimated emission data, as well as real-time site location data) for i) visualizing and predicting the carbon emissions of the construction project; ii) detecting surrounding sources of danger and providing pro-active warnings to site operatives so as to avoid fatal accidents that are often caused by falling from heights and being struck by moving objects. In this study, the visualisation tool will be used to predict potential carbon emissions and detect the potential ‘dangerous’ locations of a housing development project in Hong Kong.
2. Carbon emission quantification and site hazard identification on the construction site
Over the past few years, research into the control and monitoring of the carbon footprint of construction processes has been growing [3, 7–19]. With electricity and diesel fuel considered as the key sources of energy-related emissions from construction processes [17], efficient fuel consumption and management thereof during the construction process will save on fuel costs and minimize total emissions [3]. Green and environmental control in the construction industry is becoming more stringent; it is important for contractors and construction companies to identify solutions and control emissions in line with green requirements and standards [3, 20]. While there is no shortage of emission models for quantifying emissions from a construction plant, only a few of these have assisted the environmental management of a specific construction project on its own [3, 8,13,14].
In the past few years, research into computer visualisation models for quantifying emissions from construction processes has been growing. Currently, most of the research initiating construction activity emission visualisation are being led by universities and research centres in the US [7–18]. For instance, visualization technology has been used to optimize concrete truck mixer routes to reduce emissions from the delivery of concrete to construction sites by way of the geographic information system (GIS) [7, 11, 16] and to check work productivity and emissions [13]. On the other hand, a selection framework incorporating CO2 emissions analysis and simulation with productivity performance allows lift engineers to assess the effectiveness of tower cranes on high-rise construction projects [12]. Operational efficiency has also been considered as a means for quantifying the amount of emissions from construction operations [15]. Despite these methods, many existing emissions visualisation technologies and quantification models are still in the early stages of development and limited to regional application. Existing research also focuses on specific construction trades or activities, such as concreting, earthwork and lifting. Limited tools have been created for a more holistic estimation of emissions that includes all construction activities in the project [3]. The need for a more comprehensive tool for analysing and visualizing carbon emissions from construction sites has therefore been highlighted [11].
For the site safety detection tool, advanced development of positioning systems allows for real-time monitoring of the positioning of construction workers, equipment and materials. Carbonari et al. [21] cited the four most promising technologies for construction use: 1) Radio Frequency Identification Device (RFID); 2) Global Positioning System (GPS); 3) Ultra wideband (UWB); 4) Wireless Local Area Network (WLAN). The accuracy of these construction systems was tested in various studies. For example, Ergen et al. [22] verified the accuracy of GPS through a case study in which only 61% of the locations obtained fell within an acceptable region (e.g. around 5 metres), while some of the results had an error of more than 15 metres. Cheng et al. [23] investigated the use of UWB for resources tracking and the results indicated that an average error of 0.41m was found in the construction pit in the experiment. Lee et al. [24] employed RFID technology for safety management and found that an average error of 44.97cm existed during the case study. Limited by the development of positioning technologies, it is difficult, if not impossible, to obtain an error-free result.
The use of positioning technologies for safety management generally follows a similar idea, which is to avoid workers from entering hazardous working areas, such as floor openings, floor edges and equipment operation areas. Previous studies, including Carbonari et al. [21], Cheng and Teizer [25], Teizer et al. [26], Wu et al. [27], Teizer et al. [28], Chae and Yoshida [29] and Hwang [30], adopted positioning technology to integrate a positioning system with construction safety management. This approach compares the positioning of workers, equipment and a pre-defined area to discover potential danger. A warning signal is sent to the workers and the operator of the equipment to avoid construction site hazards. However, due to the level of accuracy of the positioning systems, false alarms can be generated. Frequent false alarms could hinder the normal construction process. Despite the problem introduced by false alarms, the research by Carbonari et al. [21] had been the only study of the effect of workers' moving directions against the false alarms; a significant number of false alarms was recorded during the experiment.
The four-dimensional (4D) ‘Construction Virtual Prototyping’ (CVP) model developed by the authors [31] allows the construction team and project stakeholders to visualize the construction plan, observe the simulated time-lapse representation of corresponding construction sequences and provides for “an effective means for communicating temporal and spatial information on [to] project participants” [32–34]. A virtual prototyping technology was also deployed by the CVP team to develop typical construction scenarios in which unsafe or hazardous incidents occurred [35]. While the virtual prototyping technology has proven to be an effective and practical visual communication platform for project teams and stakeholders, its application in the ‘green’ management of the site and site hazard identification is yet to be fully explored.
3. Development of 5D models
A pilot 5D VP model was developed to visualize and simulate emissions of a construction plant and the equipment used, and to identify the potential ‘black spots’ hazard present on construction sites at the planning stage. Figure 1 shows the development process of the emission prediction visualisation tool. The development of the visualisation tool consisted of four steps [3]: i) gather general project and equipment data; ii) develop plant operation plans; iii) identify the predicted emission quantities and set up the emission estimation model (PEEM); iv) construct a four-dimensional virtual prototype and import the emission data. First, a series of activities, each of which had a defined duration, were linked with the construction plant and its components and resources [3]. Information, including the operation hours of the equipment, as well as the plant-based on-site equipment operation plan was acquired to predict the emissions of the construction process [3]. PEEM was then developed from the schedule of the equipment operation. Details of this process can be found in Wong et al. [3].
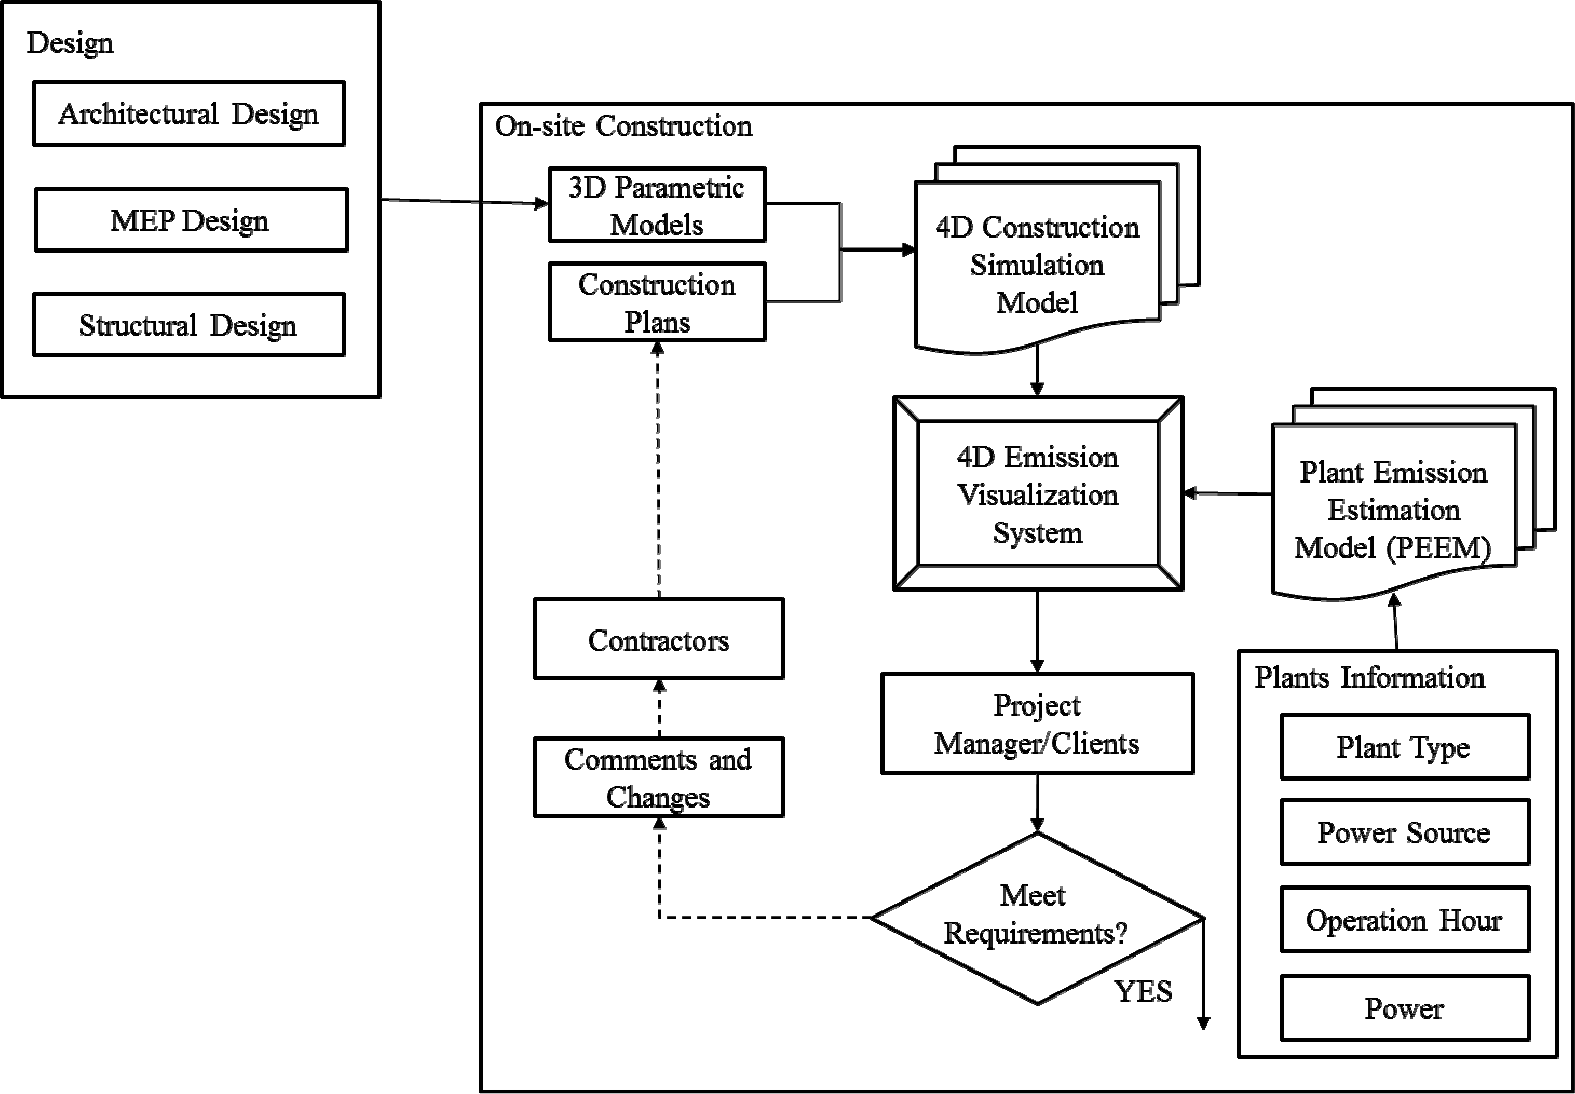
A framework for VP-based carbon emissions estimation
In regard to site safety control, a PCMS was proposed to help on-site workers detect surrounding sources of dangers and provide pro-active warnings to them to avoid fatal accidents that are often caused by falling from heights and/or being struck by moving objects. PCMS adopted a typical three-tier web-based application structure (presentation layer + business layer + data layer), as shown in Figure 2. PCMS was composed of two sub-systems: 1) the Real-Time Location System (RTLS) and 2) the Virtual Construction Simulation system (VCS).

System architecture of PCMS
The Real-Time Location System (RTLS) can be divided into two parts: i) the real-time location network; ii) the real-time location engine. The real-time location network was constructed with tags, which are small hardware devices designed to be mounted onto helmets and moving objects, and anchors that are also small hardware devices and designed to be fixed to static positions as reference points. Tags are the devices that are located by anchors. As detailed in the following section, the case study will use time-of-flight (TOF) based location schema, in which the location of a tag hinges on the distances between it and the nearby anchors. Another important function of tags is to alert workers through vibration and/or a specific sound of dangers to which they are being exposed. A network must involve networking that is implemented with, in this project, CSS (Chirp Spread Spectrum), through which ranging results can be sent to the location engine and warning signals routed to specific tags.
One important task in location-based construction safety risk monitoring is to define dangers (e.g., the boundaries of any holes and/or edges of places, and the radius of the danger circle of a moving vehicle) in VCS models, as well as calculating the relative distances between workers and their surrounding dangers. Dangers are categorized into static dangers and dynamic dangers in terms of their mobility. As far as the concerned hazard types, static dangers include – but not limited to – floor holes, unprotected sides of the slabs and wall openings. Dynamic dangers are more varied and their sources are primarily on-site, and include major equipment such as tower cranes, moving cranes, excavators, bull dozers, etc. These dynamic dangers will be monitored in their manipulation areas, as well as in the relative auxiliary yards and plants, such as wood yards (formwork, shutter and timbering), steel yards (reinforcement processing plant), batching (concrete mixing) plants, on-site prefabrication and/or preassembly yards, and lime and mortar plants.
The real-time location engine is designed with three functions, i.e., managing location network, calculating tag locations, and sending alert signals to tags. A network might be composed of a dozen tags and anchors. To avoid radio frequency interference, the location network is prudentially and precisely managed by the location engine to slice time into small pieces and to start and close the ranging session between a tag and an anchor. With the received ranging results, the location engine is responsible for calculating tag positions with an effective algorithm and consequently sending the positions to the application server for virtual construction simulation and safety management. The final responsibility of the location engine is to relay danger alarm signals to specific tags through the location network.
The Virtual Construction Simulation system (VCS) consists of the application server (i.e., the virtual construction engine), the client end, the web server and the database server. The application server is the unit handling the business logic of PCMS, namely monitoring three types of danger sources, including: a) persons falling from heights; b) striking against or being struck by moving objects; c) being struck by moving vehicles. Relative distances between workers (represented by the positions of the tags installed on helmets) and sources of danger (represented by tags installed on the moving objects and danger zones, which are dynamically defined in a 3D model of a construction site) are monitored. Once the detected distances between workers and their surrounding sources of danger are equal or less than an allowable value, warning signals will be triggered and sent to the real time location engine, which will then relay the signal to trigger the warning device of tags installed on the helmets. Other functions of the application sever include synchronizing the user ends to simulate construction processes and storing and retrieving tag positions to replay construction processes. The user client is a web-based application for visualizing construction processes, tracking people and equipment, and replaying construction processes. Administration features, i.e., managing danger zones, configuring anchor positions, managing relations between tags and tag carriers, and managing virtual construction models, are also implemented in the user client.
4. Case study
The project used to demonstrate the concept and applicability of the VP-based emissions prediction model and to trial run the PCMS system for the detection of potential accident black spots was a housing development project owned by the public housing authority in Hong Kong. The project involved the construction of a 34-storey domestic building and an open car-parking area.
4.1 Quantifying carbon emissions from construction activities
In order to obtain details about the fuel consumption rates of equipment, and equipment being used for the actual construction works, discussions and meetings were held with the main contractors and material suppliers of the project (Table 1). After the details of all equipment had been collected and categorized by type, engineer tier, the nature of activities involved, total number of hours used and the total number of equipment required were determined [3]. Engineer tier requirement determines the emissions output of the equipment. The emissions information and framework was imported into the simulation model using Autodesk NavisWorks.
A list of the equipment and plant used for the public housing project

Figure 3 shows three different activities of this construction project in virtual reality environments, which is presented in a 4D model. While the simulation program ran, the amount of total emissions and the emission variations was displayed. The amounts of CO2 emissions are presented in graphic format in the lower right corner [Figure 3(i) to 3(iii)]. The simulation visually presented the operation of any items of the construction equipment or plant at a particular stage or activities. This visualisation allowed the construction team and contractor to highlight the activities generated that had high emission rates and to pinpoint the causes for this, so that construction equipment idling time could be reduced [3]. The simulation can be used as a tool to communicate amongst the project team members on how to minimize unnecessary emissions and to set up an appropriate plan for environmental management. In this case study, the total plant and equipment emissions was around 700,000 kg, based on the predictions of the tool. In this case, the developer wished to minimize the overall emissions up to 105,000 kilogram (i.e., 10–15 per cent of total emissions); the project team revisited the construction program and tried to highlight the likely energy consumption reduction through the operation of unnecessary tower cranes and excavators.

VP models with estimated CO2 emission rate of plant/equipment in different phases: (i) foundation construction stage; (ii) typical floor concreting works and formwork installation stage; and (iii) excavation and lateral support stage for external works
4.2 Detecting potential hazard black spots
To ensure the practicality of PCMS, a trial model was developed for this case study in order to test its technical feasibility, stability and practical deployment and adoption. These tests included, but were not limited to, the following aspects: location tolerance, ranging capacity, location update rate and battery life, convenience in updating virtual construction models, recharging batteries, environmental suitability of tags and anchors, methods of carrying tags and fixing anchors.
The location-based virtual construction was constructed by integrating the virtual construction technology with RTLS. The location-based virtual construction allows the immediate connection between virtual models and realistic construction situations, particularly the integration of static virtual models and dynamic dangers. In this way, site managers can monitor on-site construction progresses and safety risks. Two toolkits, Unity and SmartFoxServer, were adopted to develop the location-based virtual construction in this project. Unity is a tool that helps to create three-dimensional video games, architectural visualizations and real-time three-dimensional animations. Unity was used to build the user client with features that includes visualizing construction progresses, defining static and dynamic dangers and others previously mentioned. SmartFoxServer is a massive multiplayer game server and was used to help build the application server; it will be used to develop a server object extension to drive and synchronize all the user clients within the real construction situations. Figure 4 shows the deployment diagram of PCMS.

System deployment of PCMS
For the real-time location, the project team tested several location technologies; finally, CSS (chirp spread spectrum) [36] was selected as the ranging technology, which uses TOF to estimate the physical distance between two devices. CSS has higher precision than other TOF methods, for example, in receiving signal strength. A collaborative localization schema was adopted to construct the real time location system (RTLS), which needs no synchronization between infrastructure nodes and is believed to be suitable for the environments on construction sites. A location tag performed ranging with location anchors; in this way, the distances of the nodes were made known. Based on these distances and the known anchor coordinates, the coordinates of the location tag could be estimated. Based on the application requirements, the system was designed so that the positions of location tags were calculated at the location engine. In this project, approximately 100 tags were installed on site for a period of about four months to evaluate the technical feasibility and usefulness of the PCMS. The site was planned into eight zones, each of which was approximately 30m × 30m in size. Ranging results were sent to the location engine through the CSS wireless network. Table 2 shows a four stage test plan developed for this project. An example of the image captured by PCMS system during its trial run at the TTACE project is shown in Figure 5. The blue spots in the diagram represent the location of the hook of the tower crane, while the red spots represent the location of the site operatives. The initial testing suggests that no obvious site hazard block-spots were identified for this project. The hazard detection model provided valuable information and feedback to the project team about the site plan, equipment and safety planning.
Trail Plan of PCMS for the Case Study


Image of PCMS system captured during the trial at case study project
Despite this achievement, the model established in this study is still in its preliminary stages and the tool should be applied to more actual construction projects of different natures. The next stage of research will involve the development of a more holistic emission prediction and checking tool. Additionally, a more comprehensive carbon footprint assessment tool is needed if we want to accurately predict the total embodied energy (including carbon emitted from embodied energy and building assembly processes) and improve the carbon performance of the project. Thus far, there have been limited attempts at developing an integrated life-cycle analysis (LCA) with BIM to monitor the embodied carbon of a construction project (see for example [32] and [33]). There is a lack of research providing any support for managing construction and demolition waste via BIM technology. Furthermore, the PCMS is only in its trial run stage; complete and/or more testing and revision of the tool is required before it can be widely adopted in other construction sites. These areas will be investigated in further studies.
5. Conclusions and Future Work
In this study, a visualisation tool was established to help project team members estimate and visualize CO2 emission levels during construction processes. The emission prediction framework presented in this study is able to help the contractor identify the source of the emissions and to quantify the amount of emissions generated during the construction processes. The developed tool also helps builders and contractors to forecast trade activities with high CO2 emission levels and to identify emission mitigation strategies, for example, by changing outdated plant items with energy-saving replacements and minimizing idling time after revisiting the construction work schedules and programme, which helps to promote best practices in sustainable development, thereby becoming more environmentally conscious and pro-active. The PCMS provides a platform for the construction project team to review their site plan, including equipment/plant schedule and plan. It furthermore assists contractors and/or sub-contractors to detect surrounding sources of danger to their site operatives. The detection tool also provides pro-active warnings to site workers so as to avoid fatal accidents that are often caused by falling from heights and being struck by moving objects, such as materials hanging from a tower crane. This tool provides contractors a way to ensure that they are more responsible by helping their clients to meet their environmental objectives, as well as ensure their own site safety performance.
Footnotes
6. Acknowledgments
The authors would like to acknowledge the Hong Kong Housing Authority for its support in conducting this research.