
Abstract
Mobile robot applications that involve exploration and inspection of dynamic environments benefit, and often even are dependant on reliable novelty detection algorithms. In this paper we compare and discuss the performance and functionality of two different on-line novelty detection algorithms, one based on incremental Principal Component Analysis and the other on a Grow-When-Required artificial neural network. A series of experiments using visual input obtained by a mobile robot interacting with laboratory and real-world environments demonstrate and measure advantages and disadvantages of each approach.
Introduction
Differentiation between common and uncommon stimuli is a desirable ability for mobile robots operating in dynamic environments, since uncommon features often carry the most useful information and therefore deserve to be analysed in more detail. In fact, any agent aiming at true autonomy, adaptability to new situations and continuous operation needs to prioritise its actions — which can be achieved with a novelty detection mechanism using on-line unsuper-vised learning.
From an application point of view, reliable novelty detection systems would facilitate the implementation of automated environment exploration and inspection. In these tasks — differently from pattern recognition tasks in which features of interest are already known — one commonly desires to detect any previously unknown entity. Therefore, the feasible approach to be followed is to learn a model of normality of the environment and use it to filter out abnormal perceptions.
Previous work has demonstrated that the approach of learning models of normality and using them later to highlight abnormalities is very effective for mobile robots that use sonar readings as perceptual input (Marsland et al., 2002). This work resulted in the development of the Grow-When-Required (GWR) neural network, a self-organising learning mechanism that is able to classify stimuli as novel or not through the use of a model of habituation.
The GWR network has shown to work well with low-dimensional input data, such as a vector of sonar measurements. However, in the past few years we have been interested in investigating the scalability of the GWR approach to another rather different sensor modality, vision. Our interest in using vision for novelty detection purposes comes from the much wider range of information about the environment this sensor can provide.
A major difficulty that comes with vision is to select which aspects of the data are important to be encoded, as it is normally undesirable to process high-dimensional data directly due to restrictions in computational resources. In previous studies, a mechanism of attention that selects salient locations within the image frame (Itti et al., 1998) so that some image encoding can be performed in their vicinity was successfully employed (Vieira Neto and Nehmzow, 2004, Nehmzow and Vieira Neto, 2004). The purpose of the image encoding stage was to reduce dimensionality of input data to the GWR-based novelty filter while trying to preserve discriminability between different classes of features as much as possible.
Designing the image encoding stage is not trivial because it is not always clear to the designer which elements of the data are the most relevant. It would be more desirable to select which parts are the most important in a bottom-up approach and hence our interest in the Principal Component Analysis (PCA) algorithm. PCA consists of projecting the data onto principal axes — the axes in which variance is maximised — obtained from the data itself.
The standard PCA algorithm is usually computed in batch mode and needs all the input data to be available at once, making it unsuitable for on-line learning systems. Recently, however, an algorithm for incremental computation of PCA was introduced by Artač et al. (Artač et al., 2002), which has an embedded novelty detection mechanism.
In this paper we report experiments using novelty filters based on the incremental PCA and GWR network approaches and compare their performances in laboratory and real-world environments. Figure 1 shows a block diagram that illustrates the framework in which both methods were tested.

The visual novelty detection framework: salient image patches are selected within the images acquired from the environment and then either of the novelty filters is used to indicate the presence of novelty.
In order to generate the input for the novelty filters we have used a visual attention mechanism to select smaller image patches within the input frame. We briefly describe the attention mechanism in the next section, followed by both techniques used for novelty detection. Finally, we present in detail the experimental setup in which trials were conducted and discuss the results obtained.
The high dimensionality of visual data imposes serious constraints to real-time processing, especially when using mobile robots with restricted computational resources. It is therefore prohibitive to process an entire image frame, even when using low resolution — the use of some sort of dimensionality reduction scheme that preserves important and distinctive features of the visual data is needed before any higher level processing can be done.
Also, images acquired from a mobile robot are subject to several geometrical transformations resulting from changes in perspective. Hence, the naïve approach of comparing entire image frames directly would most definitely not work properly, leading to the misclassification of known features as novel due to simple image transformations.
In this work we have used the saliency map (Itti et al., 1998) as a mechanism of visual attention to select distinctive regions in the input image frame (152 × 120 pixels in size). The saliency map is a bottom-up model and comprises the combination of several multi-scale feature maps in intensity, colour and orientation of visual features, allowing the detection of conspicuous locations within the image frame that are generally robust to geometric transformations. Further details of the implementation of the saliency map used in this work can be found in (Vieira Neto and Nehmzow, 2004).
We have used the nine highest values of the saliency map for each input frame to select the most “interesting” image regions so that image patches can be extracted from their vicinity. The image patches used in the experiments reported here were 24×24 pixels in size. As we have used RGB colour images, the resulting input vectors for the two alternative novelty filters being compared have 24×24×3 = 1728 elements. Input vectors were normalised before being fed to the novelty filters to even out lighting conditions.
As in this work the similarity between image patches is computed in a pixel-by-pixel basis using Euclidean distance, it is important to have the image patches aligned as much as possible to minimise errors. The saliency map has an important role in this task as the location of salient points tend to be very stable and therefore minimises image patch misregistration.
The present implementation handles translation effects only, but other algorithms allow invariance to scale and rotation (Lowe, 2004), and also invariance to affine transformations (Mikolajczyk and Schmid, 2002). In this paper, generalisation with respect to scaling, rotation and affine transformations is achieved by means of the acquisition of several vectors for geometrically transformed versions of the same visual features.
Novelty filters
The GWR network
The Grow-When-Required (GWR) is an artificial neural network that was especially designed for the task of on-line novelty detection (Marsland et al., 2002). It combines a clustering mechanism and a model of habituation to decide if a determined input is novel and therefore needs to be incorporated to the current model. A summary of the operation of the GWR network is given in Algorithm 1.
The network is initialised with two unconnected nodes, whose weights are set to the first two input vectors. As further input vectors are presented to the network, the algorithm is able to decide which represent novel features, based on how well they match existing habituated nodes, building and exploiting a topological map of the input space.
In previous work we have used the GWR network for visual novelty detection using local colour histograms as inputs, and assessed its performance quantitatively (Vieira Neto and Nehmzow, 2004, Nehmzow and Vieira Neto, 2004). In the experiments reported here, we used normalised raw image patches in order to compare performance and functionality fairly with the alternative novelty detection algorithm based on incremental PCA.

GWR network novelty detection. The parameters used were: aT = 0.9, hT = 0.3, η = 0.1, ∊ = 0.1, τ = 3.33, α = 1.05, h0 = 1, S(t) = 1 and agemax = 20.
Principal Component Analysis (PCA) is a very useful tool for dimensionality reduction that allows reconstruction of the original data with minimal loss of information. It is based on projecting the input data onto its principal axes and is usually computed off-line, as the standard algorithm requires that all data samples are available a priori, making it unsuitable for applications that demand on-line learning.
However, a method for the incremental computation of PCA recently introduced by Artač et al. (Artač et al., 2002) makes simultaneous learning and recognition possible. Their technique allows the original data to be discarded immediately after the eigenspace is updated, storing only the (reduced dimension) data projected onto it.
In this work we employ the method proposed by Artač et al. to perform on-line novelty detection, using the magnitude of the residual vector, i.e. the RMS error between original data and the reconstruction of its projection onto the current eigenspace, to classify the input as novel or not. Algorithm 2 summarises how this approach is implemented.

Incremental PCA novelty detection.
The algorithm is made completely incremental by initialising the eigenspace and projected vectors as follows:
In this approach, dimensionality reduction is achieved by exploiting the fact that the number of eigenvectors in the model are likely to be less in number than the dimensionality of the input vectors (24 × 24 × 3 = 1728). If all eigenvectors are kept in the model, perfect reconstruction of the original data is achieved. This functionality allows the user to reconstruct the input image patches from the stored projected vectors and have a perfect notion of which aspects of the environment were learnt.
Further dimensionality reduction can be achieved by keeping only the eigenvectors corresponding to the k < n largest eigenvalues in the model at the expense of losses in reconstruction (and possibly in the recognition rate of the system). The selection of eigenvectors can be done while computing the batch PCA during learning (step 7 in Algorithm 2). In this work we have set the threshold for the magnitude of the residual vector as rT = 0.2 and we kept only eigenvectors whose corresponding eigenvalues were larger than 1% of the largest eigenvalue.
In order to compare the performance of the aforementioned novelty detection mechanisms we have designed a series of experiments consisting of two different phases: an exploration phase in which the robot learns a visual model of normality for its operating environment; and an inspection phase in which the learnt model is used to highlight any abnormal visual feature that may appear in the environment.
A bounded square arena was built with cardboard boxes, where a Magellan Pro mobile robot was used to collect images while navigating using a simple obstacle avoidance behaviour. Later, the same robot and navigation strategy were used to collect images in a real corridor at the University of Essex. Although both novelty filters being compared here are able to run in real-time, the images were collected for off-line processing in order to make fair comparisons by using the same dataset for both methods.
Quantitative Assessment
For the purpose of assessing the performance of each novelty detection method — GWR and IPCA — we first generated a baseline, a “ground truth” by labelling each pixel in each image frame manually as “novel” or “not novel” (any image patch selected by the mechanism of visual attention containing at least 10% of highlighted pixels was then labelled as “novel”).
This yielded 2 × 2 contingency tables that related the two categories “novelty present” and “novelty not present” with the two responses “novelty detected” and “novelty not detected” (Vieira Neto and Nehmzow, 2005).
Once the contingency table was constructed, we first ascertained that the mechanism under investigation yielded a statistically significant correlation between ground truth and system response, using a χ2 analysis. The strength of that association was then quantified, using both Cramer's V and the uncertainty coefficient U (Nehmzow, 2000) 1 .
To put performance into relation to cost, we also compared the size of the models acquired by the two approaches.
Every round of the exploration or inspection phases consisted of five consecutive loops around the arena (2250 input samples, corresponding to 9 salient regions per image frame in a total of 250 frames) or three journeys along the corridor (1350 input samples, corresponding to 9 salient regions per image frame in a total of 150 frames).
Results
The first round of experiments comprised of the robot exploring the empty arena in order to build a model of normality for it. After that, the robot inspected the arena when two different objects (one at each time) were introduced into the arena: a very conspicuous orange football and a much less conspicuous grey box. The results obtained for both approaches are given in Table 1.
Experiment 1 - exploration of the empty arena and inspection of the arena containing a novel object (orange football or grey box).

Experiment 1 - exploration of the empty arena and inspection of the arena containing a novel object (orange football or grey box).
Both systems produced a statistically significant correlation between system response and ground truth (χ2 analysis, p < 0.01). It can be noticed from Table 1 that the strengths of association obtained for both systems are similar. The GWR network model consists of only 4 vectors (with the 1728 original dimensions) while the incremental PCA model consists of 35 vectors (with 33 compressed dimensions).
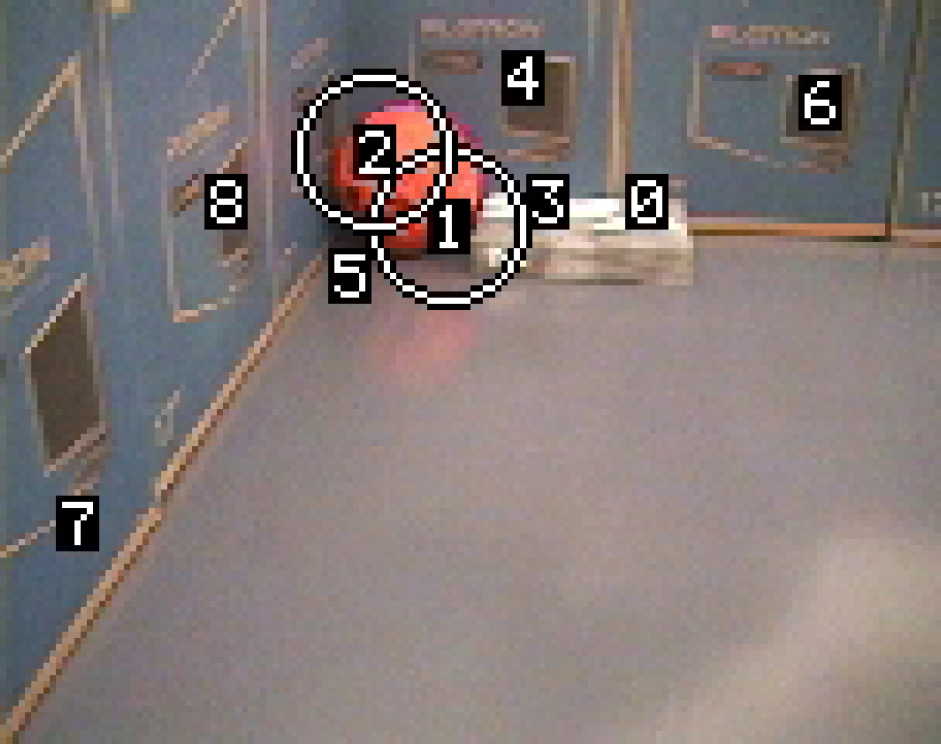
Figure 2 visually depicts the results obtained for frames where the orange football and the grey box appeared, respectively. For the particular image frames shown in Figure 2, results were exactly the same for both approaches.

Results obtained with the visual novelty detection mechanism in experiment 1: (a) the orange football as new object; and (b) the grey box as new object. White circles designate image patches labelled as novel by the system, while numbers indicate salient locations within the image frame, which were then evaluated for possible novelty by the respective novelty filter.
Obviously, we needed to establish that the task of novelty detection was actually achieved by our novelty filters, rather than the saliency map, which was merely employed to make a pre-selection of image patches to be evaluated for possible novelty. We therefore conducted a second round of experiments. This time the robot had explored the arena containing the conspicuous orange football and inspected it with the inclusion of the inconspicuous grey box in two different situations: first in a different location and then in the same location as the ball.
Both GWR and PCA were able to detect the novel object successfully in each situation, regardless of the presence or not of the much more salient — but already known — orange ball in the same image frame. This is illustrated in Figure 3, which shows the response of the incremental PCA algorithm.
Both GWR and PCA produced statistically significant correlations between ground truth and system response (χ2 analysis, p < 0.01), the strengths of association obtained for this round of experiments are given in Table 2 and show a slight superiority of the incremental PCA approach in this situation.

Results obtained with the visual novelty detection mechanism in experiment 2: the grey box is correctly detected as novel regardless of the presence of the much more salient but already known orange football. The output shown is the one provided by the incremental PCA approach, as the GWR-based approach only labelled region 0 as novel.
Experiment 2 - exploration of the arena containing the orange football (“not novel”) and inspection of the arena containing a novel object (grey box in the same location as the ball and in a different location as the ball).

A third round of experiments was conducted in a similar fashion as the previous one, but reversing known and novel objects: this time the robot explored the arena containing the grey box and inspected it with the inclusion of the orange football. Again, two instances were analysed: the orange ball in the same location as the grey box and also in a different location in the arena.
Both approaches were able to detect the orange ball as the novel entity correctly. Again, system responses were significantly correlated with ground truth (χ2 analysis p < 0.01), the strengths of association obtained are given in Table 3.
Experiment 3 - exploration of the arena containing the grey box and inspection of the arena containing a novel object (orange football in the same location as the box and in a different location as the box).

Figure 4 shows an example of output obtained during the third round of experiments (for the particular image frame shown, results were exactly the same for both methods).
Results obtained with the visual novelty detection mechanism in experiment 3: the orange football is correctly detected as novel regardless of the presence of the already known grey box.
Finally, a fourth round of experiments was conducted in a corridor at the University of Essex. The robot explored the empty corridor and inspected it with the inclusion of three different objects at different times: a black rubbish bag, a dark brown bin and a yellow wooden board. Table 4 gives the results obtained in this round of experiments.
Experiment 4 - exploration of the empty corridor and inspection of the corridor containing a novel object (black rubbish bag, dark brown bin or yellow wooden board).

Again, both methods were able to identify novel objects correctly, and produced a statistically significant correlation between system response and ground truth (χ2 analysis, p < 0.01). Table 4 gives V and U for this experiment.
Figure 5 shows examples of the output provided by the novelty filters, all novel features are correctly identified.
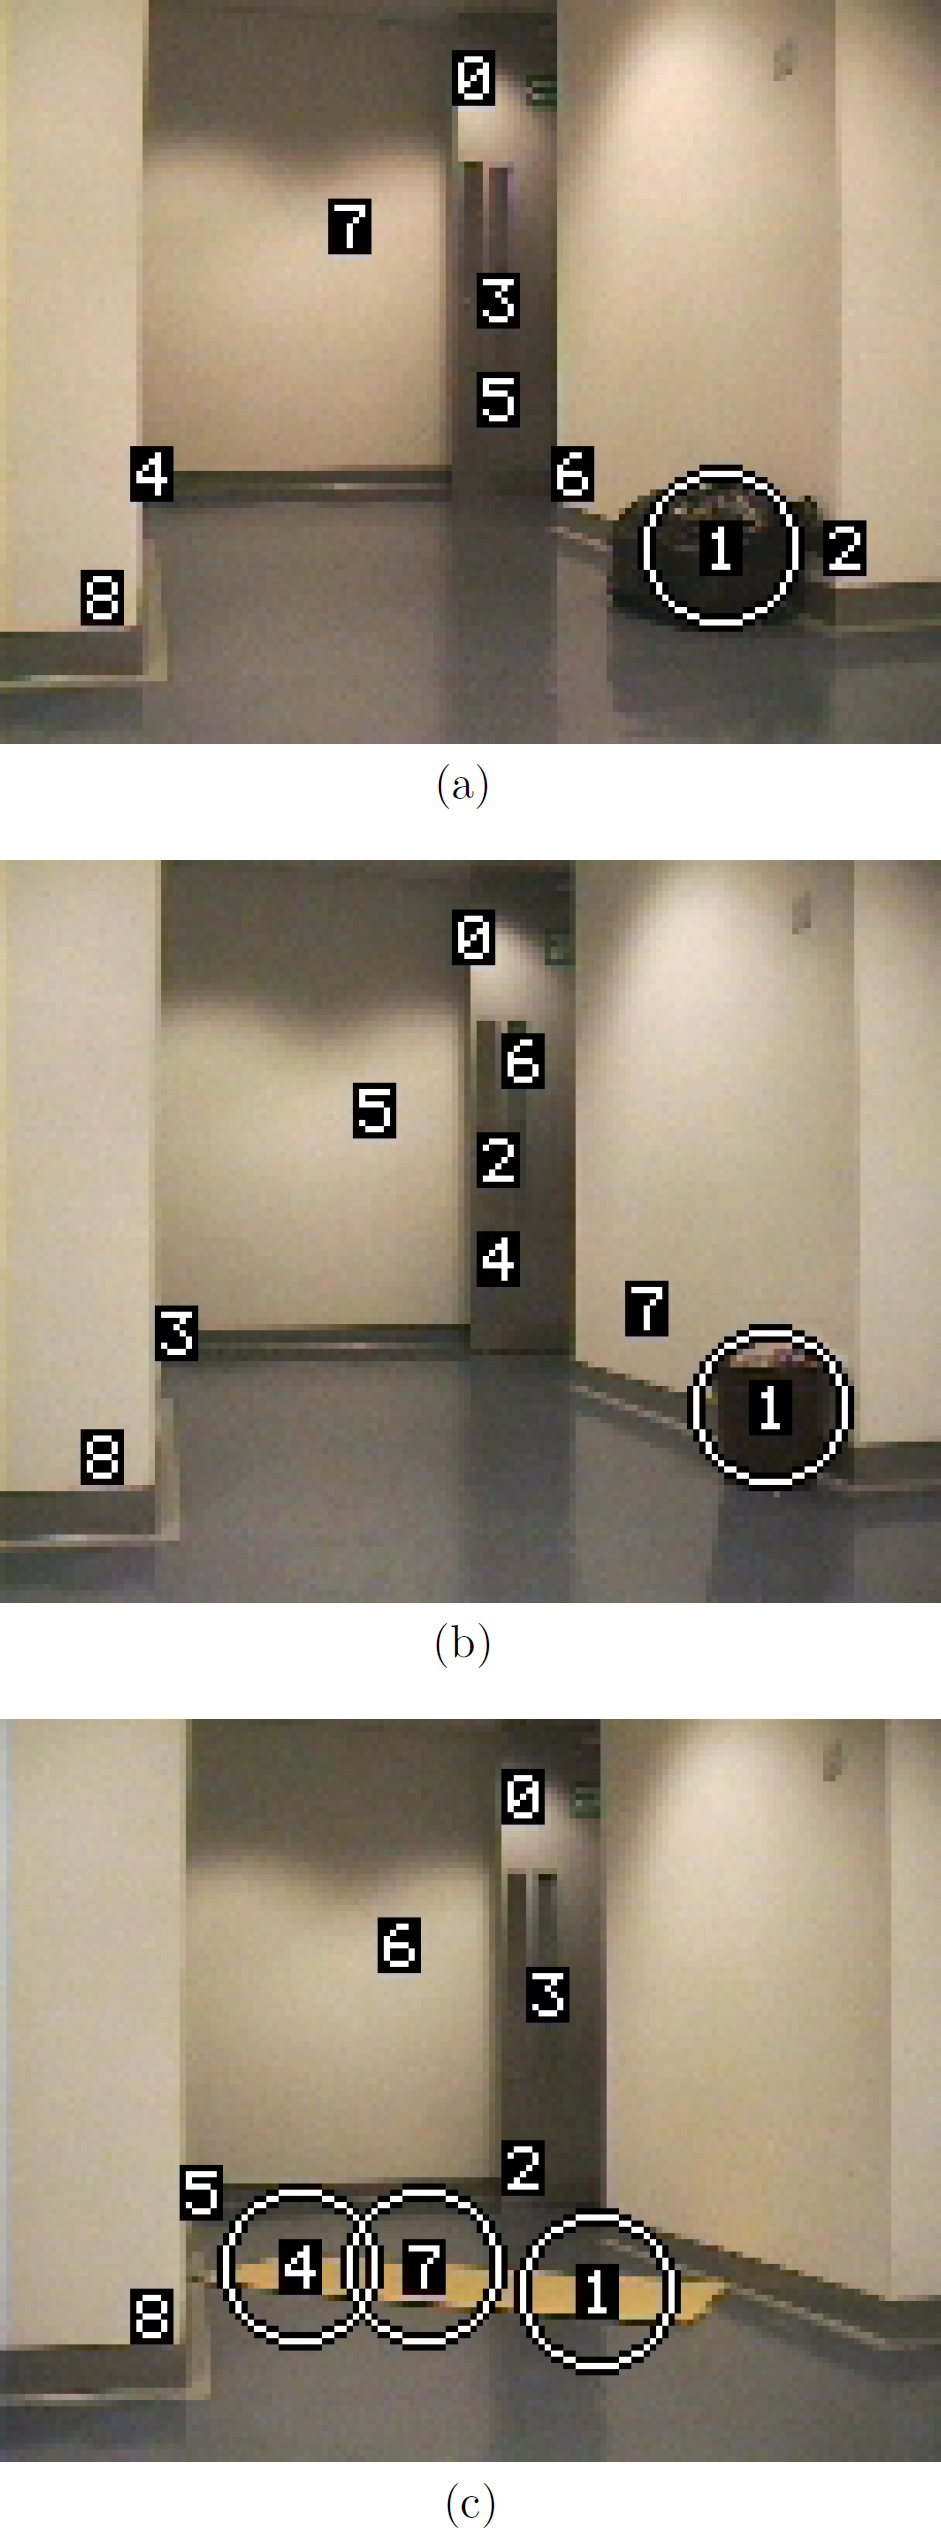
Results obtained with the visual novelty detection mechanism in experiment 4: (a) the black rubbish bag as new object; (b) the dark brown bin as new object; and (c) the yellow wooden board as new object. The output shown in (a) and (b) was identical for both approaches, but the output shown in (c) was provided by the incremental PCA approach, as the GWR-based approach did not label region 4 as novel.
In all experiments the novelty detectors produced a statistically significant correlation between system response and actual ground truth. In other words, they both worked as desired. Tables 1, 2, 3 and 4 illustrate the strength of this correlation.
Although the strength of the association measured by Cramer's V and the uncertainty coefficient U are not all that close to 1 in some situations, the results have to be understood as “very conservative” for two reasons.
First, if the consistency of novelties detected between successive image frames is taken into account, it is possible to rule out most false positives (novelty detected but not present). And second, most false negatives (novelty present but not detected) can be eliminated using the fact that a single image patch within the new object labelled as new is enough to characterise the entire object as novel. Nevertheless, the values of V and U serve well to the purpose of comparing performance.
Results given by both systems are similar in performance, although the size of the models acquired by each one are very different for the set of parameters used: in experiment 1 the GWR net needed only four vectors while incremental PCA used 35; in experiment 2 the GWR net acquired a total of 18 vectors and incremental PCA 45; in experiment 3, 11 vectors were acquired by the GWR net and 47 by incremental PCA; and finally, in experiment 4, the GWR net acquired 48 vectors against 80 vectors acquired by incremental PCA. Throughout all experiments, therefore, the incremental PCA algorithm proved to be more expensive in terms of memory and computing power.
The smaller amount of vectors learnt by the GWR had always the original input dimensionality (1728 elements), while the dimensionality of the vectors acquired by incremental PCA varied from 12 to 33 dimensions. However, every dimension of the projected vectors acquired by the incremental PCA approach corresponds to an eigenvector with 1728 elements, resulting in the allocation of more memory. Also, on average, the GWR-based novelty filter performed twice as fast as the incremental PCA algorithm.
Dimensionality issues become important when we consider that the Euclidean metric was used to determine similarity between vectors. When Euclidean distance is used, a small difference between two high-dimensional vectors tend to be large in value, making it difficult to establish thresholds of similarity for high-dimensional spaces, as it is the case with the vectors acquired by the GWR network.
However, the PCA algorithm offers some advantages over the GWR mechanism. Initially, in the incremental PCA approach similarity between inputs is performed by the residual error in reconstruction from the projected space. Moreover, if a direct comparison of projected vectors is to be made, substitution of the Euclidean distance by the Mahalanobis distance can be easily implemented in the incremental PCA approach once the covariance matrix of the stored projected vectors is available as a sub-product of the method (step 7 in Algorithm 2). The Mahalanobis distance normalises the contribution of vector elements according to the covariance matrix of the data:

Another advantage of the incremental PCA approach is the ability to reduce dimensionality automatically, allowing optimal reconstruction of the original input image patch from the inverse transformation of the corresponding projected vector. Therefore, the user can evaluate which parts of the environment were actually learnt by the system. Figure 6 shows the reconstructed image patches that were acquired during experiment 2. It can be noticed that the reconstruction of the stored vectors in the GWR network resulted in averaged image patches resulting from the learning procedure (step 13 in Algorithm 1).

Reconstructed image patches acquired during experiment 2: (a) GWR network; and (b) incremental PCA.
The GWR network, however, has the advantage of building a topological map for the stored vectors, through connections between similar patterns. We have experimented with increasing the number of stored vectors in the GWR approach by raising the activation threshold aT in order to acquire a number of vectors as close as possible to the number of vectors acquired by the incremental PCA. This resulted in better reconstruction of the stored vectors, but also noticeably decreased the overall performance of the GWR-based system. As one would expect, the number of false negatives decreased, but on the other hand the number of false positives increased immensely. We attribute this effect to the use of Euclidean distance in a high-dimensional space.
We have compared the performance and functionality of two on-line novelty detection methods: one that uses an incremental PCA approach and another based on the GWR neural network. The incremental PCA approach provides slightly better overall performance, while offering advantages of embedded dimensionality reduction and good reconstruction ability, which is extremely useful in assessing which parts of the environment were actually learnt by the system, at the cost of higher memory and computing power requirements.
The difficulty in evaluating similarity between inputs in high dimensions using Euclidean distance normally forces the system designer to use an additional preprocessing stage, such as the use of colour statistics (Vieira Neto and Nehmzow, 2004, Nehmzow and Vieira Neto, 2004), for dimensionality reduction when using the GWR network. On the other hand, the GWR approach offers the functionality of constructing a topological relationship between inputs. Future investigations aim at combining the embedded dimensionality reduction feature of the incremental PCA with the topological construction algorithm of the GWR network using the Mahalanobis distance as a measure of similarity between patterns.
Considering the overall system functionality, the attention mechanism plays an important role in generalisation by providing image patches that are robust to translations and therefore reducing the number of stored vectors. Alternatives for the attention model that also offer invariance to scale and rotation (Lowe, 2004), and also affine transformations (Mikolajczyk and Schmid, 2002) may improve the generalisation ability of the system, helping to reduce the number of stored vectors. Extensions to the incremental PCA algorithm that make it robust to occlusions (Skočaj and Leonardis, 2003) are also attractive for future investigations.
A final contribution of this paper is the introduction of a method to evaluate the performance of novelty detection systems based on contingency table analysis. A quantitative assessment can be made by the computation of Cramer's V and the uncertainty coefficient U, while the statistical significance of the association between system response and actual novelty status can be made by χ2 analysis.
Footnotes
Acknowledgements
Hugo Vieira Neto is sponsored by the Brazilian Government through CAPES Foundation and UTFPR, whose support is gratefully acknowledged.
1
Both V and U are close to 0 for very weak associations, and 1 for perfect associations. The closer U and V are to 1, the better the performance of the novelty detector under investigation.