
Abstract
In this paper, an extension of the interscale SURE-LET approach exploiting the interscale and intrascale dependencies of wavelet coefficients is proposed to improve denoising performance. This method incorporates information on neighbouring coefficients into the linear expansion of thresholds (LETs) without additional parameters to capture the texture characteristics of this image. The resulting interscale-intrascale wavelet estimator consists of a linear expansion of multivariate thresholding functions, whose parameters are optimized thanks to a multivariate Stein's unbiased risk estimate (SURE). Some experimental results are given to demonstrate the strength of the proposed method.
Keywords
1. Introduction
During the last decade, image denoising has undergone dramatic improvement; lots of new methods based on wavelet transforms have emerged for removing Gaussian noise. A standard methodology proceeds by wavelet transforming the image, operating on the transform coefficients with nonlinear estimation functions, and then inverting the wavelet transform to obtain the denoised image. The choice of estimation function is an essential part of the denoising problem. Estimation functions generally take the form of “shrinkage” operators that are applied independently to each transform coefficient (e.g., [1–4]), or are applied to the neighbourhoods of coefficients at adjacent spatial positions and/or from other sub-bands (e.g., [5–16]). As demonstrated by several algorithms presented in the above literature, the performance of image-denoising algorithms can be improved significantly by taking into account the statistical dependence between interscale and intrascale coefficients. Figure 1 illustrates the statistical dependence between interscale and intrascale coefficients.
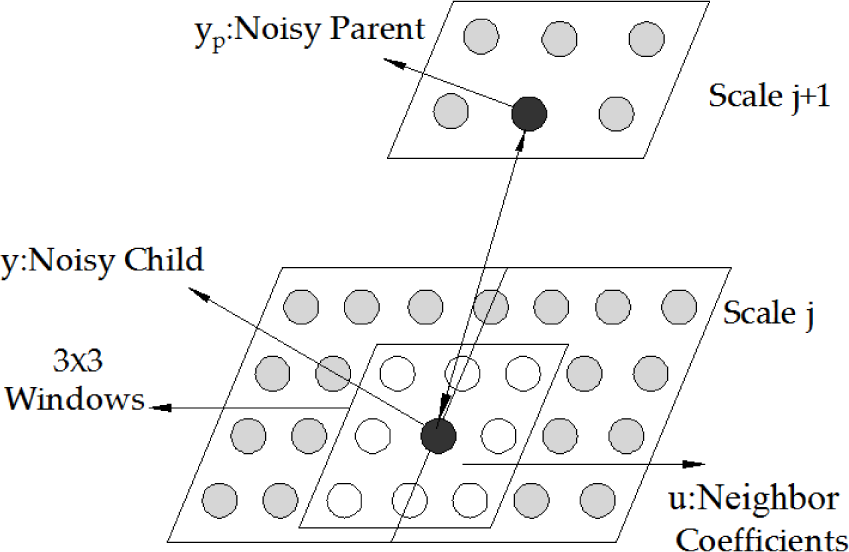
Illustration of the Parent-Child Relation and 3×3 Neighborhood Window
Image denoising can be accomplished by many different approaches. For example: using a prior model for the transform coefficients or using a parametric form for the estimation function. Generally, the generalized Gaussians [7, 11], scale mixtures models [13], Bessel K densities [17], and symmetric alpha stable densities [18], have been used as prior models for the transform coefficients, which may be used to drive a Bayes-optimal estimator such as a MAP or MMSE estimator. Alternatively, one may directly assume a parametric form estimation function, such as [6, 8, 9, 19, 20], and select parameters by optimizing performance under certain conditions. In [8, 9], Luisier et al. introduced a new SURE [21] approach to image denoising – interscale orthonormal wavelet thresholding – which parameterized the denoising process as a sum of elementary nonlinear processes – LETs – with unknown weights instead of postulating a statistical prior model for the wavelet coefficients, and then adaptively optimized the parametric estimator by minimizing SURE, which provides an approximation of the mean squared error (MSE) as a function of the observed noisy data. Risk minimization and unknown weights' estimations ultimately come down to solving a linear system of equations. However, they only took into account interscale dependency using an interscale prediction model group delay compensation (GDC), and they disposed of intrascale dependency. Their experimental result demonstrated that, for most of the images, the interscale SURE-based approach is competitive in relation to the best techniques available that consider orthonormal wavelet transforms. However, it should be noted that this approach did not obtain good performance for images with substantial textures, such as the Barbara image. The main reason for this is that some local information (especially the texture of Barbara's trousers) is completely lost at coarser scales. Interscale correlations may be too weak for this image, which indicates that an efficient denoising process may require intrascale information as well. For other denoising methods, the reader is referred to [22, 23] and the references cited there.
In this paper, we propose a multivariate SURE-LET approach to orthonormal wavelet image denoising as an extension of Luisier's bivariate approach. This method incorporates information on neighbouring coefficients into the LET without additional parameters to capture the texture characteristics of this image. The resulting interscale-intrascale wavelet estimator consists of a linear expansion of multivariate thresholding functions, whose parameters are optimized thanks to multivariate SURE. This paper is organized as follows: In Section 2, we explain the multivariate SURE theory for a neighbourhood vector and generalize the corresponding linear parameterization strategy. In Section 3, the competitive results with the best up-to-date algorithms will be shown. The conclusion can be found in Section 4.
2. Multivariate SURE-LET
Let gk,

where nk are i.i.d. normal random variables with a mean zero and variance σ2 independent of gk. Let

For facilitation, we will drop scale j and the orientation o indexes, change the spatial indexes

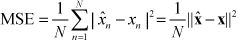
which will minimize the MSE defined by:
where
2.1 Unbiased Estimate of the MSE
It seems impossible to compute the ‖


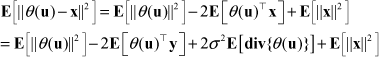
Then, under the additive white Gaussian noise assumption:

where Γ = σ2


where ‖·‖ F is the Frobenius norm. In this multivariate context, Stein's principle [21] can be expressed as:

where

is an unbiased estimator of the MSE, i.e.:
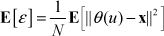
where
Since the noise
The expression in equation (2.12) may be evaluated on a single observation
2.2 The Multivariate SURE-LET Approach
Similar to the LET of [5, 8, 9], we build a linearly parameterized multivariate estimation function incorporating information on neighbouring coefficients of the form:

Here,

where we have denoted by
The MSE estimate ɛ is quadratic in

where we have defined:


Finally, the minimization of (2.14) with respect to

Note that since the minimum of ɛ always exists, it is ensured that there will always be a solution to this system. When rank(
2.3 The New Inter- and Intrascale Thresholding Function
To compensate for feature misalignment between child coefficients and parent coefficients, we will also use the GDC scheme [8, 9], which builds an interscale predictor out of the low-pass sub-band at the same scale. Let ypn denote the value of the GDC output, which can be interpreted as a discriminator between high SNR wavelet coefficients and low SNR wavelet coefficients, corresponding to the noisy coefficient yn. A Gaussian smoother function proposed in [8, 9] is chosen, namely the decision function:

where T = √6σ is the universal threshold.
In order to incorporate information on neighbouring coefficients into the LET without additional parameters, we propose the following pointwise radial exponential function:

Here, d is the dimension of vector
By joining the interscale predictor and multivariate SURE-LET approach, we lead to the following general inter- and intrascale thresholding function:

Here,
We can summarize our denoising algorithm as follows:
Perform a J level DWT to the noisy image For each sub-band (except the low-pass residual), compute the interscale predictor {ypn}1≤n≤N using the GDC approach [8, 9]. Compute the {‖ Determine Sub-band adaptive image denoising using (2.20). Reconstruct the denoised image from the processed sub-bands and the low-pass residual.
3. Numerical Experiments
In what follows, we carried out all the experiments on 8-bit greyscale test images of sizes 512×512 and 256×256, as presented in Figure 2. The test images were obtained from the same sources, as mentioned in [8, 9, 11]. We applied our multivariate SURE-LET (abbreviated as MuSURE-LET) algorithm according to the expression (2.20) with K = 3, after four or five decomposition levels (depending on the size of the image) of an orthonormal wavelet transform (OWT) using the standard Daubechies symlets with eight vanishing moments (sym8 in MatLab). A good estimator for σ is the median of absolute deviation (MAD) using the highest level wavelet coefficients [2], as follows:

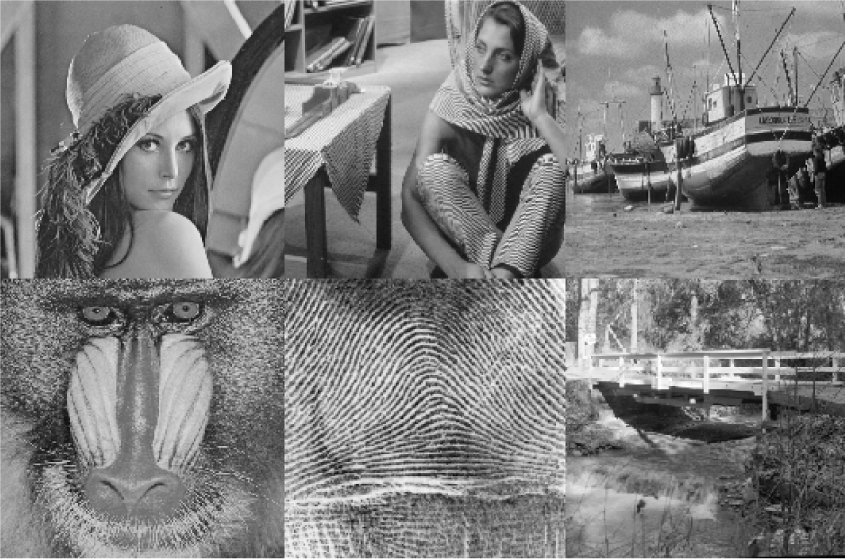
The test images used in the experiments, referred to as ‘Lena’, ‘Barbara’, ‘Boat’, ‘Mandrill’, ‘Fingerprint’ and ‘Bridge’ (numbered from left to right and top to bottom)
Here, sub-band HH is the finest scale wavelet sub-band in the diagonal direction. The denoising performances are measured in terms of a peak signal-to-noise ratio (PSNR), defined as:

where N is the total number of pixels and wn = x˜n – xn.
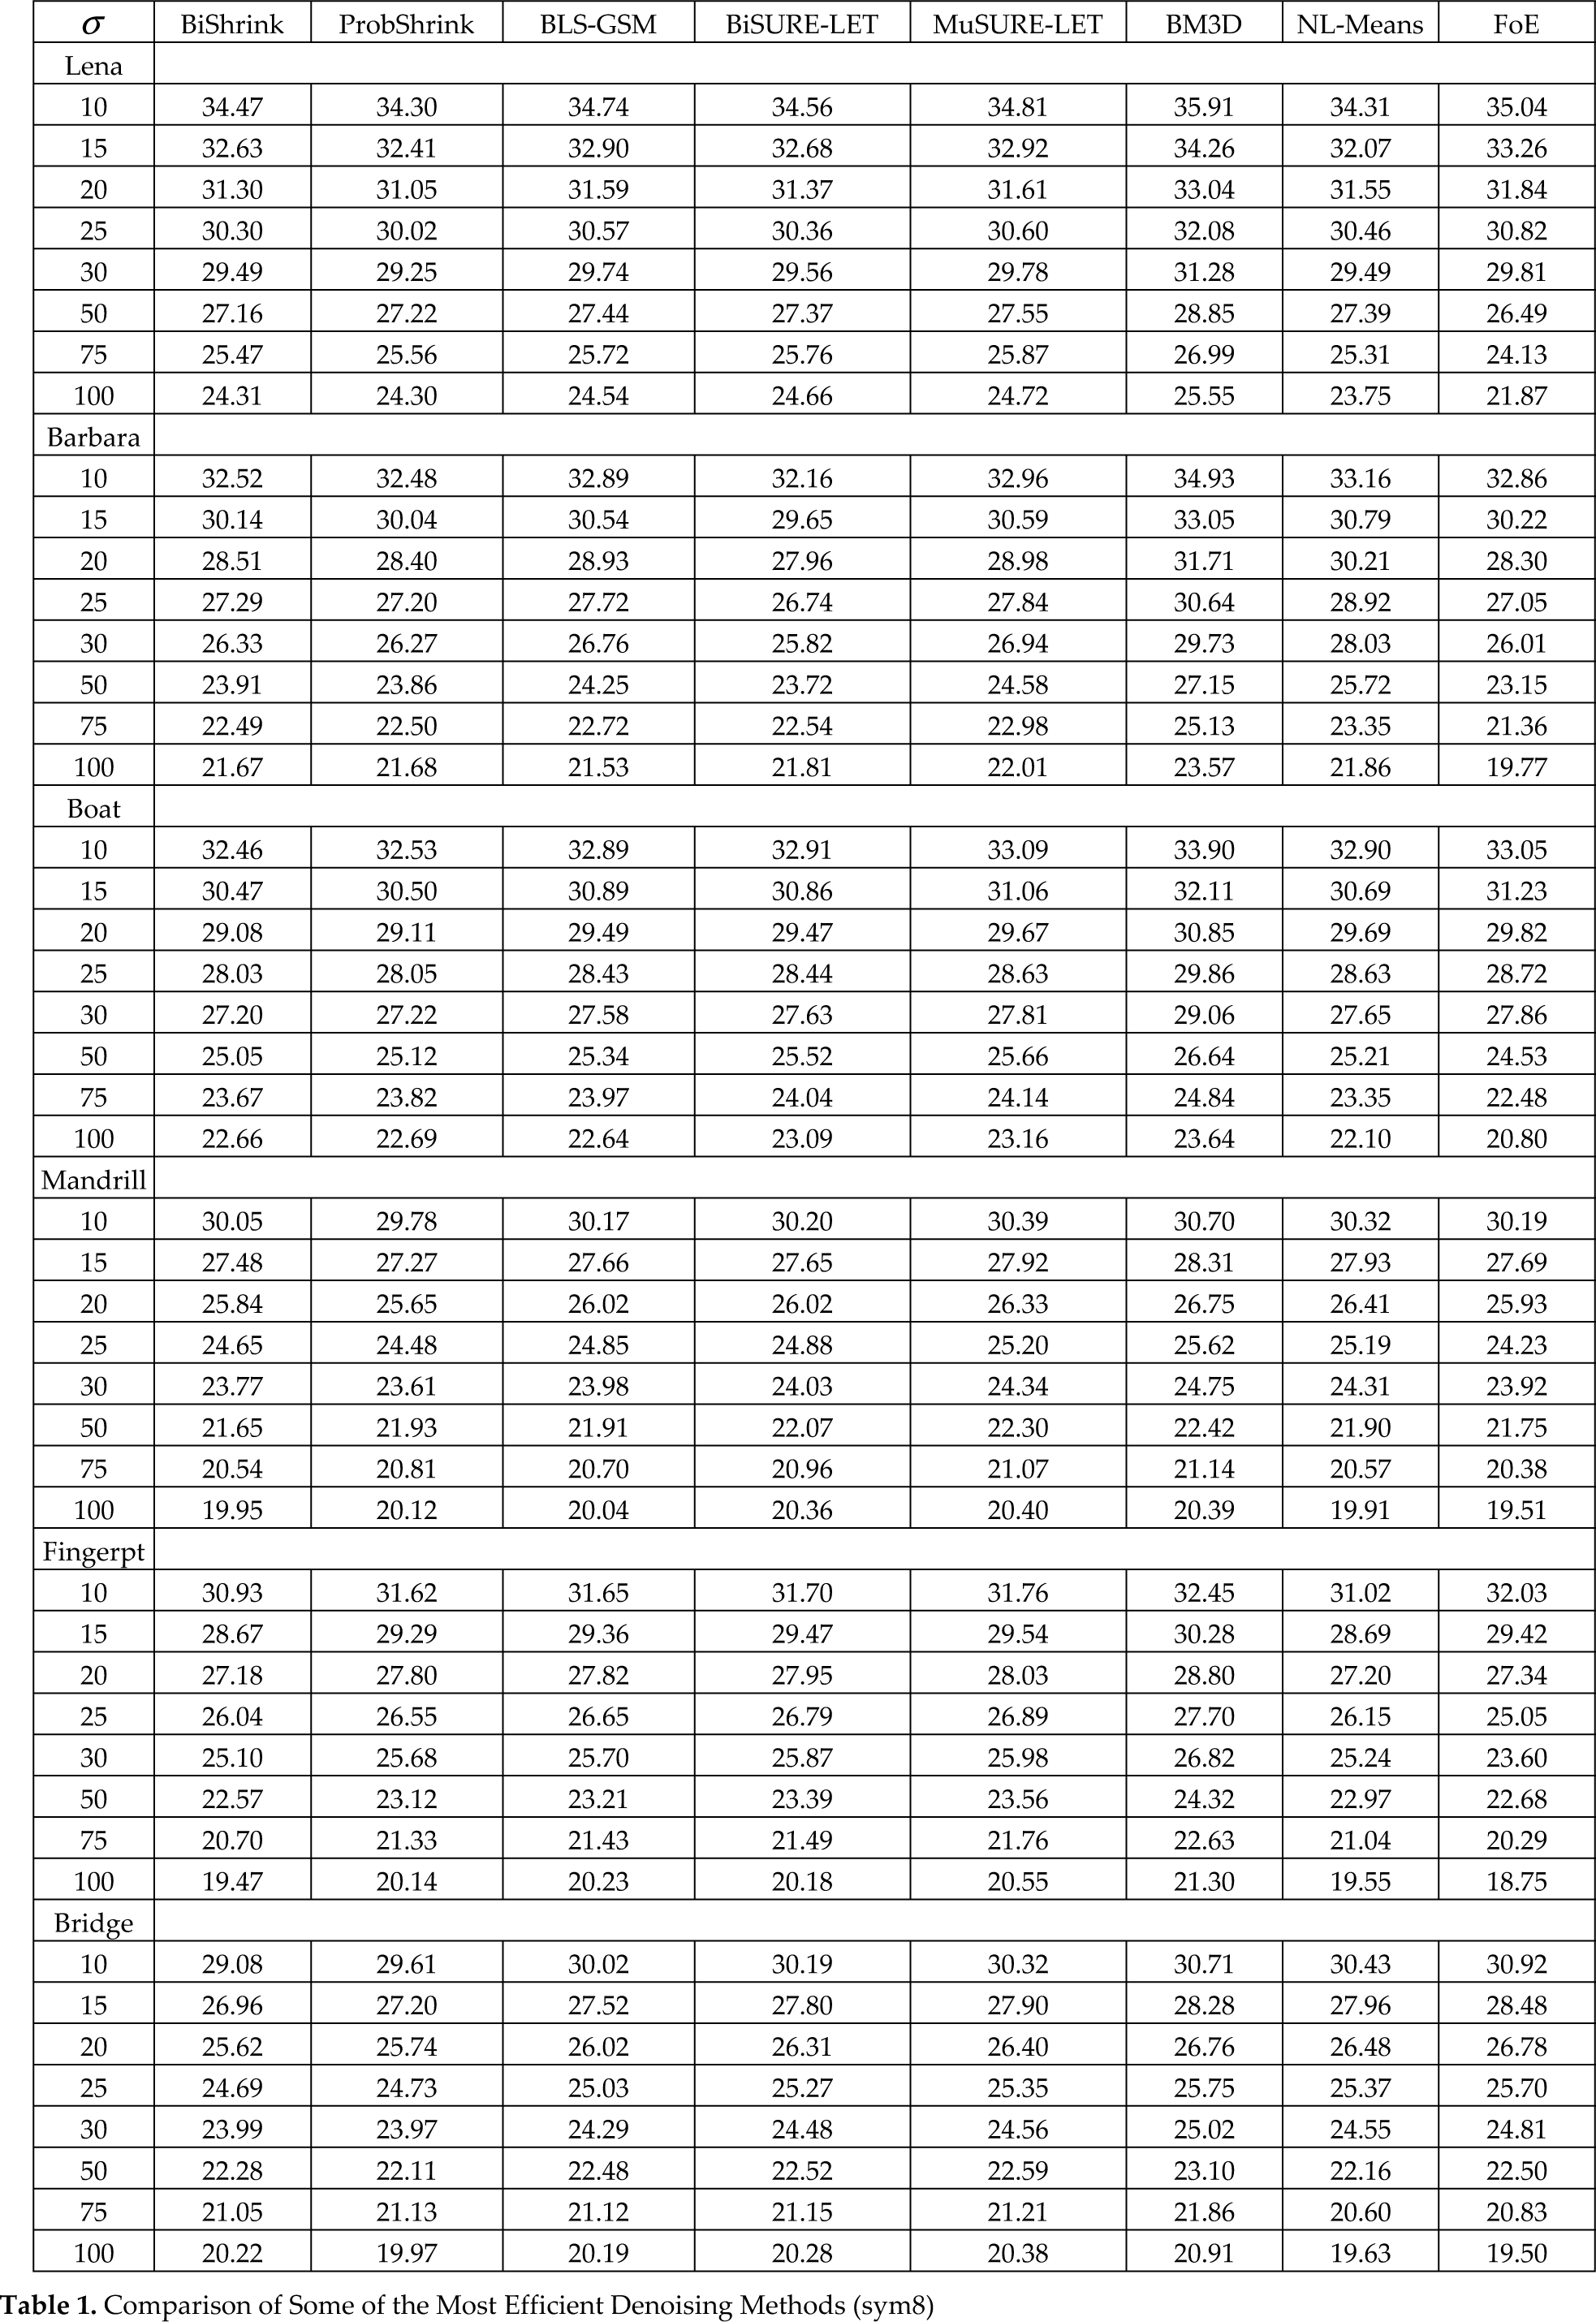
The window size is dependent on the abundance of the textures of the example images. In our experiments, the window size 7×7 yields the best results for those images with substantial textures, while the window size 3×3 yields the best results for those images with less detailed textures. Table 1 shows the error variances of the denoised images, expressed as the PSNR defined in (3.2), at eight different power levels σ ∈[10,15,20,25,30,50,75,100]. Note that, for all the images, there is very little improvement at the lowest noise level. This makes sense, since the “clean” images in fact include quantization errors and have an implicit PSNR of 58.9 dB.
Comparison of Some of the Most Efficient Denoising Methods (sym8)
3.1 Comparisons with the Interscale SURE-LET Approach
In order to understand the relative contribution of our method, we first want to evaluate the improvements brought by the integration of neighbouring coefficients' dependencies. Compared with the bivariate SURE-LET approach defined in [8,9], we can evaluate the improvements brought by our multivariate SURE-LET function (2.20) (see Figure 3). As can be observed, the integration of neighbouring coefficients' dependencies improves the denoising performance considerably. For those images that have substantial textures, such as the Barbara image, the denoising gains are up to 0.8 – 1.1 dB when the range of the PSNR values of input noisy images are in [15, 30], and for ones that have less detailed textures, such as the Lena image, the denoising gains are up to 0.2 – 0.3 dB when the range of the PSNR values of input noisy images are in [15, 30]. Figure 4 provides a visual comparison of an example image (Barbara) between the above-mentioned two methods. Our method is seen to provide fewer artefacts – for example, in parts of the forehead and hair of the woman – which means that our method can better suppress noise in the uniform areas.

PSNR improvements brought by our multivariate SURE-LET strategy compared to bivariate SURE-LET: (A) Lena image; (B) Barbara image

Comparison of the denoising results on the Barbara image (cropped to 256×256 to show the artefacts): (A) Part of the noise-free Barbara image; (B) Part of the noisy Barbara image: σ=30, PSNR = 18.59 dB; (C) Result of the BiSURE-LET: PSNR = 25.82 dB; (D) Result of the MuSURE-LET: PSNR = 26.94 dB.
In order to understand the relative contribution of our method, we first want to evaluate the improvements brought by the integration of neighbouring coefficients' dependencies. In Figure 3, we compare our multivariate SURE-LET function (2.20) with the bivariate SURE-LET (abbreviated as BiSURE-LET) defined in [8]. As can be observed, the integration of neighbouring coefficients' dependencies improves the denoising performance considerably. For those images that have substantial textures, such as the Barbara image, the denoising gains are up to 0.8 – 1.1 dB when the range of the PSNR values of input noisy images are in [15, 30], and for ones that have less detailed textures, such as the Lena image, the denoising gains are up to 0.2 – 0.3 dB when the range of the PSNR values of input noisy images are in [15, 30]. Figure 4 provides a visual comparison of an example image (Barbara) with the above-mentioned two methods. Our method is seen to provide fewer artefacts - for example, in parts of the forehead and hair of the woman – which means that our method can better suppress noise in the uniform areas.
3.2 Comparisons with State of the Art Denoising Schemes
Compared with state-of-the-art denoising algorithms, for which the code is freely distributed by the authors: Bishrink (7×7) [15,16], ProbShrink (3×3) [12], BLS-GSM (3×3) [13], Block-matching and 3D filtering (BM3D) [25], Non-local Means (NL-Means) [26] and Field of Experts (FoE) [27, 28]. Since the versions of the noise standard are not on a unit level, we have averaged the output PSNRs over eight noise realizations so as to apply the same noise realizations to different algorithms.
Table 1 reports the PSNR results we obtained with the various denoising methods, the best results being shown in boldface. As we can see, our algorithm (Multivariate SURE-LET) matches or overmatches the other methods' results for most of the images. Noisy (σ=60) and denoised fingerprint and mandrill images are shown in Figures 5 and 6, respectively.
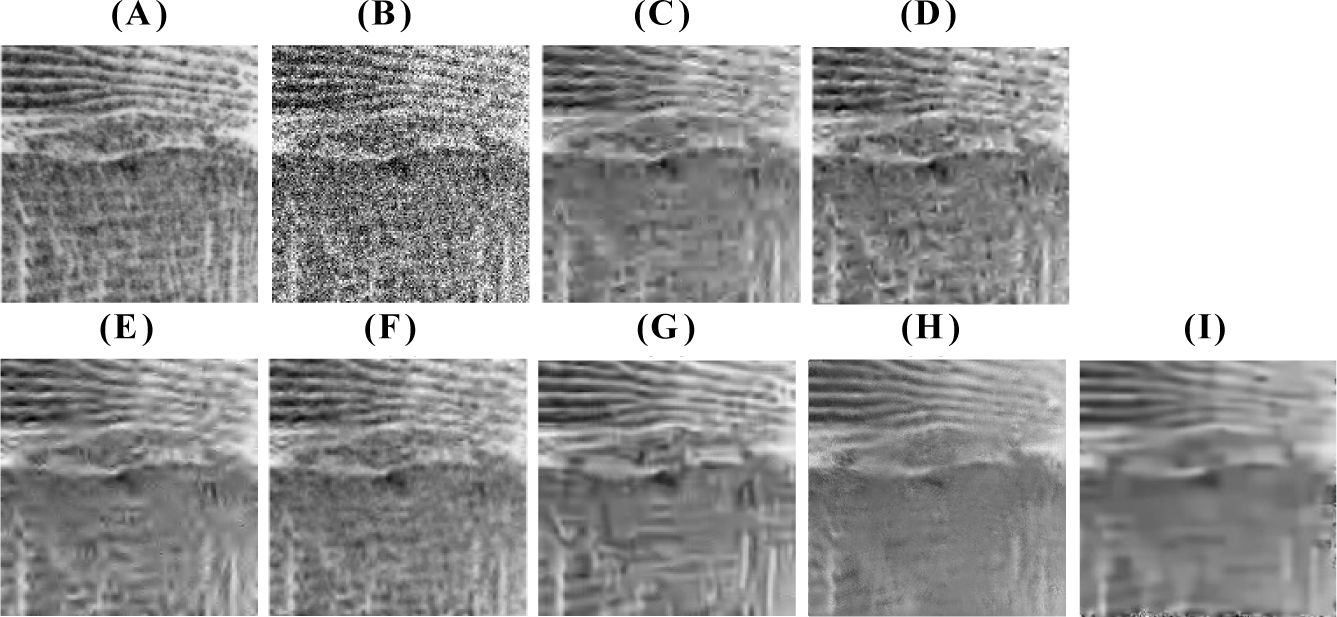
Comparison of the denoising results on the Fingerprint image (cropped to 200×200 to show the artefacts): (A) Part of the noise-free Fingerprint image; (B) Part of the noisy Fingerprint image: σ = 60, PSNR = 12.57 dB; (C) Result of the BiShrink: PSNR = 21.71 dB; (D) Result of the ProbShrink (3×3): PSNR = 22.60 dB; (E) Result of the BLS-GSM (3×3): PSNR = 22.39 dB; (F) Result of the MuSURE-LET: PSNR = 22.73 dB; (G) Result of the BM3D: PSNR = 23.55; (H) Result of the NL-Means: PSNR = 22.00; (I) Result of the FoE: PSNR = 21.60.
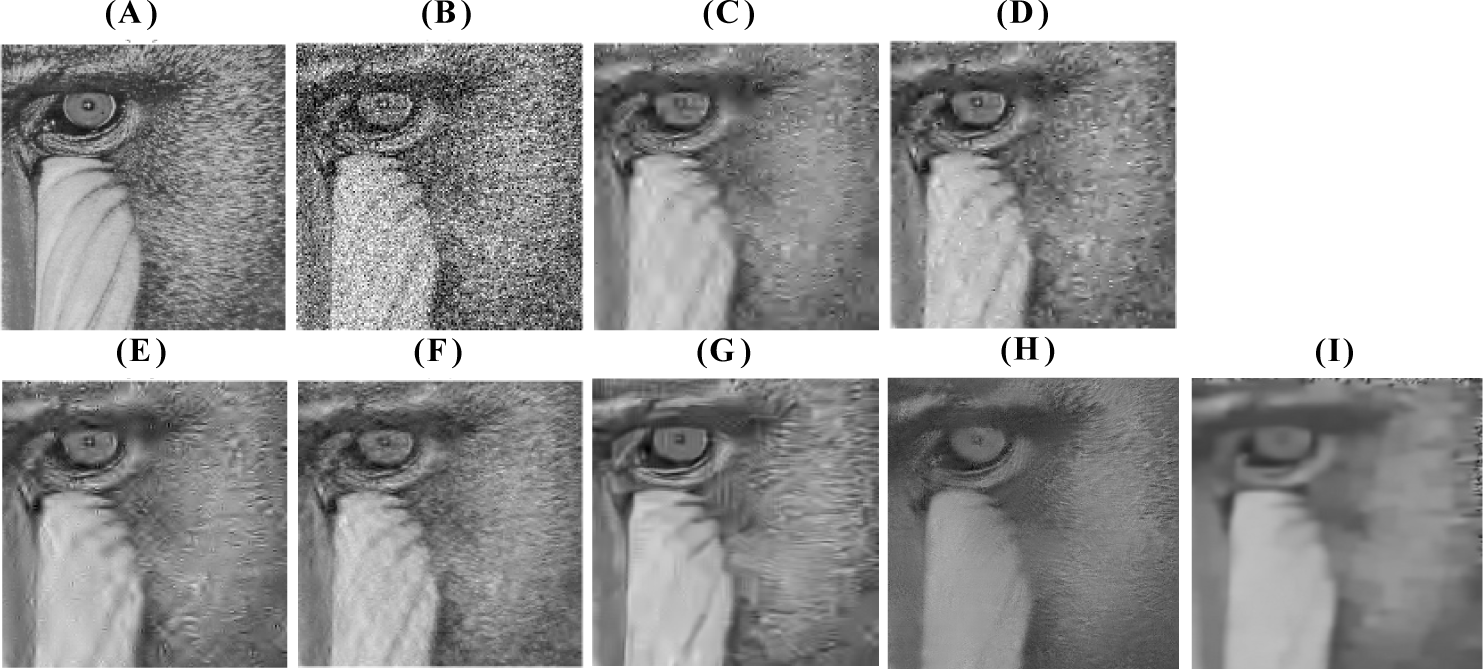
Comparison of the denoising results on the Mandrill image (cropped to 256×256 to show the artefacts.) (A) Part of the noise-free Mandrill image; (B) Part of the noisy Mandrill image: σ = 60, PSNR = 12.57 dB; (C) Result of the BiShrink: PSNR = 21.12 dB; (D) Result of the ProbShrink (3×3): PSNR = 21.48 dB; (E) Result of the BLS-GSM (3×3): PSNR = 21.32 dB; (F) Result of the MuSURE-LET: PSNR = 21.71 dB; (G) Result of the BM3D: PSNR = 21.79; (H) Result of the NL-Means: PSNR = 21.22; (I) Result of the FoE: PSNR = 21.10.
When looking more closely at the results, we observe the following.
Our method gives better results than Sendur's Bishrink 7×7, which integrates both the inter- and the intrascale dependencies (an average gain of +0.8 dB).
Our method gives better results than Pižurica's ProbShrink 3×3, which integrates the intrascale dependencies (an average gain of +0.6 dB).
Our method outperforms the Portilla's BLS-GSM 3×3 or NL-Means by more than 0.2 – 0.3 dB on average.
Our method improves the PSNR by about 0.6 dB on average in comparison with FoE.
Although the PSNR of our method is less than approximately 0.9 dB on average when compared to BM3D, the denoised images of our method are very similar to the original and qualitatively superior to BM3D (comparing (F) with (G) in Figure 5 and Figure 6).
In particular, our algorithm obtains better results for those images with substantial textures, for which the bivariate SURE-LET is not very effective [8, 9], such as the Barbara and Mandrill images.
From a visual point of view, our algorithm can be seen to provide fewer artefacts as well as a better preservation of edges and other details. These observations are clearly illustrated in Figure 5 and Figure 6.
4. Conclusions
The paper integrates the intrascale dependencies within the SURE-LET approach successfully such that, as an extension of the interscale and bivariate SURE-LET approaches in [8], the results are interesting.
The comparison of the denoising results obtained with our algorithm and with the best state-of-the-art non-redundant techniques (that integrate both inter- and intrascale dependencies) demonstrate the efficiency of our multivariate SURE-LET approach, which gave superior output PSNRs for most of the images. The visual quality of our denoised images is characterized more by fewer artefacts and a better preservation of edges and other details than the other methods.
Footnotes
5. Acknowledgements
The authors would like to thank the support of the National Natural Science Foundation of China (grant no. 61272028), the National Undergraduate Training Programmes for Innovation and Entrepreneurship (no. 201210010077) and the Science and Technology Innovation Foundation for College Students (no. pt2012064).
The authors also appreciate the help of Dr. F. Luisier, Dr. I. W. Selesnick, Dr. A. Pizurica, Dr. J. Portilla, Dr. K. Dabov, Dr. A. Buades and Dr. S. Roth for making available the codes of the methods OWT SURE-LET, BiShrink, ProbShrink, BLS-GSM, BM3D, NL-Means and FoE, respectively, on their websites.