
Abstract
To remedy the lack of mathematical programming and the Expected Marginal Seat Revenue (EMSR) model for multi-leg seat inventory control, this paper proposes a method based on passenger choice. Except for data about which seats passengers decide to opt for, there is no need to obtain distributions of passengers' demands or other “a priori” information. The proposed method can discover the real factors that affect passengers' choices, and then estimate the probabilities of seat choices and the revenue according to the weights of the factors. Simulated experiments and comparison with the shadow price method and the virtual “bucket” method confirm the feasibility and effectiveness of the proposed method in seat inventory control for multi-leg flights.
1. Introduction
In recent years, the aviation and passenger transport industry has developed swiftly with rapid economic growth. As air travel has become a common transport option in many regions, more and more people have begun to consider not only ticket prices but also other factors, such as service level and ticketing conditions, when buying tickets. At the same time, airlines have divided market segments according to the characteristics of their passengers, and have developed different levels of accommodation to meet their needs. In general, a lower class and/or a lower fare is usually attached to stronger restrictions. In this way, the airlines try to attract some travellers in pursuit of low cost while retaining passengers who are price sensitive and do not like to be highly restricted.
A consumer needs motivation to make a purchase decision, to modify the purchase programme, and finally to complete the purchase. The theoretical study of consumer behaviour concerns consumers' reactions to products, services, and marketing[1]. Consumer choice refers to the process of selecting a commodity from a group of candidates. For example, passengers select a particular class of seat from all classes in a group. The choice is sometimes based on subjective judgement. If a consumer likes a commodity, he/she is likely to choose it. Sometimes the choice is made because of the characteristics of the commodity. Consumers can either buy a product, or not buy it. There cannot be any other choice.
The traditional Expected Marginal Seat Revenue (EMSR) model, and also the seat inventory control model based on mathematical programming for the multi-leg seat allocation problem, assume that the needs of passengers follow independent normal distributions. In fact, both the EMSR model and the mathematical programming model make two important presumptions: (i) reservation needs of passengers for a certain class obey a certain distribution, and (ii) those distributions are independent of each other. However, these presumptions are not necessarily consistent with the actual situation of passenger demand in relation to real-world markets and culture.
The probability of passengers buying expensive tickets is closely related to the availability of cheap tickets, as well as utility evaluations of the available fare levels. If the available levels cannot satisfy a visitor, he/she is unlikely to purchase a ticket or select a suboptimal seat; a suboptimal seat would have to be at an available fare level with maximum utility. Clearly, analysis of passenger choice behaviour plays an important role in the decision-making process of airline sales. When a seat inventory control model is established, passenger choice behaviour and the impact on revenue should also be considered.
There are two types of research directions in passenger behaviour[2]. The first and oldest uses qualitative analysis based on passenger surveys. Here, different importance is accorded to different factors influencing passenger choice behaviour. For example, Hersh and Ladany presented a model considering the time distribution of reservations and cancellations, as well as the effects of waiting lists, standbys and overbookings; the model then constructed a Bayesian reassessment of the probabilities sequential decision procedure. Such a model accords more importance to factors such as standbys and overbookings[2]. However, such methods can only provide a qualitative reference; they cannot reveal the internal mechanism of passenger choice behaviour[3].
The other type of research uses the logit model, which represents random utility theory based on an econometric discrete choice model. In 1993, Berge and Hopperstad explored preference and passenger choice behaviour on the basis of the logit model[4]. In 2006, Wang took the logit model as a foundation and analysed cabin choice behaviour for a specific service and a particular type of passenger[5].
2. Multi-leg Seat Inventory Control with Passenger Choice
2.1 Multi-leg seat inventory control problem
After American deregulation in the 1970s, the emergence of fare levels lead to the seat inventory control problem becoming a focal issue. When airlines can offer their service at many fare levels with revenues equal to costs, this is sometimes known as multi-class ticketing[4]. The different fare levels correspond to several demand aspects such as departure time, ticket price and service. However, assigning the seats at different fare levels to successfully maximize revenue then becomes a hard nut to crack for airlines.
In the early days, airlines usually carried out economic analysis on the basis of legs travelled[6]. However, the summation of maximized income of the individual legs is usually not equal to the line income for a multi-leg airline, because the legs are usually mutually conflicted[7].
Maybe a flight starts from A and arrives at C via B (Fig. 1). So there are two legs AB and BC, and three segments AB, BC and AC. Assume that the three segment fares are US$ 700, US$ 500 and US$ 1000, respectively, where each segment has only one ticket class. If one seat can be sold at A, selling the ticket to an AC segment passenger can make sure the revenue is maximized (the revenue will be US$ 1000). However, if there are sufficient passengers in the AB segment and BC segment, the airline will lose the opportunity to sell two tickets to AB and BC passengers, i.e., the company incurs a loss of revenue (the revenue could be US$ 700 + US$ 500 instead of US$ 1000).

Leg revenue and line revenue (US$)
At present, there are a lot of multiple segment lines in China's domestic market. There are, generally, three segments. Although the number of segments thus is not large, the classes are complicated in every leg. The problem of seat allocation becomes challenging due to the compilation of segments and series of classes, especially when each class affects the others[6].
2.2 Multi-leg seat inventory control model with passenger choice
Preference and utility are basic concepts to describe the choice behaviour of the consumer. By attaching some reasonable assumptions to preferences, one can immediately obtain a utility function. Through analysis of utility functions, we can establish mathematical models. The application process of passenger choice behaviour is shown in Fig. 2.

Flow chart of passenger choice
2.2.1 the passenger utility analysis
Preference refers to judgements and evaluations when comparing two or more options. Sometimes preference is based on subjective attitude and sometimes on objective features or characteristics of two or more products[8]. The utility of a good or a service is justified in the mind of a consumer in that it meets his/her desires or needs; the relationship can also be related to pleasure or pain. Utility value is related to objective performance or service level of a product as well as a consumer's subjective evaluations of efficacy or quality of service. It is usually assumed in microeconomics that consumer choice always pursues maximization of utilities. Measurement of rational utility functions of various classes of passengers is the foundation of seat inventory control for airlines.
In the air transportation market, passengers travel for different purposes and/or at different preferred cost. This leads to different levels of demand among different types of passengers, and thus different classes of utility evaluation. Therefore, what are the factors affecting their selections?
For example, in the Chinese domestic market, the flight fares of business passengers are generally paid by enterprises or organizations. These organizations are concerned mostly with maximizing production time, not the ticket price. Their schedules may be frequently and suddenly changed. Meanwhile, a high level of service is needed, i.e., most such passengers prefer to be in the first and business class cabins. Leisure passengers, with more stable schedules, advance booking and fewer journeys, often buy tickets at their own expense. They are more sensitive to price, but less sensitive to temporary changes in flight schedule and cabin conditions[9]. Airlines usually make rules and restrictions for different types of passengers to prevent those who are able to purchase at higher price levels from buying cheap tickets. Common restrictions include: (1) advance ticket limit, (2) restrictions on refunds and changing flights, (3) departure time limit, (4) Residence time limit (5) visa restrictions, (6) alternate boarding restrictions. Each level or class may contain only some of these restrictions.
2.2.2 The seat inventory control model
A common way of measuring utility for passengers is the degree of satisfaction they demand at each level. Price and other restrictions mean utility evaluations are different for different passengers. In the following, utility function is used to represent the evaluation of passenger choice behaviour.
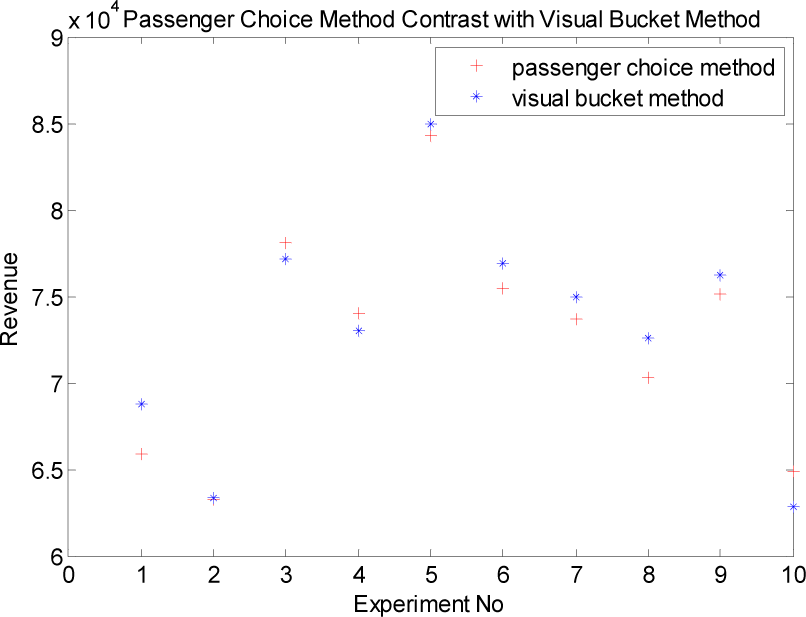
Suppose there are N legs and M fare levels on a given flight route. There are MN ODFs (i.e., combination of origin, destination and fare grade), and Ω is the sum of all ODFs. ODF passenger utility can be represented by a linear equation including its characteristic attributes, such as departure and destination, price, advance ticket restrictions, and refund and change restrictions:

where UODF represents the utility of an ODF product for one passenger. Larger UODF means larger purchasing probability. K is the number of attributes of a certain ODF. XODF,k represents the k-th attribute of the ODF (all the attributes are taken from surveys[6]). λK is a coefficient to be determined to illustrate the share of XODF,k; in other words, λK represents the weight of a certain attribute. When a passenger chooses an ODF, he/she will make the decision based on the specific weights he/she accords to each of the attributes connected to this ODF. ΣODF is a random variable obeying the Gumbel extreme value distribution, independently.
Passengers usually rationally select the largest ODF utility available to them. The probability is as follows:

where figures for εODF are independent of each other and obey the Gumbel extreme value distribution. Thus,

Using Equation 3 we can find the probability of each possible choice (PODF). The possible passengers can then be calculated for each ODF. We can use the weight λK for each attribute to find the PODF, according to the maximum likelihood estimation method.
Assume that the overall passenger demand is C and CODF is the ODF choice demand,
When purchasing tickets, each passenger can only buy a ticket for a CODF, so the purchasing behaviour of CODF th passengers can be seen as CODF times Bernoulli experiment. The demands related to selecting from MN ODFs are C ODF1, CODF2,…, and C ODFMN. The maximum likelihood function is therefore as follows:

where
Pi is the probability of choosing ODFi, and the logit for L is defined as Logit(L):

After the constant part of equation (6) is removed, e.g.,

Solving Equation 7, we obtain: λ1, λ2, …, λk. Substituting λ1, λ2, …, λk into Equations 1 and 3, we obtain utility and probability for each ODF.
We can calculate the share level fares for each ODF by using the method presented by Dong, where level fares are distributed based on shadow prices and prorate distribution in segments' O&D combinations[9]. We can then sort all ODFs by their share of the respective level fares, from highest to lowest, stamping them S,S-1,…,1, where S=MN. According to the famous nesting rule[10], we can book a limited number of seats for every ODF. For example,

where C is the total demand for all ODFs, as in Equation 4, and Ca is the total seats on the flight. C*Pi is the demand for ODFi, P0=0, k,i=S,…,0.
After determining the probabilities of passengers selecting various fare levels or classes, we can obtain the revenue R as in Equation 9, where fi is the real fare of the ODFi fare level.

3. Numerical Simulation and Results
The experimental data was taken from a Chinese domestic route, Guilin(A)---Shenzhen(B)---Sanya(C). The total number of seats was 140. There were three segments, AB, BC and AC, and two legs, AB and AC. Every segment had three fare levels, shown as y, q, and v. Each ODF's fare and demand is listed in Table 1.
Fare level and demand of ODFs

The utility function is established according to the factors fares, advance booking restrictions, change restrictions, etc.

where Xi,1 is the attribute of ODFi, Xi,2 is the constraint attribute of ODFi on the condition of purchasing tickets in advance, and Xi,3 is the constraint attribute of ODFi on the condition of changing tickets. εi is a random variable obeying the Gumbel extreme value distribution. We applied maximum likelihood estimation to calculate the factors as follows:

Then, Equation 10 becomes:

A total of 100 questionnaire surveys were distributed. There were 20 valid questionnaires. The scores are shown in Table 2. The figures under “No.” in Table 2 are consistent with those in Table 1.
Scores for ODF attributes

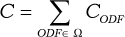
Thus, through Equations 3, 8, 9 and 11 we obtain the probability of choice and the booking limit for each ODF. Sorted by the booking limit, we obtain Table 3:
Probability of choice and booking limit
We thus obtain the booking limit numbers for the ODFs: 140, 125.58, 89.964, 103.544, 61.642, 34.02, 117.264, 73.696, 23.548. Because the number of seats to be sold can only be an integer, these are rounded to: 140, 126, 90, 104, 62, 34, 117, 74, 24).
For comparison, the booking limit number is then recalculated by the shadow price method and the bucket method. This yields the following respective results: 140, 129, 103, 109, 61, 52, 129, 89, 21 and 107, 97, 32, 140, 132, 67, 107, 92, 22.
Next, 10 groups of random numbers are generated by Matlab software to simulate the passenger choice procedure. This obtains simulation data for every ODF, as shown in Table 4.
Booking of each ODF

We then compare the average revenue using the passenger choice, shadow fare and bucket methods, respectively. For the same passenger arrival procedure shown in Table 4, the above three methods obtain different results and different revenues, as shown in Table 5. It is easy to see that the average revenue with the passenger choice method is the lowest given by any of the three methods.
Revenue comparison using three methods

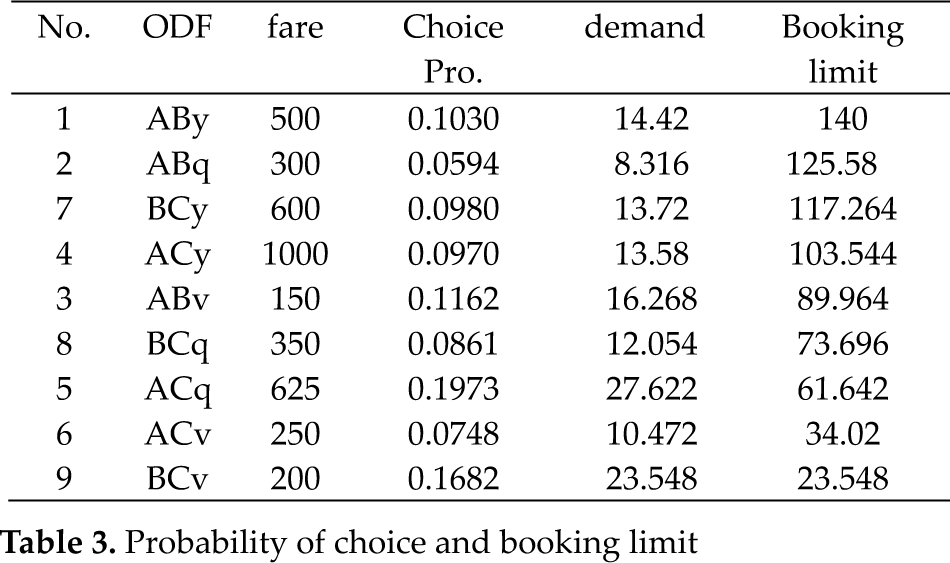
Scatter plots were also made, as shown in Fig. 3 and Fig. 4. From Fig. 3, we can see that the passenger choice method resulted in a lower EMSR than with the shadow price method, in general. Similar results can also be seen in Fig. 4. In 10 trials, the passenger choice method obtained a higher revenue figure only three times.
To sum up, this paper has assessed the use of passenger choice behaviour in solving the multi-leg seat allocation problem. The revenue yielded by this method is lower than by the shadow price method and the virtual “bucket” method. However, customers' needs are better met and the loss of revenue is insignificant.

Results of passenger choice method and shadow price method in 10 trials
Results of passenger choice method and the visual “bucket” method in 10 trials
Although this method does not increase revenues, it can be important for airlines' product design and route network planning. It allows airlines to meet passenger demand in more detail, thereby reducing the direct contradiction between the interests of airlines and passengers while cultivating passenger satisfaction and loyalty.
4. Conclusion
This article has considered the impact of subjective passenger factors on multi-leg seat inventory control. Through analysis of passenger utility and preferences, a discrete choice model was built, and parameters were evaluated by estimation. Although an inferior experimental result is obtained compared to the shadow fare method and the virtual “bucket” method, the passengers' choice does need to be introduced into approaches to multi-leg seat inventory control. The passenger choice method proposed in this paper can be further improved, for example, by using more scientific analysis of flight characteristics, and/or a rough set method.
Footnotes
5. Acknowledgements
The authors acknowledge the support given by the United Funds of the Civil Aviation Administration of China and the National Natural Science Foundation (NSFC) under Grant No. U1333109.