
Abstract
Call centres rely heavily on the self-service paradigm through the use of an automated IVR (Interactive Voice Response) system. The service time delivered by the IVR is a major component of the overall QoS (Quality of Service) delivered by the call centre. We analyse the structure and service times of IVR systems through a case study of five call centres in the telecommunications sector. The service trees of the call centres under survey are reconstructed by complete exploration and analysed through a set of metrics. The present design of service trees leads to service times typically larger than those spent waiting for a human agent and to excessively long announcements, with a negative impact on the overall QoS. Imbalances in the popularity of the services offered by the IVR can be exploited to reduce remarkably the average service time, by properly matching the most popular services with the shortest service times.
1. Introduction
Call centres are now an established way of managing the relationship with customers. Though determining their number is a difficult task, a recently reported estimate is of about 300000 all over the world, with continuous growth [1], since it can be envisaged that companies and institutions alike will choose call centres as a primary means of CRM (Customer Relationship Management).
A typical call centre is set up to provide a number of services to customers, which may vary in type from providing simple information to gathering and dealing with complaints to more complex transactions. In any case, an interaction takes place between the customer and the call centre, which has to provide answers to the customers' queries. The interaction may be managed by a fully automatic system (the so-called Interactive Voice Response, or IVR for short, system) or require the intervention of a human agent (typically named Customer Service Representative, CSR).
Customer satisfaction, as evaluated over the full service cycle, is of paramount importance in judging the overall call centre quality, which has a number of dimensions [2],[3]. A highly simplified approach is taken in [4], where the service quality is measured along two dimensions: qualitative (psychological) and quantitative (operational). The former relates to the way in which the service is provided and perceived (usefulness of answers, friendliness of the agent, etc.) [5]. The latter relates more to service accessibility. As to the latter issue, the QoS is typically embodied by a single parameter, that is the time spent waiting for the agent, though the quality level can be defined through several constraints, e.g., on the average waiting time or one or two of its percentile values. In this context, the most important impact of the desired quality level is to require a proper level of staffing; the definition of a proper dimensioning procedure on the basis of the desired waiting time has spurred a large number of research efforts [6].
However, if the interaction with the customers takes place also through automated systems rather than by human agents alone, we cannot focus just on the time spent waiting for the agents. In this case, many answers are provided directly by the IVR, and so the time spent within the IVR becomes relevant for the overall service quality. In today's call centres the IVR is becoming increasingly important: the usage of IVRs accounted for 38% of all calls handled in 2000, with a growing trend to over 70% in 2005 [7], and is typically higher in some contexts, e.g., in call centres for financial services, where the percentage of self-served calls through IVR was 65% already in 1999 [8].
The main reason for the growing reliance on IVRs is that the greater the number of services provided through that automated system, the lower the load on human agents, who can therefore be reduced in number. Streamlining the staff brings along a reduction of costs. Since staff costs in call centres are the major cost item, accounting for 60-70% of all costs, cutting them has a deep impact on the overall economics of the call centre.
However, little attention has been paid so far to the amount of time spent within the IVR. In [8], some statistics are given for the time spent navigating through the IVR, based on a measurement campaign conducted on a single call centre. In other studies, the IVR has been considered as a black box adding a constant delay [9] or as a service system providing an exponentially distributed service time [10] [11]. In those papers, no attention has been paid to the structure of the IVR and to the dependence of service time on the navigation path followed by the user through the service menus, and the probability model of service time is either assumed by hypothesis, as in [10], or absent, as in [9] - or indeed limited in scope (based on data pertaining to a single call centre) as in [8]. Instead, in [12], it has been shown that the structure of the IVR, i.e., its sequence of messages and interactions with customers, can be optimized to minimize the average service time. However, such optimization relies on the knowledge of the required set of services to be provided by the IVR. A statistical analysis of the characteristics of IVRs is then helpful to understand what input can be provided to the optimization procedure.
In this paper, we aim to provide a statistical characterization of the IVR structure (i.e., the sequence of menus and offered options through which the user is led to the desired service) along with a quantitative evaluation of the service times experienced during the IVR-aided service phase. Our analysis is based on a survey of five large call centres owned by telecommunications operators and on the choice of a set of metrics. The results allow us to perform a comparison with the service times experienced in the human-assisted phase of call centre operations and to explore the relationship between service time and the design of the service menus.
We find that the number of services varies widely in the observed sample, from a minimum of 11 to a maximum of 202, which are delivered through a sequence of announcements which can be quite long (up to eight announcements to get the desired service). We also show, by modelling the customer's preferences over the set of services through Zipf's law, that a proper matching of services to announcement sequences can heavily reduce the average service time.
The paper is organized as follows. The formal description of the service provided by an IVR is reported in Section 2. In Section 3, we describe the basic characteristics of our survey, whose results are shown in full in Section 4. Finally, in Section 5, we show how imbalances in service popularity can help optimize the average service time.
2. The service tree
Service in a call centre is accomplished through a set of procedures. Their description is essential to understand how quality targets are met or missed. In this section, we provide a graph model for the chain of action that the call centre performs (or has the user perform) when delivering its services.
After calling the call centre number, the user is typically presented first with a welcome menu through the device named IVR. This device uses a synthesized voice to drive the user through a sequence of service menus (each offering a set of options), which may culminate in final service delivery by the IVR unit itself (self-service) or in passing the call to a human agent. A schematic of the resulting service chain is reported in Figure 1 (as described in [13]), where the two-stage nature of the service process is self-evident.

Service chain in a call centre
Customers first deal with the IVR; for some of them (a growing proportion given the economic reasons stated in the Introduction) this stage is enough to get the service they required. The remaining ones are addressed to human agents through an Automatic Call Distributor (ACD). In both cases, the passage through the IVR involves a delay. The ACD monitors the working state of the human agents: if none is available, the call is put on hold and then routed to the next available agent. At any time the user can leave the service process by hanging up (an action labelled as abandonment in Figure 1). In addition, some of the calls rejected (e.g., because of the unavailability of operators or trunk lines) may reappear as retrials.
In the typical case therefore, the user will spend some time navigating through the IVR and an additional amount of time waiting in the ACD queue. The overall service time is then the sum of the two.
The portion of the overall service time due to the IVR is the result of the user going through the sequence of service options presented to him/her by the IVR. These may be properly represented by the service tree, i.e., a tree graph, composed of nodes and edges. Each node represents an announcement delivered to the user. The announcement may propose a set of options to proceed further in the service delivery (at which point the user is required to select one of the options, either via the keypad or by a vocal command) or produce the information asked for, actually ending the service. In the former case a number of edges (as many as the options) leave the node (the node degree is therefore equal to the number of options). In our representation the circle representing a node contains the time needed for the announcement reproduction. In addition, the options presented at each announcement are numbered according to the order of presentation to the customer; it is also useful to label each node for a correct identification of all the components of the service tree (see Figure 2). For convenience we have also marked each node by a label (thematic area) to identify the category to which all the options announced in that node pertain (e.g., the label Price plans in Figure 2 means that the announcement concerns the possibility of exploring different price plans and receiving information about them). Of course, this is feasible if the options pertaining to a single option are homogeneous enough. A path traversing the whole tree brings to service fulfilment, reaching one of the tree leaves (we borrow the term used in graph theory). Some leaves may actually lead to passing the call to a human agent or allowing the user to go back to the tree top, starting a new service request. A sample service tree is reported in Figure 3.

Representation of a node in the service tree
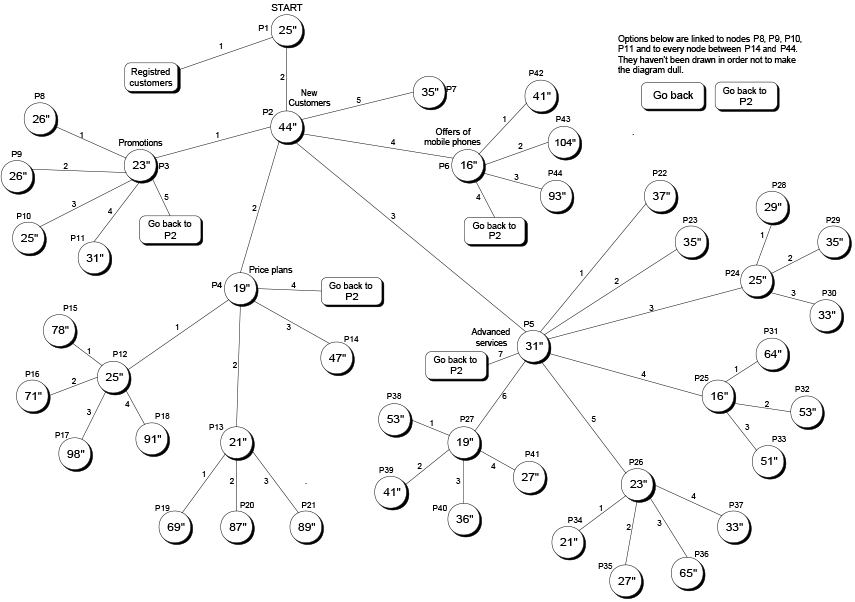
A sample service tree
In the following, we analyse the characteristics of service trees, limiting ourselves to the part of the service delivered through the IVR, i.e., the first stage of the service chain shown in Figure 1. Such characteristics may be exploited to optimize the resulting tree network [14]. We remind the reader that throughout this paper we refer to the services offered by the IVR rather than the services offered by the service provider.
3. Survey of real service trees
Our analysis of service trees relies on a survey conducted on a significant sample of telecommunications service providers. In this section, we describe the main features of the sample.
For our survey, we have opted to focus on the call centres of companies operating a telecommunications network. This is due to a number of reasons: a) these companies have exhibited a large growth in the last decade; b) they operate in a sector which is intrinsically linked to call centres (the technological support to a call centre is represented by the telecommunications network itself); c) they have been among the first to adopt call centres as the natural CRM (Customer Relationship Management) channel. In fact, in an annual survey conducted on the U.S. call centre industry the telecommunications sector (wireline plus wireless) amounted to over 34% of the total number of call centres examined in the survey [15], representing by far the largest industry sector (the second ranked was the financial sector with 19% of the total). We have selected six operators - the main ones in the Italian market. In the following they are identified by the letters A to F. The set is composed of three mobile operators (Call centres A, B and C), two fixed operators (Call centres D and F) and a convergent operator (Call centre E). Together they account for more than 95% of the Italian telecommunications market.
4. Service tree analysis
In section 3, we have described the main characteristics of the sample used in our survey. For all the call centres involved in this survey, we have collected a number of statistics, aimed at defining their characteristics. In this section, we provide the results of this analysis.
For each service provider, the service tree has been reconstructed through a complete exploration of the tree. The exploration has been conducted through repeated calls on the very same day, to avoid incurring changes to the tree structure. Starting from the welcome announcement (the root of the tree), note has been taken of all the options presented at each announcement, and each option has in turn been pursued up to the next announcement. A node and an edge have been added to the graph respectively for each new announcement and for each new option, connecting each node with the edge representing the option that led to it.
On the basis of the graph drawn up from the results obtained by the end of the exploration activity, a statistical analysis has been carried out for a number of selected quantities of interest. The quantities of interest are either counts (e.g., the number of services offered by the IVR) or times (e.g., the time needed to obtain a service). Times have been measured with a granularity of one second.
We can divide the quantities of interest into two classes:
Structural statistics, highlighting the characteristics of the service tree; QoS statistics, related to the time needed to obtain the desired service.
For each class we examine in the following sections the results of our analysis.
4.1. Structural statistics
The structure of the service tree can be synthetically described by the following three quantities, which we list in order of increasing level of detail:
Number of services offered by the IVR; Number of announcements for a single service; Number of options in a single announcement.
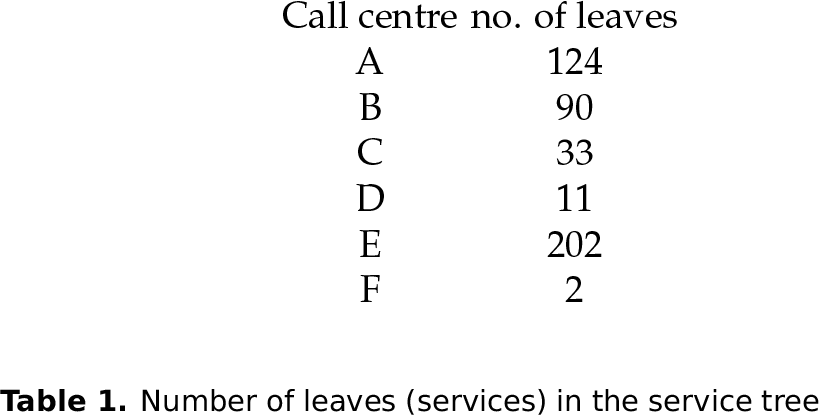
The number of services offered by the IVR is equal to the number of leaves of the service tree. Having a large number of services means that the IVR fulfils its role of self-service alternative to human-assisted service, hence we can consider an IVR to be better if its portfolio of service is large. For the call centres investigated in our survey, such a quantity is reported in Table 1. The set of results is extremely varied, ranging from the very limited choice of Call centre F (where new customers are welcomed by a general purpose agent, while the registered customers are invited to call a different, pay-per-use, number) to the wide selection of services offered by larger companies, such as Call centres A, B and E (the very large number of services offered by the latter is probably related to it being a convergent operator, offering both mobile and fixed services). For this reason the remaining statistics have not been considered significant for Call centre F, which will no longer appear in the following.
Number of leaves (services) in the service tree
The second structural statistic we examine is the number of announcements to be listened to in order to get the required service. This quantity is computed by following each service path (i.e., the path leading from the tree root to a leaf) and counting how many nodes are met along that path. Using the service path terminating at node P7 in Figure 3 as an example, this path is composed of three announcements (START, P2 and P7). Different services (leaves) of course exhibit different figures. Other elements being equal, the quality of service will be better the smaller the number of announcements, because the customer will get the service faster and will not be annoyed by having to press too many keys. However, we can also expect that IVRs offering a larger number of services to be characterized by longer service trees. The statistics concerning the number of announcements are reported in Figure 4. In this box plot, we have plotted two lines for each call centre. The thin line extremes represent the minimum and maximum number of announcements the customer has to listen to. The thick line midpoint is instead the average value, and its extremes are the two symmetrical one-σ points around the average (i.e., the values differing from the average by one standard deviation).

Number of announcements for a single service
Two service trees (Call centres B and C) offer a service exit directly on the welcome announcement, while for the others the first exit is on the second announcement, so that the minimum number of announcements is respectively 1 and 2. The longest service path (taking place in Call centre A) is given by a chain of eight announcements, probably a bit too long for the average customer. The average values are around five announcements, with the exception of Call centre D, whose average is less than three announcements, due to its limited set of services.
At each announcement the customer is presented with a number of options. Though enlarging the set of options per announcement reduces the number of announcements needed, a large set of options is difficult to remember (in most cases the user performs a sort of progressive best match choice as the list is being announced) and long announcements defy the user's patience. The number of options at each announcement should not be too large, though a trade-off has to be achieved between this figure of merit and the previous one: reducing the number of options at each announcement increases the number of messages the customer has to listen to before reaching the service completion.
The values obtained for our set of call centres are reported in Figure 5.

Number of options in a single announcement
In all cases, the range of values is rather large, with Call centre D providing up to eight options in some cases, though most call centres provide a minimum number of options as low as two (in the case of Call centre A there is one announcement offering a single, unavoidable exit). However, for two call centres the distribution is very peaked: in Call centre C the 74% of announcements provides only two options, and the 77% of announcements in Call centre B provides four options, so that the resulting service tree has a large degree of uniformity (the associated graph has quite a prevailing node degree value). The average values are typically between three and four options for announcements, which is quite reasonable.
4.2. QoS statistics
Here the quality of service is embodied by the time needed to get the desired service. Therefore, we consider the following three quantities, again describing the service tree at different levels of detail:
Service time; Duration of a single announcement; Duration of a single option.
The service time is the time needed to traverse the tree from the root to a leaf. Here it is computed as the sum of durations of all the announcements encountered along the service path. The quantity so obtained is actually the service time under the following two assumptions:
the customer listens to the whole announcement before making his/her choice; the time needed to signal the choice by pressing the corresponding key on the phone (the user's reaction time) is negligible.
For example, in the case of the tree of Figure 3, the service path terminating at node P7 exhibits a service time of 104 seconds, as given by the time needed to listen to the START announcement (25 seconds), then to the announcement delivered at node P2 (44 seconds), and finally to the announcement of node P7 itself (35 seconds).
The IVR can be considered better the shorter its service time. However, as self-evident from the analysis of any service tree, each service is reached through a different path, so that different services are delivered with different service times. In Figure 6, we show the variability of service times obtained for our sample of IVRs. In that figure, the thin and thick lines have the same meaning as previously stated.

Service time
We can expect companies offering a larger selection of services to exhibit longer service times, due to the time needed to propose the different options. In fact, the longest average value, provided by Call centre A (which, by the way, does not have the largest set of services), is slightly longer than four minutes and roughly threefold the shortest one associated to Call centre D (which has the smallest set of services). A comparably better situation is that of Call centre E, which, though providing the largest set of services, has average service times smaller than both Call centre A and Call centre B, and roughly equal to Call centre C.
In Figure 6, the central point of the thick lines (marked by a circle) represent the average service time, which can be considered as an overall measure of the QoS offered by the IVR. This average has been computed as the arithmetic mean of all the service times pertaining to that IVR. Actually, in computing the average we should consider the probability that each service is asked for, by weighting each service time with the probability of each service. In this section, the average response time is therefore computed by considering all the services equally likely. In fact however, the different services are not required by the customers with the same proportions, and a proper service tree design should provide the shortest service path for the most asked for services, so the actual average response time in a properly designed service tree shall be lower than that reported here.
Though bearing in mind the difference between the actual average service time and that reported in Figure 6, we can compare these values with the Average Speed of Answer (ASA), which is a well-established figure of merit adopted for the practical evaluation of a call centre. The ASA typically accounts just for the time taken waiting for a human agent to answer and has therefore to be added to the time spent through the automatic answering system of the IVR (which is the only component considered in our paper) to obtain the overall service time. The values of measured ASA are quite varied, ranging from the 60 seconds measured in a survey of 13 call centres [3] to the wide range (four seconds to five minutes) observed in a survey of 14 call centres [16], or the average of 34.6 seconds recorded on a large survey [17]. Anyway, the service times associated to the interaction with the human agent appear to be typically much lower than those due to the passage through the IVR, which may become the dominant factor in the overall service quality.
We can also analyse the relationship between the IVR average service time (which we would like to be as short as possible) and the number of services offered by the IVR (which we would like to be as large as possible). As can be seen in Figure 7, the two quantities indeed grow at the same time, meaning that the two requirements are contrasting. With the exception of Call centre E, we can see that there is a roughly linear relationship between the two quantities. If we denote by T the service time (expressed in seconds) and by N the number of services, a regression analysis (after censoring Call centre E) returns the relationship T = 86.89 + 1.23N.
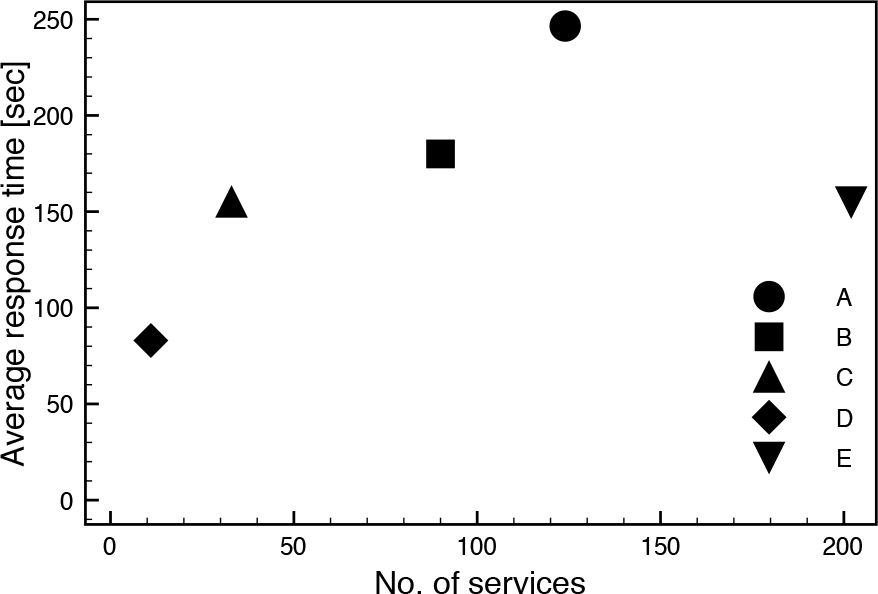
Service time and service portfolio size
Another measure of the listening effort the customer is called upon to bear is represented by the announcement duration. Too long an announcement may try the customer's ability to remember all the options before choosing the most applicable at the end of the announcement. In Figure 8 we show the basic statistics for the five call centres, using the same approach as in the previous figures. Here Call centre D, whose position in the analysis of the number of options was not particularly outstanding, exhibits the least demanding offer, since the maximum duration is 49 seconds, with an average of nearly 23 seconds, while Call centre A and Call centre B exhibit averages of over a minute. If we look at the maximum duration, Call centre B has a (negative) record of nearly three and a half minutes, which makes it very hard for the customer to follow it through. The relative dispersion is greater again for Call centre B, while the minimum value is attained by Call centre A.

Duration of a single announcement
Finally, we consider the duration of each option announcement. The duration is computed by dividing the time associated to each announcement among the options listed in that announcement. We would prefer option announcements to be as concise as possible, so that the duration of each option can be considered again as a QoS measure. We report the basic statistics (minimum, maximum, average and standard deviation) in Figure 9. Again, Call centre D appears to be particularly parsimonious, employing, on average, slightly more than seven seconds for announcing an option. Second best is the performance of Call centre E whose average is nearly 11 seconds, but with a maximum of about 50 seconds, three times larger than the maximum of Call centre D. Similar maxima are exhibited by Call centres B and C, but with quite large averages. A very large dispersion is exhibited by Call centre A, whose average is roughly aligned with the others, but with some extremely large values of over a minute and a half.

Duration of a single option
5. Average service times
In Section 4, we have reported the times observed for the completion of services and the average values for each call centre. Those averages were obtained as arithmetic averages computed over the whole portfolio of services offered by the IVR, i.e., considering all the services equally likely. We have already noticed that such assumption is not realistic. Customers ask for some services more than others, and indeed those differences may be exploited to optimize the average service time, by reducing the time needed for the most popular services. We do not have statistics for the preferences exhibited by customers over the range of serviced offered by a call centre. However, in this section, we envisage a statistical model for such preferences and compute the resulting statistical average. This helps us understand how the average service time (quite a representative QoS figure) can be improved (i.e., lowered) by exploiting the statistical differences in customers' preferences.
The general expression of the average service time is

The service time for each service is largely dictated by the design of the service tree. It is therefore up to the service provider to decide the service time for each service, essentially by moving the service up or down the service tree: reducing the number of announcements to listen to (i.e., the number of nodes traversed on the service tree) in order to get the required service will likewise reduce its service time. Instead, the probability of a service being required is the result of customers' needs. How should these two factors be matched, since they are in the control of two different parties? It has been noted first in [18] that the tree design problem can be formulated as a source coding problem. By assigning a symbol to each node, any path on the service tree can be represented by a digital word whose length equals the number of nodes crossed to reach the leaf representing service completion. If the time needed to cross a node (the announcement duration) is the same for all nodes, minimizing the average service time is equivalent to minimizing the average word length. Under this hypothesis, we can assume the general principle that services required with higher probability should be completed in less time. Though the hypothesis that the announcement duration is the same for all messages may not hold true, we assume in this section that service assignment has been accomplished so that the following condition holds:

The consequence of this condition is that services are indexed in either one of two ways: increasing service times and decreasing probability or vice versa. Without loss of generality, we adopt the former ordering:

We can now analyse both components of the average service time: the individual service time and the probability.
The time needed for each service is itself made of two components: the time needed to listen to the announcement and the response time of the customer (the time it takes the customer to make his/her choice after listening to the announcement). If we assume that the customer listens to the whole announcement before making his/her choice and makes that choice right afterwards, the time needed for each service is given by the sum of the durations of all the announcements. If we indicate by Ω
i
the set of announcements to listen in order to get the i-the service, the time needed for that service becomes

As to the probability of a generic service being required by the customer, we do not have statistics available. A well-known model to describe the popularity of a given set of items is however Zipf's model. Such a model has been proposed first to describe the frequency of words in a written text [19]. It has then crossed the border of linguistics to be applied in a very wide variety of contexts. Among the most relevant we can cite the popularity of web documents [20], information dissemination [21], queries in P2P systems [22], web services on PDAs (Personal Digital Assistants) [23], wide-area infrastructure services [24], and the distribution of customers over a wide area [25]. A survey of its applications on the Internet is conducted in [26]. The connection of Zipf's law with concentration indices has been explored in [27]. According to Zipf's law, the probability that the i-the service is chosen is

Under these assumptions, the expression of the average service time becomes

In Equation (6), we just need Zipf's parameter α and the set of durations of announcement to compute the average service time. We employ the set of durations actually observed on our sample of call centres, reported in Section 4, and compute the impact on the average service time for a wide range of values for Zipf's parameter. We expect the average service time to improve (decrease) as the imbalances in service popularity grow. We report the results in Figure 10, which confirm our expectations. Under the assumption that we adopt the optimized matching between service popularity and service duration, the improvement in the average service time is quite remarkable for all call centres (with a reduction even as large as 80% over the range of Zipf's parameter values), excepting Call centre D, where the small differences in service duration (see Figure 6) do not leave wide margins for improvement.

Average service time under a Zipf popularity model
6. Conclusions
We have conducted a survey of five telecommunications call centres to perform a statistical analysis of two issues: the structure of service trees employed in Interactive Voice Response (IVR) systems and the associated service times. Two groups of statistics concerning those issues have been collected on three levels of detail: the whole tree, the announcement level, and the option level. Service times exhibit wide variability both within a single call centre and among the call centres. The maximum service time within an IVR can be as large as 450 seconds. These measured values are larger than those typically associated to the service through human agents, so that the service time due to the IVR appears to be very large and should deserve greater attention in the design of the call centre. The analysis of the service tree structure has also revealed that in some cases the service structure may require the customers to perform as many as eight choices while following the chain of announcements, and to remember as many as nine options before choosing the most appropriate. Better design procedures need therefore to be put in place for the IVR (namely for its service tree), aiming at a reduction of the overall service time, if possible accompanied by a reduction of the length of the announcement chain and of the options presented at each step. We also show that the average service time ranges from 83 seconds to 246 seconds if all services are equally likely, while the presence of imbalances, modelled through Zipf's law, can slash that average, squeezing it into the 50-100 seconds range.