
Abstract
Intervention planning is crucial for maintenance operations in particle accelerator environments with ionizing radiation, during which the radiation dose received by maintenance workers should be reduced to a minimum. In this context, we discuss the development of a new software tool and the entailed methodology, including the visualization aspects. The software tool integrates interactive exploration of a scene depicting an accelerator facility augmented with residual radiation level simulations, with the visualization of intervention data such as the followed trajectory and maintenance tasks. Its conception allows for future inclusion of measurements performed by mobile robotic devices. In this work, we explore the systems engineering life cycle of the development process of an interactive intervention planner, which includes the needs analysis, specification explicitation, conceptual mathematical modelling, iterative implementation, design and prototype testing and usability testing.
Introduction
The work in this paper is primarily closely related to particle physics experimental areas. Particle physics is a branch of modern physics studying the smallest known constituents of matter. Particle physics research necessitates large and complex scientific instruments: particle accelerators and detectors [1, 2]. The circulation and collisions of high energy beams in the accelerators and detectors have an undesirable consequence, namely the radiological activation of some of the components of accelerator facilities [3].
The complexity of particle accelerators and detectors leads to the frequent necessity of maintenance operations. To protect maintenance personnel from ionizing radiation during interventions in the particle accelerators and detectors, the so-called ALARP or ALARA approach (As Low As Reasonably Possible or Achievable) [4, 5] is mostly used, which consists of justifying, optimizing and limiting the dose received by all those who need to work on activated components. Because of this, a core issue during the planning of a maintenance intervention in a facility with ionizing radiation is the minimization of the dose the maintenance workers are subjected to. This optimization cannot be automated since the practical feasibility of the intervention tasks requires human assessment, but the intervention planning could be facilitated by using a software tool with three-dimensional visualization capabilities. The development of this tool is a complex undertaking for three reasons. Firstly, the visualization has to cover the infrastructure, the (expected) radiation levels in the facility and the intervention. Secondly, this visualization has to be intuitive to work with for all stakeholders involved (intervention planners, scientists, maintenance workers, safety officers,…) and useful in different scenarios (visual training of operators, three-dimensional visualizations to support the decisions of the ALARA committee,…). Thirdly, the application is about the safety of humans and is therefore not allowed to have any kind of ambiguity. These three points lead to the necessity of a good systems engineering approach.

The systems engineering life cycle for the development of an interactive intervention planner.
This article deals with the development process of a methodology and software tool providing interactive visualization for intervention planning in particle accelerator environments with ionizing radiation. In section 2, we discuss the various phases of the systems engineering life cycle: needs analysis & specification explicitation (section 2.1), conceptual mathematical modelling (section 2.2), iterative implementation (section 2.3) and usability testing (section 2.4). Section 3 discusses the resulting application, developed following this systems engineering approach. Section 4 discusses a possible future direction for the development and the systems engineering life cycle. Section 5, finally, concludes the paper.
Systems engineering life cycles are a very important aspect in the accomplishment of a particular objective according to plan [6]. The systems engineering life cycle of the development process of an interactive intervention planner, the analysis and synthesis of the problem parts in the development of the interactive intervention planning application, is shown in Figure 1. The structure of the systems engineering life cycle also allows for clear documentation: every block of the life cycle also includes a documentation phase. The different phases of this research, development, test and evaluation (RDT&E) life cycle are discussed in the following sections.
Needs analysis & specification explicitation
In every project, be it an Information Technology (IT), construction, industrial, organizatorial change or new service development project, identifying user needs is of key importance for the successful completion of the project [7]. Although this project is a research project and therefore a relaxed systems engineering approach might have to be adapted, it is no exception in that the needs are important to start with. However, identifying user needs is also “the most difficult, most critical, most error prone and most communication-intensive aspect of software development” [8]. In addition, the needs will typically be more easily changed during a research project than during any other project.

The use case context diagram. This diagram shows how the different stakeholders (depicted as named stick figures) and external systems (depicted as named boxes) are expected to interact with the software system, here indicated as ‘RADIJS’.
In addition to this, at the start point of our life cycle, the needs analysis or user needs study is particularly important because of the set-up of this project: the user needs are not centred around one user group. They are distributed around many stakeholders: the intervention planner, the maintenance worker, the radiation protection experts, and almost all persons involved in a particular particle science experiment or equipment.
Because this is a research project and because of the diversity of the user needs, we decided to go for a low-profile way of needs gathering. We did not organize formal customer panels, but attended various meetings and discussed in an informal, non-intrusive way the potential applications of the software for visualization of radiation levels with people that are concerned with this type of problem. It became clear that in the current situation, powerful three-dimensional visualization techniques are not consistently used for the visualization of radiation levels at CERN. However, both simulated and measured data from manual measurements and from a fixed survey system are used. In the future, data measured by mobile robots might also become available [9–11].
In addition, because of the diversity of user needs and the research nature of the project, it is extremely important to explicitate the software specification in a way that is as simple and straightforward as possible, while keeping the information content high. This is why we opted for use cases [12] to communicate the specifications. The use cases are based on the gathered user needs that are mapped in Table 1, together with their estimated importance. This table also shows the nature of the input data of the software, which is an important outcome of the needs analysis. The use case context diagram for the developed use cases can be seen in Figure 2. We have explicitized the functional specifications in this way as the use case context diagram is widely recognized as the simplest graphical representation of the interaction of the user with the to-be-developed software. It portrays different types of user-software interactions in a very intuitive way, namely, it shows how the different stakeholders (depicted as named stick figures) and external systems (depicted as named boxes) are expected to interact with the software system, indicated in the figure as ‘RADIJS’.
An important outcome of the needs analysis and specification explicitation phase is the starting point of the data flow of our application, i.e., the radiation simulations and three-dimensional geometry. At CERN, the FLUKA Monte Carlo simulation package [13, 14] is used for radiation protection studies, as FLUKA has its roots in this field and is thus the most appropriate choice for these studies [15]. FLUKA is well benchmarked in this area [16–20]. It will thus be necessary for our application to be able to deal with data that is the output of a FLUKA simulation, and with the geometry data that is given as input to FLUKA. In Figure 2, this is expressed by the two uppermost use cases.
Data from manual measurements and/or robotic measurements are to be considered in a further phase of the development. These data will not have the dense nature that the simulation data has, and will thus need interpolation. This interpolation is however far from trivial [21], and much research will be needed to make this feasible. Augmenting the simulated data with measured data, to assess the quality of the simulated data, is more promising (see section 4).
As the intervention planning software will be used in a scientific environment and, more importantly, will be used to assess the safety of maintenance workers, a rigorous mathematical model of the intervention planning is necessary. This modelling includes various planning concepts, such as the intervention I, a trajectory 𝒯, and the contracted radiation dose H.
An intervention ℐ consists of a set of tasks Tk, each with a specified description and duration:

These tasks are parts of the intervention that has to be performed, starting with the entrance of the facility by the worker (T0), and ending with the worker exiting the facility (Tk).
A trajectory 𝒯 consists of a series of locations mi joined by paths Si, with i = 0,…, N. Each location and each path can be associated with certain radiological properties, that can be deduced from the radiation dose rates that are available from the FLUKA simulations. The equivalent dose H received by the maintenance worker performing an intervention ℐ, which is mapped on a trajectory 𝒯, is then calculated as the sum of the radiation received at the specified locations mi and the radiation received over the paths Si between the locations, which the maintenance worker travels along with a velocity vi:

where s is a point on the path Si. The radiation rates
The model as described above is able to deal with manual measurements as well as measurements collected by a robot. While the interactive intervention planner is intended for planning interventions where the work cannot be done by a remotely operated vehicle, it is imaginable that it is possible for a robot to perform a pre-inspection task, of which a validation of the simulation used for the intervention planning can be an outcome. Efforts on such mobile robotic devices are underway in this context [9–11].
To make this model as useful as possible, the conceptual mathematical modelling effort is developed in parallel with the specification explicitation and iterative implementation phases, as can be seen from Figure 1, and is being published in order to be checked by the wider scientific community. The mathematical modelling is compliant with the intervention planning needs at stake, with radiation protection theory [5], and sound to be implemented.
Iterative software development methods are used by many organizations to reduce development risks and to deliver software projects on time [22, 23]. Design and prototype testing are integral parts of the iterative implementation strategy. In addition, this software development project makes use of an iterative implementation method.
To facilitate fast development, we opt to develop in Python [24]. Python is a general-purpose, high-level programming language whose design philosophy emphasizes code readability. This is a very important programming language quality in the collaborative context at CERN. Python supports the object-oriented programming paradigm, which is needed for a project like this. While Python is often used as a scripting language, we thus use it in a non-scripting context. Another important factor is that, using third-party tools, Python code can be very easily packaged into stand-alone executable programs, and that Python interpreters are available for many operating systems.
Needs table and importance mapping.

Needs table and importance mapping.
For the visualization library, the Visualisation ToolKit (VTK) [25, 26] was selected. VTK is a well-known, open-source and freely available software system for three-dimensional computer graphics, image processing and visualization. VTK consists of a C++ class library and includes a Python interface layer, is cross-platform and runs on Linux, Windows, Mac and Unix platforms.
For the development of the graphical user interface (GUI), we choose to make use of wxPython [27]. Because major attention has to be paid to the requirement of an intuitive graphical user interface allowing fast and flexible visualization, trajectory creation and reporting, the user interface (UI) is as much as possible decoupled from the back-end of the software [28].
During this phase of the software development, many implementation iterations were run through. Each time, a prototype version of the software was tested by several users. The resulting prototype test results were used as an input for a new iteration of implementation. This phase of prototype testing distinguishes itself from the phase of usability testing described in the next section, in that intermediate prototype versions of the software were tested for practical reasons, i.e., the correct functioning of the software, such as successfully loading data and the utility of interaction tools.
The central idea of the usability testing (top right in Figure 1) is to test whether the software arrives at the intended result and to determine the optimal settings for the software to be user-friendly for as many of the stakeholders as possible. The needs table that was developed during the needs analysis and the specification explicitation phase, as discussed in Section 2.1 and more specifically Table 1, is therefore the guide.
Secondarily, since the interactive and three-dimensional visualization tool for the planning of interventions in facilities emitting ionizing radiation is not implemented yet in the facilities it has been designed for, usability tests are needed to prove that the application of these techniques are indeed useful to intervention planners.
The usability tests are split into two phases. The main goals of the first phase are, firstly, to qualitatively prove the usefulness of the three-dimensional visualization for the user, and secondly, to make way for larger usability tests using more quantitative variables in order to discover the optimal settings for the three-dimensional visualization. More information on these first-phase tests can be found in [29]. In a second phase, more extensive tests are pursued to make way for the release and deployment of the application.
For this second phase, we propose developing a test where a large number of users each go through the intervention planning process of a real-life situation at CERN, for different well-known, existing visualization methods. The test users will originate from all stakeholders involved in intervention planning. The results of the intervention planning, such as the simulated contracted radiation dose, will be studied to obtain visualization parameters that are optimal for the application. Furthermore, the subjective feelings of the user with respect to the visualization will be examined. At the same time, the user will be questioned on the planning experience to assess whether the needs listed in Table 1 have been met.
This recording of the subjective feelings of the test subjects will be done in an informal way, by having an informal chat with the test subject after the usability test. In this way, a very coarse retrospective analysis of the performance of the software tool's visualizations is envisaged. However, no formal think-aloud protocol (when the subjects are taking part in the usability test they think aloud as they perform the tests) will be implemented. A concurrent think-aloud protocol would make the timings that will be recorded less reliable, as is proven in [30], while a retrospective think-aloud protocol would make the usability testing infeasible due to time constraints. In addition to this, the methodological foundations of think-aloud usability testing are still questioned with regard to scientific value [31].
The most distinctive part of the usability testing in this particular project, the study of the optimal volume rendering parameters, will consist of a thorough investigation of the influence of the values of the volume rendering parameters that we presuppose to be important for the acceptance, the usability and the usefulness of the software in the context of CERN operations. To our knowledge, similar previous studies were always limited to:
We propose developing an interactive user study of a real-life situation at CERN, using well-known, existing rendering methods. The planned second-phase usability tests will therefore be more extensive and their results will be compared to the more specific studies in the literature. We thus aim to demonstrate the usefulness of volume rendering techniques and visual data analysis for the empirical science of radiation protection.
That even small changes in the volume rendering technique can have significant effect, and what kind of effect they lead to in the visualization can, for instance, be appreciated from the figures in [35].
In the spirit of systems engineering, usability tests are an important step in the project and can lead to valuable insights in the iterative development process. Because of this, and because of the specific nature of software development, we want to proceed to a usability test as soon as possible.
The resulting application
The core of the resulting application is the visualization capacity for FLUKA simulation results and the geometry that comes with it. Due to the nature of FLUKA simulation data and the requirement of a clear visualization of the working conditions, volume rendering is the natural choice for visualizing the radiation levels augmented on the facility geometry. As we want to be able not only to see the radiation levels on certain positions in the three-dimensional space of the facility, but also inside the volume that makes up the facility, volume rendering is the only feasible choice. We consider volume rendering to be a very intuitive volume visualization technique, compared to, for example, volume slicing. Volume rendering has been around for many years [37, 38] and recently the development and improvement of off-the-shelve GPUs has led to the proposition of several interactive advanced volumetric illumination models [39].
Architecturally, the application consists of two main packages, and a number of supporting modules. It makes use of a number of well-known design patterns, such as the Façade, Observer and Iterator patterns [28].
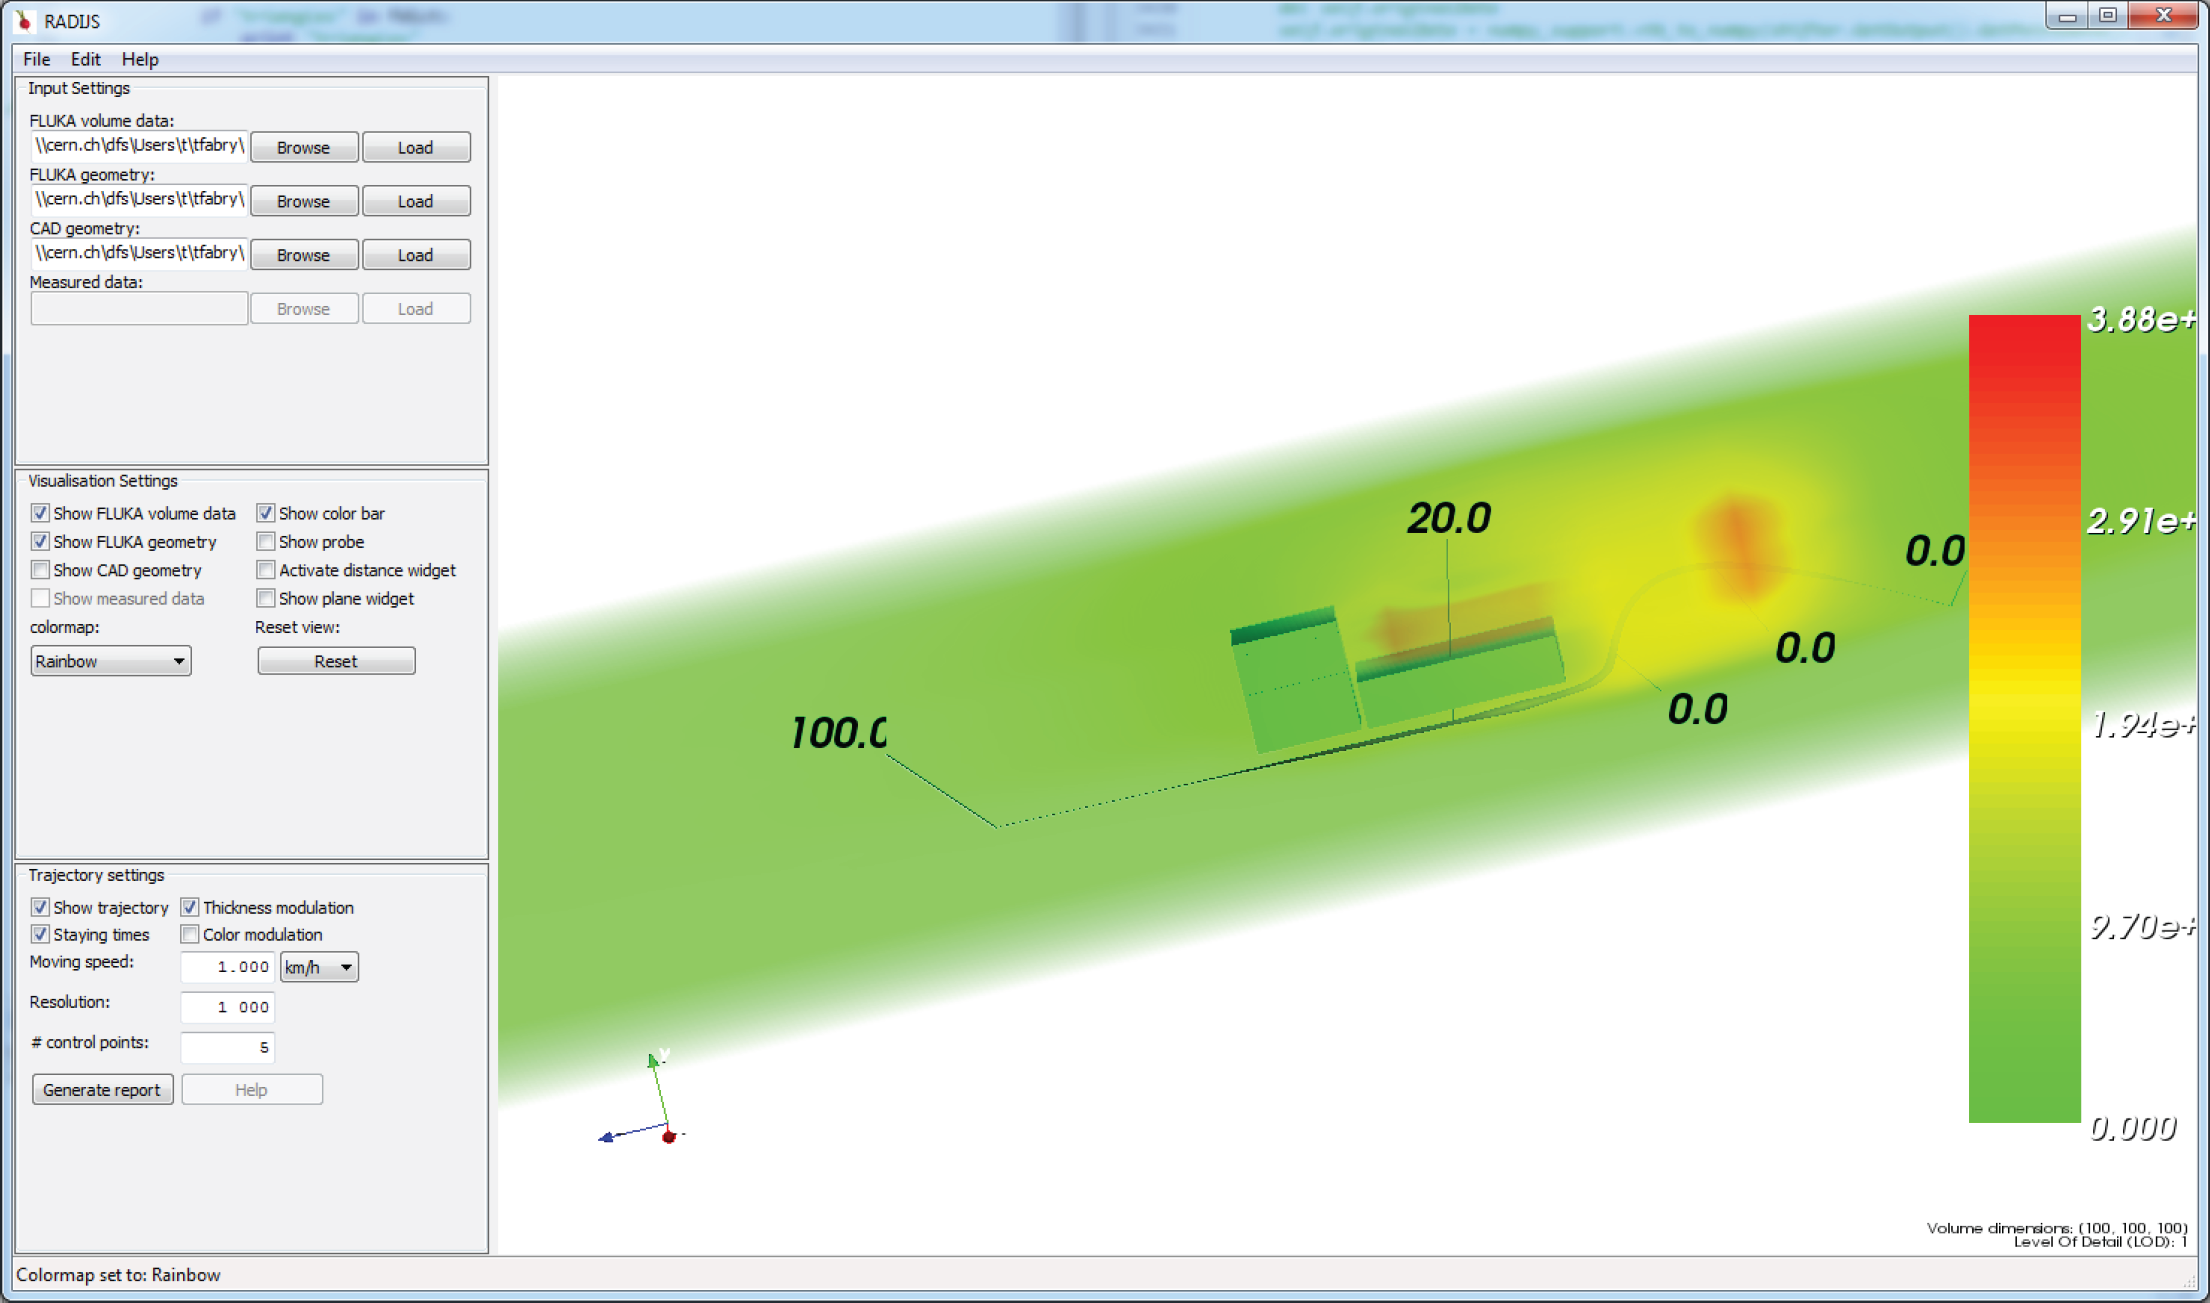
The user interface of the visual intervention planner.
The two main packages are a framework package for the processing of the facility geometry and radiation (simulation) data, and a GUI (Graphical User Interface) package. In the context of this paper the architecture will not be fully discussed, but it suffices to point out that by using an iterative development methodology, embedded in a rigorous systems engineering life cycle, an elegant design can be obtained.
Arguably one of the most important aspects of the software, certainly in the context of this particular software project and as outlined before, is the user interface. A screenshot of this interface, the GUI of the resulting application, can be seen in Figure 3.
The application is made so that it is intuitively possible for every stakeholder in the intervention planning process (intervention planners, scientists, maintenance workers,…) to assess the important features of the intervention. This means that for every possible user of the software, with his or her own personal background and interest in, e.g., radiation protection, practical implication of certain technical interventions, transport requirements,…, it has to be possible to see the variables he or she is interested in being visualized by the software. It is thus possible to make a good assessment of the conditions in the facility, by investigation of both the geometry of the facility and the volume-rendered (simulated) radiation levels. The visualization is interactive and allows zooming or panning to gain a better view. In addition, there are tools which enable a closer look at the radiation levels at specific points.
Next, it is possible to prepare a trajectory in the facility and map the tasks to specific locations of the trajectory. To allow for optimization of the intervention, the software provides tools to add locations to the trajectory, refine and edit the trajectory, and move existing locations. … At any time, it is possible to generate a report showing the radiological impact the intervention will have on the persons involved in the intervention.
The GUI is very simple in conception. The application interface is divided in two regions: a region for the interactive visualization and a region for the various settings. This latter region is divided into three boxes for, respectively, input settings, visualization settings and trajectory settings. The settings are preset to values that have been empirically proven to be meaningful for the CERN cases that we have been provided with as test cases.
So far we have described a systems engineering life cycle for the development of an interactive intervention planner with human and computer actors. In the future, there may however also be a need to include robotic actors. In this context, we discuss a particular use case that could be part of an extended systems engineering life cycle for the development of the intervention planning methodology in general, namely, the validation of the latter methodology using programmable mobile radiation-measuring robots.
Until now the software has relied on FLUKA simulation data for its operation. This is justified because FLUKA was extensively validated for use in radiation protection around high-energy accelerators [16–20]. By integrating the software with a mobile robot equipped for radiation detection, which is under development [9–11]], the validation of individual intervention scenarios constructed with the software tool will become feasible.
With the availability of a radiation-detecting mobile robot, a use case can be envisaged where the trajectory generated with the intervention planning software is used as the input for the programming of a trajectory of the robotic device. The robot shall therefore be equipped with a suitable radiation sensor, so that it can measure radiation levels while covering the trajectory. With the results of the measurements taken by the robot, both the FLUKA simulation data and the interactive intervention planner can be validated in a fine-grained way, taking into account all (possibly hidden) variables that come into play when planning the intervention. This will further strengthen the validation of the simulations or, alternatively, provide new input data for strengthening the simulation code. If robotic devices become more powerful and - for some interventions - suitable to replace human maintenance workers, similar use cases can be imagined to plan robotic interventions.
Conclusion
Particle accelerators and detectors used in particle physics research can lead to ionizing radiation and their components becoming activated. This in turn leads to facilities where ionizing radiation is present. To protect the accelerator facility maintenance personnel from ionizing radiation during maintenance or repair interventions, the radiation dose received by the workers during an intervention has to be optimized.
In this work, we outlined the systems engineering life cycle of the development of a software tool for interactive planning of interventions in environments with ionizing radiation. This development is a complex problem with many aspects. The different steps of the systems engineering life cycle were discussed, including a needs analysis, specification explicitation, conceptual mathematical modelling, iterative implementation, design and prototype testing and usability testing. The result of this rigorous approach is a well-documented and purposeful software tool with demonstrated potential.
This work contributes to the important question of the feasibility of adapting a (relaxed) systems engineering approach in rather complex multi-disciplinary research projects.
Footnotes
6. Acknowledgements
This research project has been supported by a Marie Curie Fellowship of the European Community's Seventh Framework Programme under contract number (PITN-GA-2010-264336-PURESAFE).
The authors would like to thank Chris Theis, Keith Kershaw and Pierre Bonnal for the valuable discussions, as well as Mathieu Baudin for the tedious task of beta-testing.