
Abstract
Fish ethology is a prospective discipline for ocean surveys. In this paper, one ROV-based system is established to perform underwater visual tasks with customized optical sensors installed. One image quality enhancement method is first presented in the context of creating underwater imaging models combined with homomorphic filtering and wavelet decomposition. The underwater vision system can further detect and track swimming fish from the resulting images with the strategies developed using curve evolution and particular filtering, in order to obtain a deeper understanding of fish behaviours. The simulation results have shown the excellent performance of the developed scheme, in regard to both robustness and effectiveness.
Introduction
The 21st century is an era of the ‘ocean’ [1, 2]. Fish ethology, a discipline concerned with exploring the movement, behaviours and activities of either wild or cultivated fish under natural conditions, has shown great prospects in aquaculture, fisheries, and other marine related surveys and applications [3–8].
Traditional studies mainly focus on in situ observations periodically conducted by marine biologists, which are time consuming and dependent on strict knowledge and the ability to observe, count and describe [3–8]. Underwater vision systems, either tethered to a vessel or a shore-based facility, or operated by remotely operated vehicles (ROV) and autonomous underwater vehicles (AUV), have increased rapidly over the last decade [9–16]. In such a system, the optical images may easily suffer from poor quality due to the specific imaging properties of the light in the water [17, 18]. Many environmental parameters can modify the optical properties of the water [19, 20]. Therefore, the development and improvement of underwater imaging and image quality enhancement is of great relevance.
Efficient fish detection and tracking plays one of the most fundamental roles in the description of fish behaviour. Extracting the fish from the observation and tracking the fish's trajectory can be extremely complex and challenging due to the three dimensional and sometimes erratic fish movements, the scene illumination changes, the morphological characteristics, the complicated underwater environment, all kinds of shape variations, the non rigid or articulated nature, partial and full occlusions, the multiple viewpoints, the poor image quality, the projection of the 3D world onto 2D images, the real-time processing requirements, and so on [21–25].
In this paper, we set up a ROV-based underwater vision system for a series of visual-based explorations for fish ethology research. The framework here is derived from the original underwater imaging model with a number of significant innovations and modifications incorporated. The rest of the paper is organized as follows: in Section 2, the underwater vision system will be briefly introduced, including the established ROV system and the optical sensor. In Section 3, a novel optical image enhancement approach will be present based on the underwater imaging model for our work. In section 4, our fish detection and tracking model will be developed in detail. In Section 5, a simulation is carried out in support of the developed scheme. Section 6 draws the conclusions.
Underwater Vision System
Remotely Operated Vehicle (ROV)
In fish ethology research, the establishment of underwater vision information collection over time depends on a system which provides insight into fish behaviours with reliability, accuracy and cost reduction, which strikes a balance between the video quality and the physical limitations (range, resolution, frame rate and compression).
The ROV- or AUV-based system has recently become a predominant tool due to the continuous navigation and sampling, which achieve simultaneous observations over large areas in the sea [9–16]. In this context, the VideoRay Explorer ROV system is used here as the basis of our underwater vision system, including an 8-pound submersible, control panel, seven inch LCD colour display monitor, water depth meter, auto depth feature, compass heading readout and run time meter. Figure 1 shows the ROV employed in our underwater surveillance.

ROV-based system
Here we adopt the ROV-based underwater vision system to provide real time information for the specific fish individuals or assemblages. At the same time, they are relatively benign, resulting in limited damage to the habitat and are particularly suitable for monitoring sensitive areas or threatened and endangered species. After moving to the underwater region of interest, the observations in such a system mainly work when the system remains static in the sea so as to avoid the impact of the vehicle movements. In case the position of the underwater camera changes, the installed sensors can also record the related movement parameters to adjust and compensate the observation results to some extent.
Poor visibility is a major limitation for underwater optical images. The properties of the light in the water, such as the limited range, non uniform lighting, low contrast, diminished colours, blur imaging and so on may limit the value of the images collected [17, 18]. Moreover, owing to the complexity of the marine environment, the optical properties can often be modified, so the underwater optical images might have large temporal and spatial variations [19, 20].
An external video monitoring device with higher resolution and sensitivity, the Kongsberg Maritime OE14-376 Light Ring Colour Camera, has been installed in the ROV for composite recording missions, providing a 43.5° diagonal angle of the view in the water and withstanding a water depth of 3,000 meters. The camera can also be a good choice when applied in the conditions such as turbidity or low light level phenomena that typically appear in sea water, with the excellent light compensation and the unique front port design that prevents the light of the LEDs reflecting back into the lens.
Water has a particular property of selectively scattering and absorbing certain wavelengths of visible light. The blue-green spectra, the so-called transmission window of water, have the lowest absorption rate in clear seawater, as is shown in Figure 2 [17]. Therefore, green light LEDs with a high brightness (Nichia Corporation, model: NSPG300A, typical luminous intensity: 11000mcd) have been adopted for illumination coupled with the white light LEDs of the camera itself at an equal interval when natural sunlight is insufficient. Figure 3 is the spectrum of the green light LED NSPG300A.
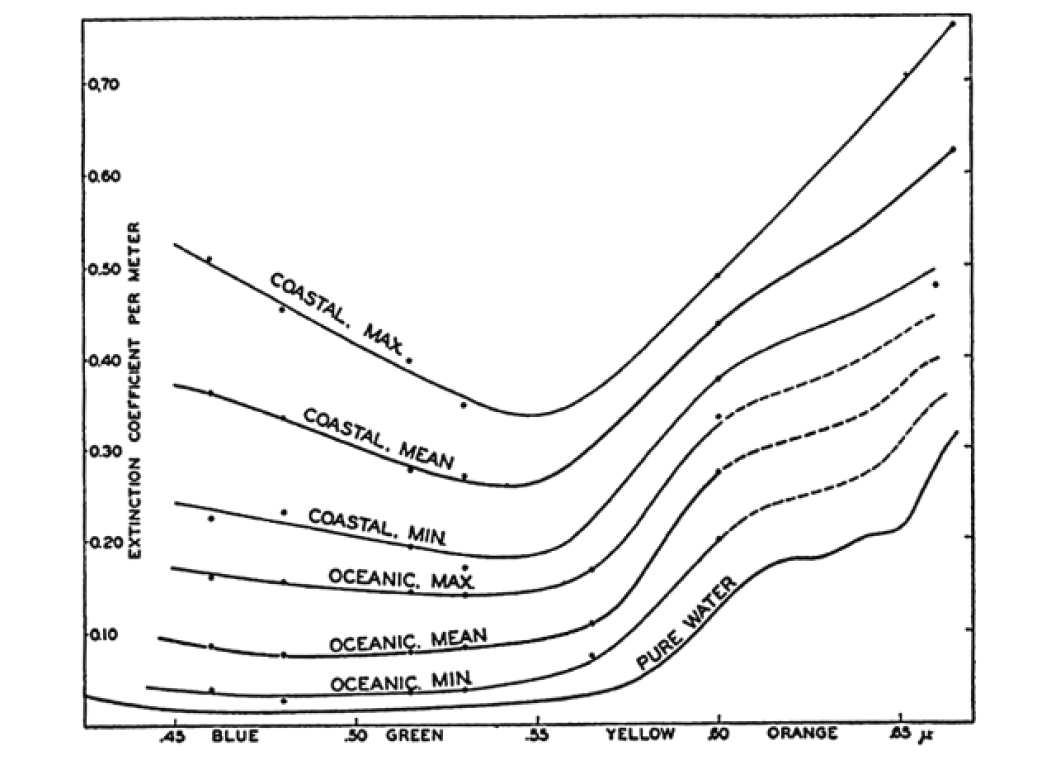
Seawater absorb spectrum
The Jaffe-McGlamery model is well-known in the analysis of underwater image formation [26–28], with the following basic assumptions:

where E t , E d , E f , E b are respectively the total irradiance, the direct component, the forward-scattered component and the backscattering. The direct component is the light reflected by the object surface and which enters into the camera without scattering. The forward scattering is the amount of randomly deviated light reflected by the object on its way to the camera, which enters the camera after being scattered at a small angle and causes the image features to blur. The backscattering is a significant fraction of the light which is reflected not by the object but has still entered the camera due to the suspended particles in transmission, which causes undesirable differences of contrast and masks the details of the scene, though visibility may indeed be augmented with artificial lighting.

where i is the wavelength of light, d is the distance travelled in a liquid, L i (d) is the light intensity of wavelength i, L0,i is the light intensity of wavelength i at the light source, and c i is the attenuation coefficient at wavelength i, respectively. The attenuation usually leads to a hazy and poorly contrasted image background.
Besides, the Macroscopic floating particles (marine snow), can also be considered as an unwanted signal. When considering the magnitude, backscattering and marine snow are the greatest degradation factors, forward scattering comes second and the attenuation follows closely.
General idea
The flow chart of our approach is shown in Figure 4, including the underwater vision system established, the collected underwater optical images with the fish objects, and steps for the image enhancement, image segmentation, and trajectory tracking. Considering the shapes of the fish as being an object region and the others as the non-object region, the binary level set method will be adopted as an efficient tool to segment the fish object region away from the others in the underwater optical images.

Green light LED spectrum

The flow chart
The image quality enhancement is one of the key issues for optimizing our understanding in fish ethology. In this paper, we present a generic parameter-free enhancement method with which to perform a total abstraction of the image formation process, reduce underwater perturbations, and correct the contrast disparities caused by the attenuation and backscattering, without prior knowledge of the depth, the distance and the water quality.
The colour space model of the image is first converted into the YCbCr space so as to concentrate only on the luminance channel which corresponds to the intensity component. The homomorphic filtering is adopted to correct non uniform illumination, enhance contrasts and sharpen the edges at the same time. Wavelet decomposition is further introduced to the homomorphic filtering for image denoising. The wavelet base is nearly symmetrically orthogonal with a bivariate shrinkage exploiting interscale dependency.
The underwater image is first represented as the product of the illumination and the reflectance,

where I (x, y) is the obtained image, i(x, y) is the illumination multiplicative factor, and r(x, y) is the reflectance function. When taking the logarithm of the image,

the Fourier transform of the log-image becomes,

where F i (u, v), F r (u, v) are respectively the Fourier transform of ln i(x, y) and ln r(x, y).
One kind of high-pass filter H(u, v) that merges the property of wavelet decomposition is introduced here to decrease the contribution of low frequencies and amplifies the contribution of mid and high frequencies, sharpening the edges of the fish in the image,

where j is the level of the wavelet decomposition, k c is the stopping coefficient, ω h and ω l are respectively the horizontal and vertical weights, and c is a constant between the two parameters r h and r l , which is introduced to control the filter function sharpening. The inverse transform is then taken to return to the spatial domain.

By taking the exponent to s(x, y) we can obtain the filtered image I′(x, y),
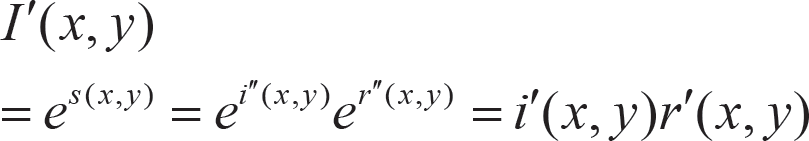
where i′(x, y), r′(x, y) are respectively the illumination and the reflectance for it. An alternative transformation could then be performed to turn the image back into the RGB colour space after all the operations.
Suppose that the entire region of the underwater optical image I is set to Ω. The idea of the fish detection scheme is to refine the image segmentation and extract the fish object from the entire region Ω.
In general, image segmentation is a process of partitioning images into homogenous groups [21, 23]. In many image segmentation approaches, the use of curve evolution algorithms has grown significantly recently [29–31]. There have been extensive studies on the variational methods and partial differential equations (PDE) concerning the curve evolution problem. The level set algorithms, in particular the motion by the mean curvature proposed by Osher and Sethian [29], have been widely used, which allows for the cusps, the corners and the automatic topological changes [29, 32–34]. The Mumford-Shah model [30, 35] is one of the most well-known approaches in region-based image segmentation implementation. Here we will try to carry out fish detection and derive the curve evolution process for underwater optical images with the level set and Mumford–Shah model.
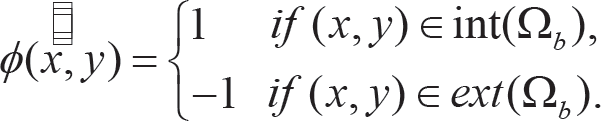
Let the region of the fish object be enclosed by Ω b . In the binary level set algorithm, the discontinuous level set function ϕ is defined as,
A piecewise constant function 𝓊 is introduced to approximate the grey level values for the given pixel position (x, y) in the underwater optical image I, which is constructed as the following sum,

where c1, c2 are two constants for the description of the grey level values, inside Ω b , u(x, y) = c1, and outside Ω b , u(x, y) = c2.
One basis function Ψ i is introduced as a simple representation,

Here we take the above binary level set to minimize the Mumford-Shah functional and segment the underwater optical image I,

where

The penalty formulation can be written as,

where η is the penalty coefficient.
The minimization process is done in order to find the vector

For a fixed vector

Fish trajectory tracking will greatly improve our understanding of fish ethology. So far, the existing methods of object tracking in the literature mainly focus on classical approaches such as background subtraction, inter-frame difference, optical flow computation, Kalman filtering, particular filtering, mean-shift algorithms, etc., and the primary differences come from the type of object representation, the feature extraction, the motion modelling, the shape and appearance, and the context in which the tracking is performed [36–39]. Here we will try to carry out fish tracking by applying the particle filtering approach to the colour distribution of underwater optical images.
In principle, the Bayesian sequential estimation can seek an optimal model for fish trajectory tracking [25]. The general dynamic model can be considered as state transition and state measurement,

where t is the time index, X t refers to the state variable of the fish propagated by the possibly nonlinear process model f over time, h is the observation model mapping the state variable X t to the corresponding observation variable Y t , U t and R t are respectively the process noise and the measurement noise that are roughly assumed to be white Gaussian noise. The state prediction function is formulated as,

and the state variable can be updated by the posterior density

where
Let the posterior density function be characterized by N random samples, here the colour distribution of the underwater optical image is extracted as the measurement specified by the state vector X t ,

where (xt,j, y
t
) is the centre of the given region, (xt,j, yt,j) is the pixel inside the region and n is the number of pixels, C(xt,j, yt,j) assigns the colour to the corresponding bin b = 1,2, ·, m, the distribution is discretized into m-bins, δ is the Kronecker delta function, d(X
t
, Xt,j) represents the distance between
Each colour distribution in the candidate region will be compared with the reference target model at the origin. The likelihood function here is defined as the Gaussian density,

where, supposing there are N candidate samples around the fish,
The sample located around the maximum of the likelihood represents the best match to both the target model and the previous adjoining sequential changes, and the mean state of the sample distribution corresponds well to the maximum and consequently the localization of the fish is more accurate.
In the experiments, various underwater optical images were collected by the VideoRay Explorer ROV-based system with a mounted camera. At each observation site, the environmental variables, including the ambient water temperature, current speed at the mooring location, the depth and the direction, as well as the survey-design variables, such as the ROV cruising speed and direction, the navigation and positioning, the altitude above the sea floor, and ROV distance from the bottom, were recorded simultaneously. All the simulation experiments were run on the same ×86_64 Windows machine with at least 4 GB of memory and 2+GHz processor. The execution environment is MATLAB 7.0. Figure 5 shows the example optical images in natural sunlight, the high brightness green light LEDs, and the mixed LEDs respectively.

Example underwater optical images.
Some preprocessing was first done to decrease the noise or complete the feature extraction in advance. The proposed enhancement method was conducted on underwater optical image sequences previously collected to obtain better image quality for fish ethology research. Figure 6 lists the resulting enhancements for the example optical images by the wavelet filtering, the homomorphic filtering, as well as the proposed method.

Image quality enhancement.
Simulations were performed on 100 video clips selected from the collection which have a fish in the scene to perform the tracking. Figure 7 lists the fish trajectory tracking results in our system. The mean shift method was efficient in real time tracking, while in cases of overlapping or appearance changes, it might sometimes not describe the real trajectory so exactly. The particle filtering method adopted in our system was a powerful and reliable tool for fish trajectory tracking.

Fish trajectory tracking.
The optical image segmentation was carried out to detect the fish from the underwater images. Figure 8 shows the segmentation performance in our system for one example optical image, and the comparison with the classical global and adaptive threshold methods. The segmentation results can provide fish shapes close to the real fish object region, with detailed information mined from the optical images, e.g., the fins.

Fish detection.
In this paper, we have investigated the ROV-based underwater vision system for fish ethology research and proposed a visual exploration framework with significant innovations and modifications to underwater image processing. The ROV-based system has been established with optical sensors installed for the seawater environment, and a novel image enhancement approach has been presented here to promote the quality of the underwater optical images by a homomorphic wavelet filtering in the context of the Jaffe-McGlamery model. The curve evolution concept has been introduced to provide stable and intensive PDE for the binary level set problem, and a fish tracking strategy has been developed based on the particle filtering approach by adopting the colour distribution as the measurement for the state vector prediction. The simulation results have shown the good performance and the effectiveness and robustness of the developed scheme.
Footnotes
7. Acknowledgments
This work was fully supported by the Natural Science Foundation of P. R. China (31202036), the National High-Tech R&D 863 Program (2012AA10A412), and the Natural Science Foundation of P. R. China (41176076).