
Abstract
The aim of this paper is to present an economic evaluation framework of an RFID system implementation through a pilot project with the aim of streamlining logistic processes and compliance with higher level requirements. The company involved in the project belongs to the CPG (Consumer Packaged Goods) food industry, and in particular to the alimentary industry, whose principal scope was to comply the new norms of the sector by implementation of a better traceability system. This system, besides being very effective for the scope of the project, also had a huge impact in economic terms on logistics resources and cost reduction. For this reason, the discover of the RFID technology for the company has been greatly appreciated at management level, and today other fields of application are under evaluation. The added value of this article is contained not only in the results obtained in the economic evaluations, but also in the applied methodology, evidencing the advantages obtainable in the processes by cutting no added value operations. The economic analysis has thus been conducted on the basis of this TO-BE process streamlining.
1. Introduction
It is out of discussion that RFID technology application brings a wide range of opportunities and advantages in the industrial framework. Most of them are currently explored in depth in the literature, but others are still considered to be up for research argument. It is also considered that the cost associated with this implementation remains prohibitive for many industries and fields of application. Today, in fact, the biggest challenge remains understanding whether or not an investment on this technology - in the particular application framework - could be profitable for the company who intends to perform it. In order to understand its potentialities, the general advantages brought by this technology are introduced and briefly discussed as follows.
1.1. RFID advantages
Generally speaking, the current RFID advantages with respect to the commonly used barcode, and also well covered in literature, are:
Asset/product tracking. RFID can be used to monitor and manage the physical movement of materials and finished products, to generate and deliver a flow of critical information, and to form the basis for enhanced working between supply chain partners in real time. This capability enhances the control of operations by reducing stock losses and improving supply chain visibility and integration. Nowadays supply chain integration is considered strategic in order to obtain a competitive advantage [1]. Non-conventional objects for tracking were applied in the Taipei Medical University Hospital: here this technology has been used for a location-based medical service system. In this framework its main function was to monitor physiological signals and track the paths of infection sources. Anti-counterfeiting. The anti-counterfeiting function of RFID technology is normally considered an additional feature provided by RFID chip-based tags and is partly addressed in the asset and product tracking and product handshaking functions. Condition monitoring. RFID tags with sensor functions can monitor physical conditions, like temperature and humidity, and register if the product has suffered any knocks. It may also be used in the food retailing industry where chill products' condition can be continuously measured [2] [3]. If some conditions are altered, the system can flag up a warning or set off a corrective procedure. Condition monitoring can also be used for anti-tampering purposes, detecting changes in some physical conditions of the product or detecting if the tag has been peeled off. This type of application is also being used in “cold chain” applications within the pharmaceutical/health industry to detect if products have been subjected, during transit, to temperatures outside the tolerance limits set by the authorities. A particular application of this function has been implemented for TATS materials monitoring: carbon fibre prepregs may be monitored through this technology [4], as already successfully implemented. Merchandising support functions. The implementation of RFID technology focusing on merchandising functions is already being tested, in particular the famous example of Metro Future Store in Rheinberg, Germany. Besides having a warehouse monitoring function [5], one of the applications for RFID tags is being tested on Pantene shampoo bottles in order to achieve a more direct communication with the customer. When a tagged shampoo bottle is lifted from the shelf, it activates the display screen above the shelf starting a commercial advert or communication tailored to that product. Other possible uses could be monitoring customer behaviour by using RFID loyalty cards and providing tailored marketing approaches according to shopping habits of customers. Industrial environments. There is a substantial amount of literature on the implementation of RFID to manage manufacturing operations. For instance, the management of machine-paced processes or the reverse logistics [6], or the added value to the re-manufacturing operations [7] are some of the debated application fields. The last one is particularly interesting due to the difference of results between the application of a theoretical model and the major benefits seen in practice. It is clear that many of these benefits come from spill overs of this technology application [8]. Warehouse environments. Warehouse operations optimization has always been considered as highly critical to the success of businesses [9] [10] [11]: the use of RFID technology has many applications in the warehouse environment such as product handshaking, near real time inventory control and condition monitoring. Additional applications for RFID technology can be found in these areas. Warehouse picking can be done accurately and automatically, in addition to the receiving and shipping processes which can be automated and accelerated. One of the examples of this application is in fact contained in this paper and in many others, representing its significant application. Inventory accuracy is in fact one of the most clear advantages presented by the use of this technology, with the aim of misalignment reductions, real time automatic inventory and consequent cost reduction [12] [13] [14]. Moreover, some papers propose an infrastructural framework, involving various emerging technologies for the development of logistics workflow systems with distinct features of the ability to govern supply chain inventories through understanding the parameters of the distribution patterns. The major contribution of such a system is to determine the correct replenishment strategy by automatically classifying the distribution patterns within the complex demand and supply chain [15]. Even if such a solution seems to be accessible only to large enterprises, smaller companies also face the same problems, mainly due to a lack of useful and comprehensive resource information and a relevant knowledge support system. Intelligent systems have been developed and are today operative, which incorporate the case-based reasoning (CBR) technique, the route optimizing programming model as well as automatic data identification RFID technology to assist logistics service providers in resource planning and execution [16].
However, this technology and its comparison with barcode scanning, even if confirming the net technical advantages of the former, still needs to be exhaustively researched due to the wide field of application and potentialities [17].
1.2. Bibliographic analysis of evaluation models
The bibliographic analysis focused its attention on the most recent and significant models dealing with the RFID technology investment evaluation. Backer et al. [18] developed a multi-perspective model for the measurement of the investment value in the RFID technology applicable to the entire supply chain (SC). The SC actors: suppliers, logistic operators, manufacturers, retailers, customers, etc., represent the highest hierarchical level of the model. Starting from this level, it is possible to identify the principal processes characterizing every actor and subsequently decompose them into more and more detailed activities, until coming to the processes directly involved in the RFID technology introduction. Each actor, from the logistics side, can be involved in seven main processes: procurement, production, redemption, transport, customer service, delivery and return. Main processes are only the highest level, they can be decomposed into more detailed sub-levels up to identifying activities directly involved in the RFID technology application. To each lowest level activity are associated the so-called “process objects”: product (level 0), packaging (level 1), transport unit (level 2), shipment unit (level 3), and container or vehicle (level 5). Moreover, for each lowest level activity, one or more effects can be identified caused by the eventual introduction of RFID technology: process time reduction, error reduction, resource consumption reduction, and process information (traceability). Once we have identified the processes affected by the technology and theirs technical and economical impact through the four effects previously illustrated, it is necessary to compare the actual state (AS-IS) with the future one (TO-BE) in terms of costs.
Ustundag et al. [19], instead, proposed a model for the evaluation of RFID technology investment using a FRBS (Fuzzy Rule-based System) for the assessment of the demand increase due to the introduction of this new technology. The model identifies the elements that contribute to the definition of the investment cost and the differential cost and revenue that can be, positively or negatively, influenced by the new technology. The use of fuzzy logic allows us to estimate the increase of demand depending on the implementation choices through rules defined by sector experts. The Montecarlo simulation ultimately allows us to vary the parameters inside the evaluation ranges and to obtain a more reliable NPV value.
De Marco et al. [20] proposed a System Dynamics (SD) model for the assessment of the RFID technology impact on the operations of a retail store of a well-known fashion store chain. The SD model gives the evaluation of the values concerning time reduction for product receiving, inventorying, labelling, etc., and concerning sales increasing due to the increase of time that the personnel can dedicate to client service. These records represent the inputs for the CFA (Cash Flow Analysis). This work relates to ex-ante evaluation of RFID technology impact on supply chain performances and, in particular, on the last ring of this chain, the retail store, which is often less well analysed in the literature.
Bottani et al. [21] produced a work on the qualitative evaluation of the economic RFID impact on a three-level chain composed of a producer DC, a distributor and a retailer. The study was undertaken by presenting a questionnaire to a group of leading companies in the Fast Moving Consumer Good (FMCG) sector. The results showed that use of a RFID system was convenient for all the chain actors when tagging pallets. When tagging cases, instead, the advantages for distributor and retailer do not compensate for the higher costs incurred by the manufacturer.
Bottani [22] proposed an economic evaluation model for the assessment of the impact in the adoption of RFID technology on the traceability management in the supply chain. The tags, applied at case level, allow reducing the recall costs of a defective lot through the distribution chain. This model does not consider the implementation cost of the RFID technology and it is supposed that the technology is already implemented. The effects generated concern recall point number reduction and overall recall goods reduction. Those effects produce reductions in transport costs, increased sales (due to a reduction in recalled goods), fewer product disposal costs and reductions in the costs associated with the traceability of goods. The work presents an interesting mathematical formulation for the definition of each of the above-mentioned costs.
Bertolini et al. [23], instead, analysed the RFID technology impact on the fashion industry's supply chain. Benefits are evaluated both in economic terms and in terms of the added value produced by greater information availability due to the application of tags at item level. The study was conducted at 13 clothing industry companies and in three different phases. The new proposed scenario was tested through a test project and showed manpower productivity increases (goods shipment and receiving), greater accuracy in inventory, higher speed in inventory operations, a precise traceability of clothes tried on by customers and, ultimately, a turnover increase and sales and unsold stock real time monitoring.
Dai and Tseng [24] studied the RFID impact on greater stock accuracy in a multi-stadium supply chain underlining a substantial associated cost reduction. The model considers only shrinkage errors, but the authors indicated that the eventual introduction of the model affected factors such as misplacement, transaction errors, etc., and could further increase the impact on stocks and costs.
Busato et al. [25] analysed the opportunity of introducing RFID in a large European Consumer Packaged Goods (FMCG) company in the cosmetics and beauty sector. Eleven processes in receiving, handling, storage and delivery procedures in one of the main distribution centres of the company were analysed and modelled using a detailed business process modelling approach. Since savings were evaluated only in terms of the reduction of resources used - achieved through process acceleration - despite the company dealing in huge volumes of high-margin products, the feasibility study turned out to be negative.
The preceding works were selected because they offer a clear picture of the RFID technology investment evaluation and because they integrate themselves, thereby creating an almost complete framework able to face the problem at each level and with all instruments: problem classification and fragmentation, identification of cost voices involved, dynamic model for the assessment of casual factors influenced by the technology. In the next paragraph, using the described models, developing and conveniently integrating them, we will present the complete framework for the assessment of the RFID technology investment for a manufacturer.
2. The evaluation framework for manufacturer
Becker's model [18], as previously described, was developed for the entire supply chain. The application proposed in this study, instead, although limited to the evaluation of manufacturers, offers a detailed and complete model for economic assessment and risk analysis of the RFID technology's investment. The figure 1 shows the general framework of the evaluation model that is composed by a first phase of identification of the technology application area (standard framework) and by the phase of evaluation of the application to the specific business contest (application's assessment). The model's parts will be described in detail as follows.
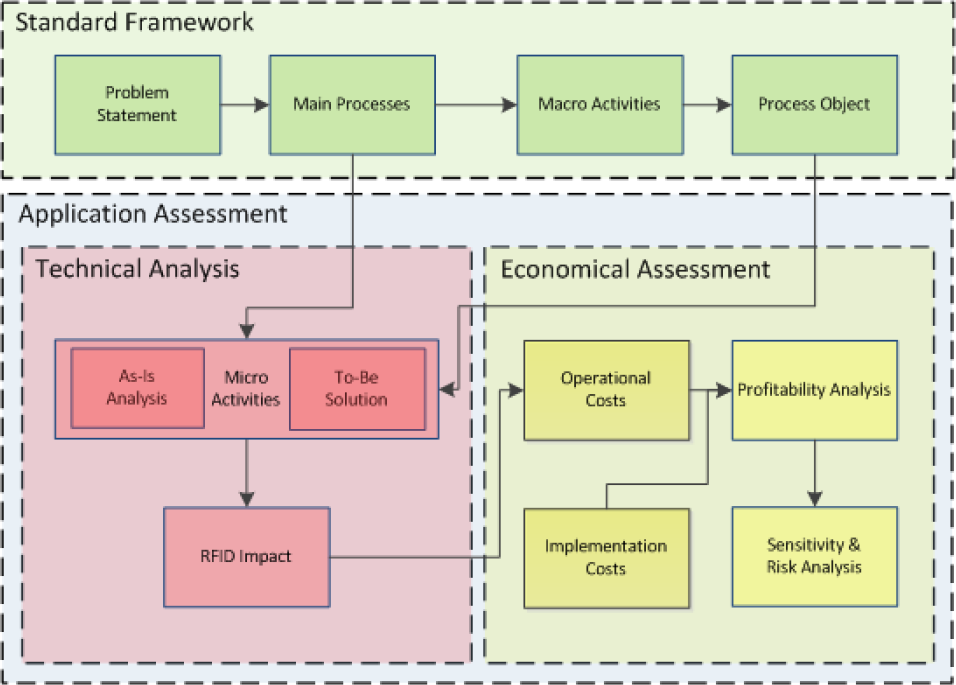
Evaluation framework
2.1. Standard framework
The standard framework allows the analyst, through schematizing processes, activities and standard objects valid for every productive contest, to define the macro-activities to be exploded in order to identify those influenced by RFID technology. To achieve this objective, the implementation project's goals have to be clearly defined.
2.1.1. Objective definition
The objective definition allows us to guide the following project implementation phases. Examples of objective definition are: materials handling time reduction; facilities position identification; material, semi-finished and finished product monitoring; throughput increase; client service level increase, etc. Once the problem to be faced is clarified, it is possible to identify the main processes that each manufacturer must analyse in order to resolve it.
2.1.2. Main processes
The main processes that involve the manufacturer were identified by Becker. Nevertheless, it is considered useful to introduce another process (inventory) with the purpose of completing the areas involved in the eventual RFID technology application. Identifying with i the main process that involves the manufacturer, it is possible to name the 8 main processes with Ai:
Procurement (A1); Production (A2); Redemption (A3); Transport (A4); Customer service (A5); Delivery (A6); Return (A7); Inventory (A8).
The main processes' identification is necessary in order to divide the analysis into effectively homogeneous elements. This division allows, moreover, for particularly complex implementations, to assign each main process to a different project team.
2.1.3. Macro-activities
The framework, compared with Becker's model (2010), describes manufacturer's specific main processes' phases in more detail. In particular, for each main process, macro-activities more influenced by RFID technology are reported in table 1. They are indicated as Aij (j-th macro-activity of i-th process).
Macro-activities

Activities reported in the previous chart, depending on the specific company, will be further detailed during the application, with the purpose of identifying micro phases that are influenced by RFID systems' use.
2.1.4. Process object
The activities' identification, obviously, depends on the RFID tag application level that the company decides to implement. Clearly, activities are different if the tag is applied at the item level (product) or at the container level. Process objects are classified by Becker and levels are indicated with h index (see table 2).
Process Object

2.2. Application assessment
The application's assessment phase is different from the previous one, standard framework, because it can be realized only by considering the peculiarity of processes and activities influenced by re-engineering through RFID technology. In fact, micro-activities that involve processes and manufacturing phases directly influenced by RFID technology can be defined only by knowing specific characteristics of the company involved. The application's assessment is divided into two phases: technical analysis, that compares, from a technical point of view, the existing scenario with the re-engineered one; and economic assessment, that translates the technical analysis in an economic/financial comparison.
2.2.1. Technical analysis
2.2.1.1 Micro-activities
Depending on the specificity of the examined operative processes, it will be possible to explode each macro-activity into the separate micro-activities contained therein, with regards both to the actual status (AS-IS analysis) and to the proposed solution (TO-BE solution). The AS-IS analysis allows us to evaluate each separate micro-activity's performance and to define the process times, resources and facilities that are involved. This information will be essential to the following economic convenience evaluation step. The TO-BE solution, instead, will be composed of the new micro-activities and by the related operative sequences that are essential for the use of the new technology, with the purpose of achieving the targets fixed at the beginning of the study. It is important to underline that, inside the same macro-activity, micro-activities to be considered will change depending on the process object, or rather, they will change if the tag application is at finished product, packaging or pallet level. Therefore, indicating with k index the k-th micro-activity, it will be possible to name as
2.2.1.2 RFID impact
The technical analysis of expected advantaged, compared to the actual situation for each micro-activity, must consider effects generated by RFID implementation, principally concerning:
Process Time Reduction (PTR), due to new technology introduction; Error Reduction (ER). The error time reduction that the RFID system is able to guarantee; Resource Consumption Reduction (RCR). The reduction of resources costs (human resources excluded) connected to activities necessary to perform the process; Process Information (PI). The effect of real time information transfer measured as reduction of time needed compared to the existing process.
Backer [18] identifies these four basic effects that, conditioning operation execution time and error rate, influence workforce, resources, facilities and material stock, with the same number of finished products manufactured.
2.3. Economic assessment
2.3.1. Operational costs
This phase allows us to translate the technological impacts previously defined into cost terms. Knowing activities and produced effects, it is possible to calculate costs and/or earnings inducted variations. Cost voices considered are the ones proposed by Ustundag [19] to which is added the voice related to maintenance cost variation (ΔCM). The mathematical formulation to compute the single value variation is reported as follows. They differ from the ones proposed by Ustundag due to the different nature of the considered elements. In fact, it is not present earnings increase, because this effect is considered irrelevant for manufacturers, but the voice related to maintenance variation costs that is introduced. Variation costs are:
1. Work Cost Variation (ΔCL)
This cost voice is a function of PTR and ER, because both effects can induce a reduction in the time needed to perform operations and, so, induce a reduction in workforce, with the same number of finished products manufactured.

Where FTE is Full Time Equivalent (a person who works 8 hours a day for 218 days a year, 1 744 hours/year), CLij is the average work cost of j-th macro-activity of i-th process,
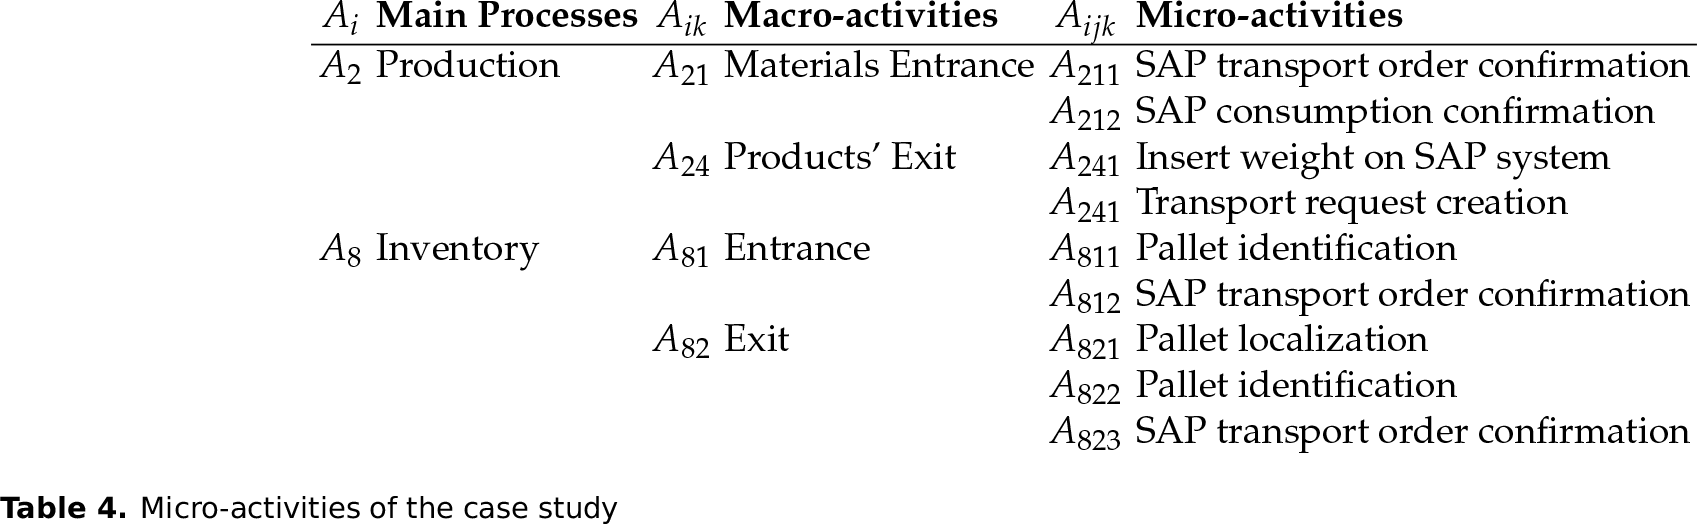
2. Inventory Cost Variation (ΔCI)
Stocks can be influenced by operation performing time reduction. As seen before, this reduction is principally due to PTR and ER effects. Moreover, inventory entity is also influenced by a more rapid process information PI. In fact, while in the first case the reduction is well known thank to Little's law, in the second the eventual process information lateness reduction reduces virtual safety stock related to it. In other words, purchasing a supply order a day later is equivalent to a safety stock increase, with the same service level offered to the client.
3. Shortage Cost Variation (ΔCS)
Shortage cost variation is an additional effect of process information and process execution time reduction.

4. Maintenance Cost Variation (ΔCM)
A positive variation of such a cost is due to RFID technology presence (antennas, readers, tags, etc.), vice versa, the production and movement facilities' decrease reduces this cost voice.

The overall annual cost variation is given by previous values' sum.

2.3.2. Implementation costs
Implementation costs, instead, are defined considering macro-classes defined by Ustundag et al. [19].
Cx Middleware Portable reader devices Antenna Tag Network infrastructures Management database server
Cy
Cz
Hardware related costs can also be partly identified for each macro-activity because facilities depend on the process in which they insert themselves. Common costs of facilities are software developing/purchase costs and existing management systems integration and update costs - training costs, instead, can be defined as a whole (eq. 6).

2.3.3. Profitability analysis
To perform economic convenience analysis, naming as N the number of years for the analysis, as t the index related to the year for which the cash flow is considered and as i the discounting rate, the used evaluation indicators are:
Net Present Value (NPV)
Internal Rate of Return (IRR)
Pay Back Period (PBP)


2.3.4. Sensitivity and risk analysis
All the parameters defined previously influence the profitability indicator results, therefore it is necessary to identify which of these are mainly influenced by the result (sensibility analysis). For each one, the analysis will allow us to define a variability range and event probability. The combination of single factors range allows us to build the NPV value event probability curve. The intersection between the obtained curve and y-axis will represent the probability of having a negative NPV and so investment risk (see the following case study).
3. The CPG case study: an application to the food industry
3.1. Framework of the case study
A CPG (Consumer Packaged Goods) industry or FMCG (Fast Moving Consumer Goods) industry is one which works with products that are sold quickly and at relatively low cost. Examples of this industry type are food and beverages, footwear and clothing, tobacco and cleaning products. Indeed, the case study proposed in this paper relates to an industry within the food sector.
3.1.1. Problem statement
The need for RFID implementation came from an internal project which identified this technology as necessary in order to improve the already present goods Tracking & Tracing system (T&T), whose scope was to comply the updated normative within the food sector. Indeed, the more stringent normative has pushed the company to choose a more evolved system in order to reduce costs, comply with the higher level requirements and gain in company reputation. For the aforementioned reasons, RFID thus became the mainstay of the whole selected system. The implementation of the new T&T system, after a high level analysis, has been tested in the real company through a pilot project in a limited sub-process. In the following paragraphs, the results of this study have been reported utilizing the evaluation model discussed before.
3.1.1.1 Main processes, macro-activities and process object
The factory zone in which the project implementation is imagined is represented in figure 2.

Factory Layout
From the layout it is possible to identify six main areas:
Production Hall 1 (PH1) in which pasta, vegetables and sauce semi-finished products are manufactured; Production Hall 2 (PH2) that performs packaging for finished products and for some semi-finished products that will be later treated to a complete manufacturing process; Production Hall 3 (PH3) that realizes finished products; Raw Material and packaging warehouse (RM); Coldstore (CS1) of raw materials and semi-finished products; Coldstore (CS2) of finished products.
Referring to the previous definitions, the implementation of the T&T system and the improvement of internal logistic efficiency with a consequent reduction of material research time, and related costs, and the definition of new standards concerning semi-finished products turn-around (movement) from coldstores to production halls (PH) allows us to confine the application to two main processes:
Production (A2); Inventory (A8);
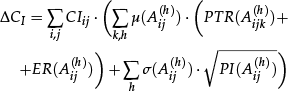
Macro-activities involved and connected process objects (pallet transport unit) are indicated in table 3.
Macro-activities of the case study
3.2. Application assessment
A business process analysis was carried in order to identify the processes mainly involved in reaching the objectives.
3.2.1. Micro-activities and impact analysis
AS-IS
The following AS-IS analysis diagram indicates factory processes and activities currently in use.
All transfer orders confirmation phases and pallet creation phases are performed manually by one or more dedicated operators. It is not available information about pallets movement between production and warehouses. Aggregate or punctual statistics concerning pallet movements with regard to traceability and products quality control are not available automatically.
TO-BE
Coherent with company targets, desired states were exploded. They are:
Complete automation of product identification and tracking of the route between production departments and warehouses and vice versa. Reduction of registration time, pallet control and transfer from coldstores to production points. Reduction in eventual pallet identification errors that are frequent in the actual procedures.
Based on above-mentioned points, the proposed solution, using RFID technology, will have to trace pallet movements and to automate production processes, modifying them in order to:
Automatically identify pallets and acquire weight in the pallet creation station, automatically create pallet in SAP software contextually opening a transfer order to the coldstore, after having printed fiche to put on the pallet Automatically identify the pallets crossing the coldstore entrance and activate transfer order confirmation in SAP Automatically identify the pallets coming out from the coldstore and activate in SAP a transfer order confirmation to the production department or other coldstore Automatically identify the pallets on hoppers for production entrance
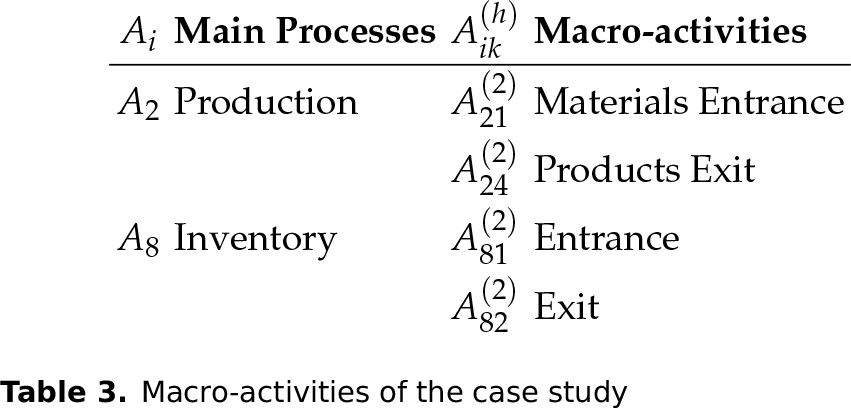
Micro-activities influenced by RFID technology application (see Table 4 – the process object (2) is not shown) were analysed in order to define the effects that the implementation is able to produce. In the following figures, these micro-activities were underlined inside process cycles.
Micro-activities of the case study
3.2.1.1 Pallet creation
The pallet creation phase (see figure 3) is one phase which is less affected by the introduction of the technology: this is due to the fact that almost all the activities need to be manually performed or require sensitive data being entered into the managing system, even after RFID introduction. Indeed, in this phase the operator is called upon to enter the information regarding the material present on the pallet, to select the production line and production orders to which it will be associated, to create the pallet transport order on SAP and to print the relevant logistic fiche.

Pallet creation processes
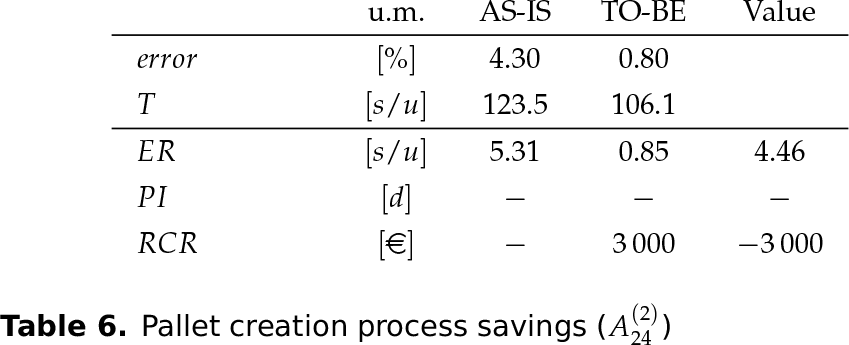
From Table 5 is clear that the introduction of RFID tags allows a process time reduction only for micro-activity
Pallet creation process savings

Pallet creation process savings (A(2)24)
3.2.1.2 Pallets entrance in the coldstore
The pallet entrance in the coldstore phase (see figure 4) is certainly more affected by RFID introduction. The only unchanged operation is the pure manual pallet transfer with the forklift up to the cold room.

Pallet entrance to the coldstore
The barcode scanning activity and transport order confirmation in SAP are the operations made automatic: as mentioned above, they become superfluous by the tag detection and subsequent information exchange with the informative system. This involves not only process time reduction for the forklift operator, as shown in table 7, but also other savings due to error and resource consumption reduction (see table 8).
Time savings of pallet entrance in the coldstore process

Time savings of pallet entrance in the coldstore A(2)81

In fact, the presence of a dedicated person to scanning and confirmation is no longer needed.
3.2.1.3 Pallets shipping from the coldstore
The pallet shipping from the coldstore phase (see figure 5) is analogous to the previous ones described above and in the same way is strongly impacted by the introduction of the RFID technology.

Pallet shipping from the coldstore
The time needed for pallet transportation from the coldstore to the production halls and in the same manner the time needed by the operator to create the SAP transport order remain unchanged.
Most of the time saved in this phase (see table 9) is due to the pallet localization micro-activity that becomes automatic in the TO-BE process. Other important advantages for this phase are shown in table 10.
Time savings of pallet shipping from coldstore process
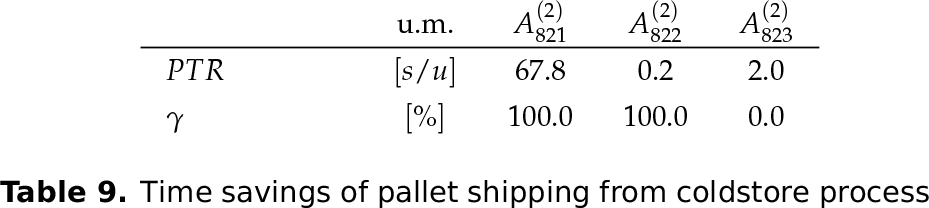
Time savings of pallet shipping from coldstore A(2)82

3.2.1.4 Pallet arrival to the production system
The pallet arrival to the production halls and the material consumption in the production process phase (see figure 6), in terms of time, is strongly influenced by the introduction of the RFID technology. Upon arrival, the material is deposited in hoppers or in tilting machines in order to be able to start to feed the production process, and this operation remains unchanged in both configurations.

Pallet arrival to the production system
The operation that leads to time savings (see table 11) is the automatic confirmation of the transport order, that in the AS-IS process is manually performed by an operator on the system. The tracking system performs these tasks automatically after detecting the RFID tags and reading the data. Savings in terms of ER and RCR are reported in table 12.
Time savings of pallet arrival to the production system

Time savings of pallets arrival to the production A(2)21

3.3. Economic assessment
In this section the performed cost benefit analysis is shown: in fact, to determine the true affordability of an investment, it is impossible to leave out economic considerations. In the previous sections the time savings for each of the four main logistic steps have been identified and quantified. For this analysis, it is worth distinguishing between tangible benefits, and therefore easily “monetizable”, and intangible ones, that can be achieved through the introduction of RFID technology, but that are more qualitative than quantitative.
3.3.1. Operational costs
Tangible benefits are evident: they have to be intended as a cost-cutting previously incurred or increased revenues not previously obtainable. In the presented business case, in the phases of pallet entrance and shipping to and from the coldstore, and of the arrival to the production, a dedicated person becomes unnecessary. This operator could be, for instance, reallocated to another process. In order to assess the savings associated to the reduction of process times, it is necessary to consider the number per year of moved pallets. From the figure
As it can be seen, other pallets used for production come from the raw material warehouse (at room temperature), but they are not considered. For the pilot project under consideration, in fact, only the phases mentioned above are taken into account.
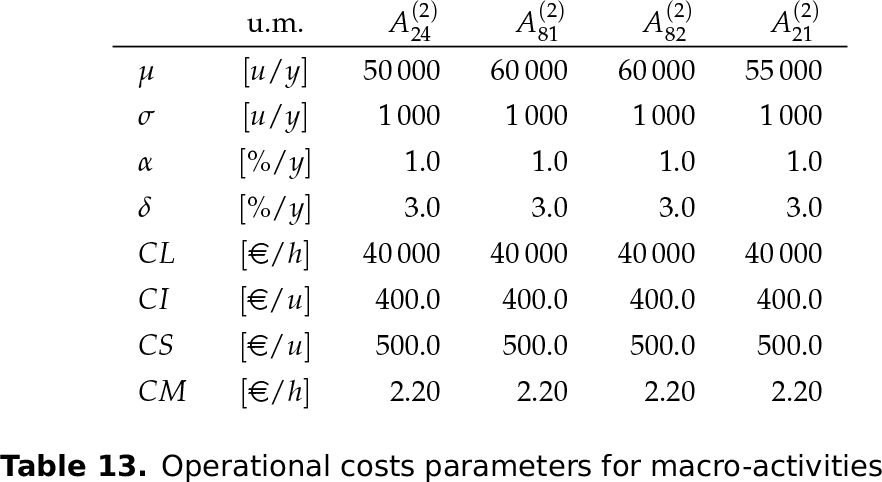
In Table 13 and table 14, operational parameters for each macro-activity and operational global costs parameters are reported. Under the hypothesis, accepted by the company, that these resources might be absorbed by reallocating persons to other missions, it is concluded that the presented economic savings are realizable, see table 15.
Operational costs parameters for macro-activities
Operational global costs parameters

see paragraph 3.3.2.
Operational costs of macro-activities (€)

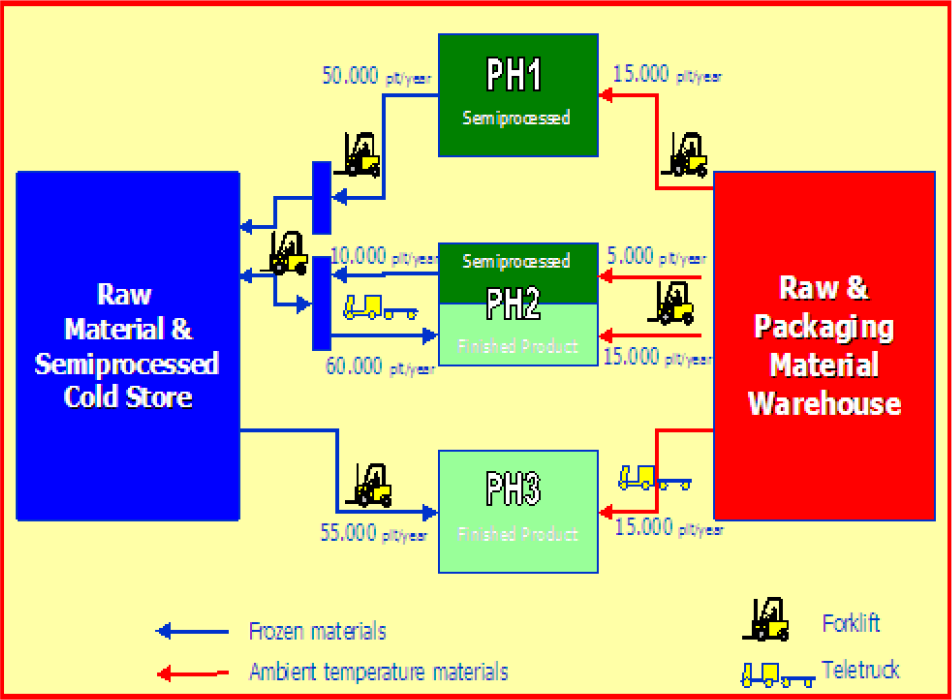
Pallet per year flow among the warehouse, the production halls and the coldstore
The RFID technology introduction in the logistic process has not only led to the reduction of execution times of the processes reported in the precedent paragraphs. Hereafter some of the other benefits deriving from the application of this technology will be illustrated. They are the so-called intangible benefits important for the objectives of error reduction and production streamlining.
3.3.2. Implementation costs
A fundamental part of the pilot project has also been cost evaluation and the choice of the supplier would then help the company and support the future development of this technology in its business. Table 16 shows the hardware components of the RFID system, the quantities and costs. In addition, we indicate the total cost for the purchase of licenses and for the integration of the RFID system with enterprise management software.
Implementation costs

3.3.3. Profitability analysis
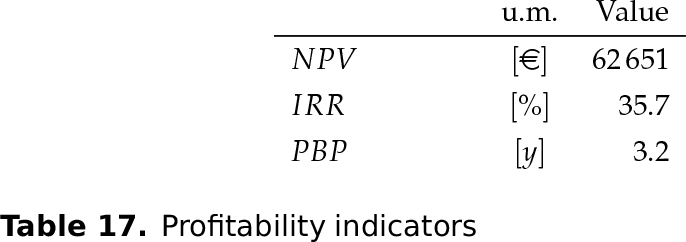
In this paragraph the conclusions on the previously shown financial indexes are taken. In fact, the profitability of the investment is well understood looking at the yearly cost parameters. The NPV has been calculated considering an investment duration of five years and a discount rate of 5.0% per year. The results of all profitability indicators are reported in table 17.
Profitability indicators
3.3.4. Sensitivity and risk analysis
In Table 18 we illustrate the parameter values that influence the NPV. The value of these parameters has been increased by 20% and the new NPVs (+20%) have been calculated for each increment. The percentage increase in NPV (Δ(%)) from baseline (€62 651) and the most significant parameters (p*) have been identified.
Sensitivity analysis

Pessimistic (PE), Optimistic (OE) and Most Likeable (ML) values and the event probabilities have been estimated for this parameters (see table 19).
Sensitivity analysis

Calculating NPV value for all 59 049 (310) factor combinations and the event probability value related to each combination and putting NPV values in increasing order, it is possible to draw the curve in figure 8. From this curve we can identify a 3.1% investment risk, that is the probability that NPV is less than zero.
4. Conclusions
This paper presents the results of the application of an economic evaluation framework to a process streamlining analysis performed with the introduction of the RFID technology in a CPG industry. The principal scope of the project was to comply with the new norms of the sector by means of a better traceability system implementation. The solution identified by the company has been the use of RFID tags to be installed on the transportation pallet. Using this principle, the new tracking and tracing system has been successfully implemented in a pilot project first, and then completely integrated into the nominal procedures. The profitability of the project, in fact, has been rapidly reached and largely demonstrated, with a payback period of nearly 3.2 years. The management was so satisfied by the results of this project that they are pushing the deployment of the new solution to the whole industry.

Cumulative probability of NPV
Thanks to RFID, there is greater pallet traceability: it is always possible to know where the pallet is by consulting times out of coldstore or arrival in production. This also allows a more precise monitoring of the cycle time and throughput time in the different phases of the production system, allowing the identification of bottlenecks and finding areas for improvement. The tracking system under consideration, with the automation of many tasks that were manually performed by operators, offers a significant reduction of human errors committed during the integration of the information systems. The framework also allows evaluating the intangible benefits due to the lack of information about the precedent process. Another area that derives enormous benefits from the introduction of the RFID is the quality assurance. The control of throughput times, in fact, permits knowing exactly the time spent at room temperature for time sensitive materials, which needs to be stored at controlled temperatures (in coldstore). This avoids the use of deteriorated materials in production which are not permitted to be introduced into the market, thereby reducing the risk of huge potential damage to the company.