
Abstract
The competitive nature of the contemporary business scenario requires productivity-driven organizations to be aware of the efficiency level of their dealers. The recent economic and financial crisis has highlighted the need for effective evaluation methods going beyond the limits of traditional performance assessment methodologies in the retail industry. The automotive industry is no exception to this logic. In this sector, traditional methods are often based only on market share performances, ignoring the key role of input-output ratios on the overall productivity of the parent company. Following this lead, in this paper we propose a method to evaluate the performance of dealerships taking into account both their market share performances and their efficiency. In order to assess dealership efficiency we use the DEA technique, and apply the proposed methodology to a multinational automotive company considering its Italian dealer network.
Keywords
1. Introduction
In recent years, the retail sector has been suffering heavily from the economic and financial crisis, which has significantly reduced consumption and sales. In order for firms to remain competitive in the market, efficiency analysis has become an important management issue [1]. The need for greater efficiency has been highlighted as one of the key issues for future survival [2].
In the automotive industry, dealer efficiency is a key factor in obtaining and maintaining competitiveness because it provides fundamental strategic information.
It is therefore of crucial importance to establish a model for assessing the efficiency of the distribution network that may be useful not only for the dealerships but also for the parent company. Usually, automotive parent companies assess their dealership performances according to market share and plan incentive systems by assigning annual sales targets to each dealership.
Nonetheless, a performance assessment based on a comparison between the dealership and the national average market share can lead to misleading estimates and, consequently, to incorrect assigning of annual sales targets. This kind of assessment does not take into account either the availability or the utilization of resources. For example, dealership A may be more efficient than dealership B according to the market share method, although A can obtain a higher output than B (i.e., sell more commercial vehicles) merely because A has a more consolidated presence in the territory (i.e., has had a sales mandate for longer) and/or is located in a more commercially favourable geographical position (i.e., a more highly industrialized region). Therefore, efficiency analysis as a ratio of inputs and outputs is strategically essential.
On this basis, the aim of this paper is to propose a method for assessing dealership performances based on Data Envelopment Analysis (DEA). This kind of assessment could be helpful for motor vehicle manufacturers as well as the dealerships themselves, considering the severe crisis being experienced by European automotive sectors. In Italy, for example, the first months of 2013 showed a 26% drop in registrations of commercial vehicles, compared to the already-low level of 2012 (Study Centre of UNRAE, 2013). Within just two years the market volume has halved. Therefore, both for motor vehicle manufacturers and for dealerships, the efficiency analysis is essential in order to identify the critical issues that must be addressed in order to compete.
The paper is organized as follows. Section 2 gives a brief literature review, Section 3 presents the DEA methodology and Section 4 describes an application of DEA to the Italian dealer network of a multinational automotive company. Section 5 compares the market share and DEA methods, and Section 6 concludes.
2. Literature Review
In order to assess company performance in various industrial sectors, some authors consider economic and financial returns deriving from financial statements [3–6], comparing different time series and companies [7–8]. Other researchers focus on competitiveness indexes, such as market share [9–11]. A third strand in the literature examines three different measures of performance – profit, productivity and price differential – that should be considered simultaneously in order to obtain an overall picture of a company's performance [12–14]. In addition, many studies are based on social issues, focusing on the satisfaction level of employees, customers and, in general, stakeholders [15–18]; others evaluate company performance on the basis of user-perceived quality, considering this a driver for the company success [19–20]. Studies that analyse the productivity and efficiency of companies are of particular interest [21–23], especially those that utilize DEA [24–26].
In the scientific literature about distribution and supply chain [27–30], numerous authors highlight that efficiency measurement is of vital concern at both the operative (store) level and the parent company (strategic) level, since it helps retailers differentiate themselves from other competitors [31–33]. In particular in the automotive industry, dealer efficiency has a significant impact on the control and management of dealerships, and provides vital information for a number of tactical, strategic, and policy-related decisions [34–35].
Retail efficiency has been studied using DEA in several countries (for examples, see [31–33] and [36–38]). However, to our knowledge, there seems to be no published study on the efficiency of dealerships in the automotive industry.
In this paper we evaluate the performances of all the Italian dealerships of commercial vehicles of a large multinational automotive manufacturer, using an approach based on DEA. This methodology is particularly appropriate for evaluating the efficiency of individual stores within a chain because it integrates a variety of performance metrics and provides a structured method for evaluating retail performances [36].
3. The methodology
In this paper we propose a method to evaluate the performance of dealerships taking into account both their market share performances and their efficiency. In order to assess dealership efficiency we use the DEA technique, which is becoming increasingly popular in carrying out benchmarking studies related to firms, products and processes [39–40]. DEA allows management analysts to measure the relative productive efficiency of each member of a set of comparable organizational units based on a theoretical optimal performance for each organization. The organizational units under analysis are defined as Decision Making Units (DMUs); these can be separate firms or institutions, or they can be separate sites or branches of a single firm or agency [41–42]. DEA evaluates the relative efficiencies of DMUs without making any assumptions about the functional relationship between inputs and outputs in these units. It can be applied either in cases where traditional techniques cannot be used or where input and output weights are not predetermined.
While the traditional production function is determined by a specific equation, the DEA envelope is made up of a sample of data which corresponds to assigned decision-making units. Therefore, in DEA, the technical DMU efficiency is defined in relation to the other DMUs of the sample using a benchmark equal to 1, which cannot be exceeded. DEA determines which DMU operates on the efficiency frontier, and consequently which inputs and outputs (belonging to the same DMU) are classified as efficient or inefficient combinations. In this way, the efficient combinations implicitly define a production function and the other combinations of inputs and outputs can be calculated in relation to these (Figure 1).
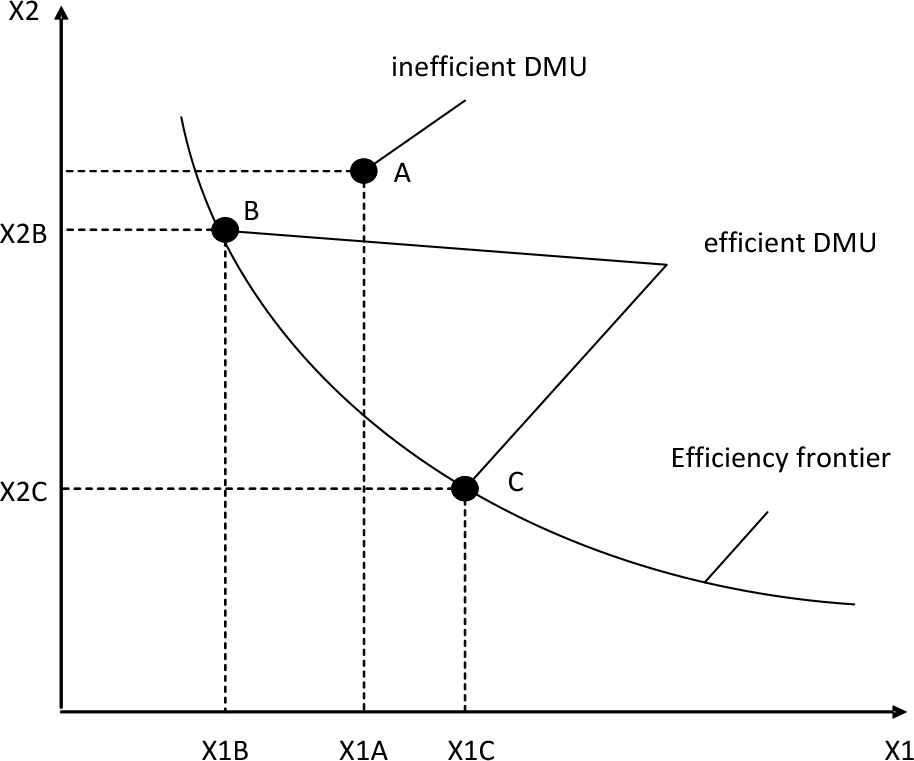
A DEA production frontier, input-oriented.
In particular, the generic DMUj consumes a quantity xj = {xij} of inputs (i = 1,…, m) and produces a quantity yj = {yrj} of outputs (r = 1,…, t), which are set positives.
There are diverse typologies of DEA approaches, which differ because of the return to scale of the production process under analysis (constant or variable), and the orientation of the problem (output-oriented, input-oriented, or input-output-oriented). An input-oriented DEA model aims to reduce the input amount at the present output level, whilst the output-oriented model maximizes the output level at a maximum of the present input consumption. The third option, represented by the Additive model, deals with the input excesses and output shortfalls simultaneously, such that both are maximized [43].
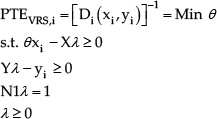
In this paper, we adopt an input-oriented DEA model with constant return to scale (CSR):

In order to individuate the presence of scale efficiency we utilize variable return to scale (VRS) [36]. The model individuates a pure technical efficiency (PTE) that is devoid of scale efficiency:

4. An application of DEA to the Italian retail network of a multinational automotive company
In order to apply DEA to the Italian retail network of a multinational automotive company, we consider the most suitable inputs and outputs for an effective evaluation. Firstly, it is necessary to determine which of the resources available among the inputs the dealership management is able to control. In this case, these are the number of salespeople and the number of outlets. However, the DEA method may also incorporate factors which are not under the control of dealership management in order to ensure equity when evaluating individual dealership efficiency [36]. We therefore consider two inputs that are not under the control of the dealerships, which are nevertheless important for an evaluation of performance: the number of days passed since the dealership received the mandate of sale from the vehicle manufacturer, and the area in which the dealership is located, considered in terms of industrialization and hence potential demand.
In addition to the volume of sales, when evaluating the outputs of a dealership it is important to consider the level of quality standards.
In this paper, the input-oriented DEA model is applied to 81 Italian dealerships, utilizing four inputs (number of salespeople, number of outlets, number of days since the dealership received the mandate of sale, number of local businesses, i.e., potential demand) and two outputs (sales and quality of service) in order to obtain a measurement of efficiency.
The DEA model allows a study of comparative dealership efficiency whereby the retailers which achieve the highest efficiency scores are considered benchmarks. In order to evaluate the efficiency of other dealers, they are then compared to these benchmarks.
The score calculated under a VRS hypothesis only measures the PTE (2). This essentially determines how efficiently the dealership uses the available resources, without taking dealership efficiency of scale into consideration. Therefore, given the output levels and the input costs, the PTE quantifies managerial efficiency, which is the ability of the DMU in question to optimize the available resources and minimize production costs. On the other hand, TE (1) is a global measurement of efficiency, which analyses the quantity of inputs that the most efficient dealership (best practice) requires to produce a certain level of output. Therefore, TE not only takes into account the managerial efficiency, but also the efficiency of scale of the resources available to the DMU. Applying both models (CRS and VRS) to the same data set allows SE (3) to be obtained. The ratio between TE and PTE shows how distant a DMU is from its optimum size and may be considered as an index of scale efficiency (SE), which represents an inefficiency caused by the presence of variable return to scale. By means of SE, the DMU efficiency is obtained by evaluating the available resources with respect to the generated level of output. Thus, the SE allows the work of decision-makers responsible for the DMU sizing to be assessed. Table 1 shows the results of the DEA applied to the 81 dealerships in terms of TE, PTE and SE. Of the sample, 12% is efficient under constant return to scale, while 31% is efficient under variable return to scale. In particular, 27% of the dealerships score more than 50% under constant return to scale, while 68% score more than 50% under variable return to scale. The average TE of the 81 dealerships is 37.95%, while the average PTE is 71.15%. From the analysis of the average technical efficiency of each geographical area (North, Central, and South Italy) the dealerships in North Italy obtain the highest average TE (44%), followed by the dealers in Central Italy (33%), and the dealers in South Italy (32%). The number of efficient dealerships is equally distributed among the three areas. However, about half of the dealers in the North have a higher score than the national average (37.95%), showing that they performed better than the others. With regard to the PTE, North Italy again obtained the best score (74%). Under a VRS hypothesis the dealers in South Italy obtained a very high average score for PTE (72%), which is greater than the average PTE score for Central Italy (65%).
Results of the DEA applied to the 81 dealerships in terms of TE, PTE and SE.
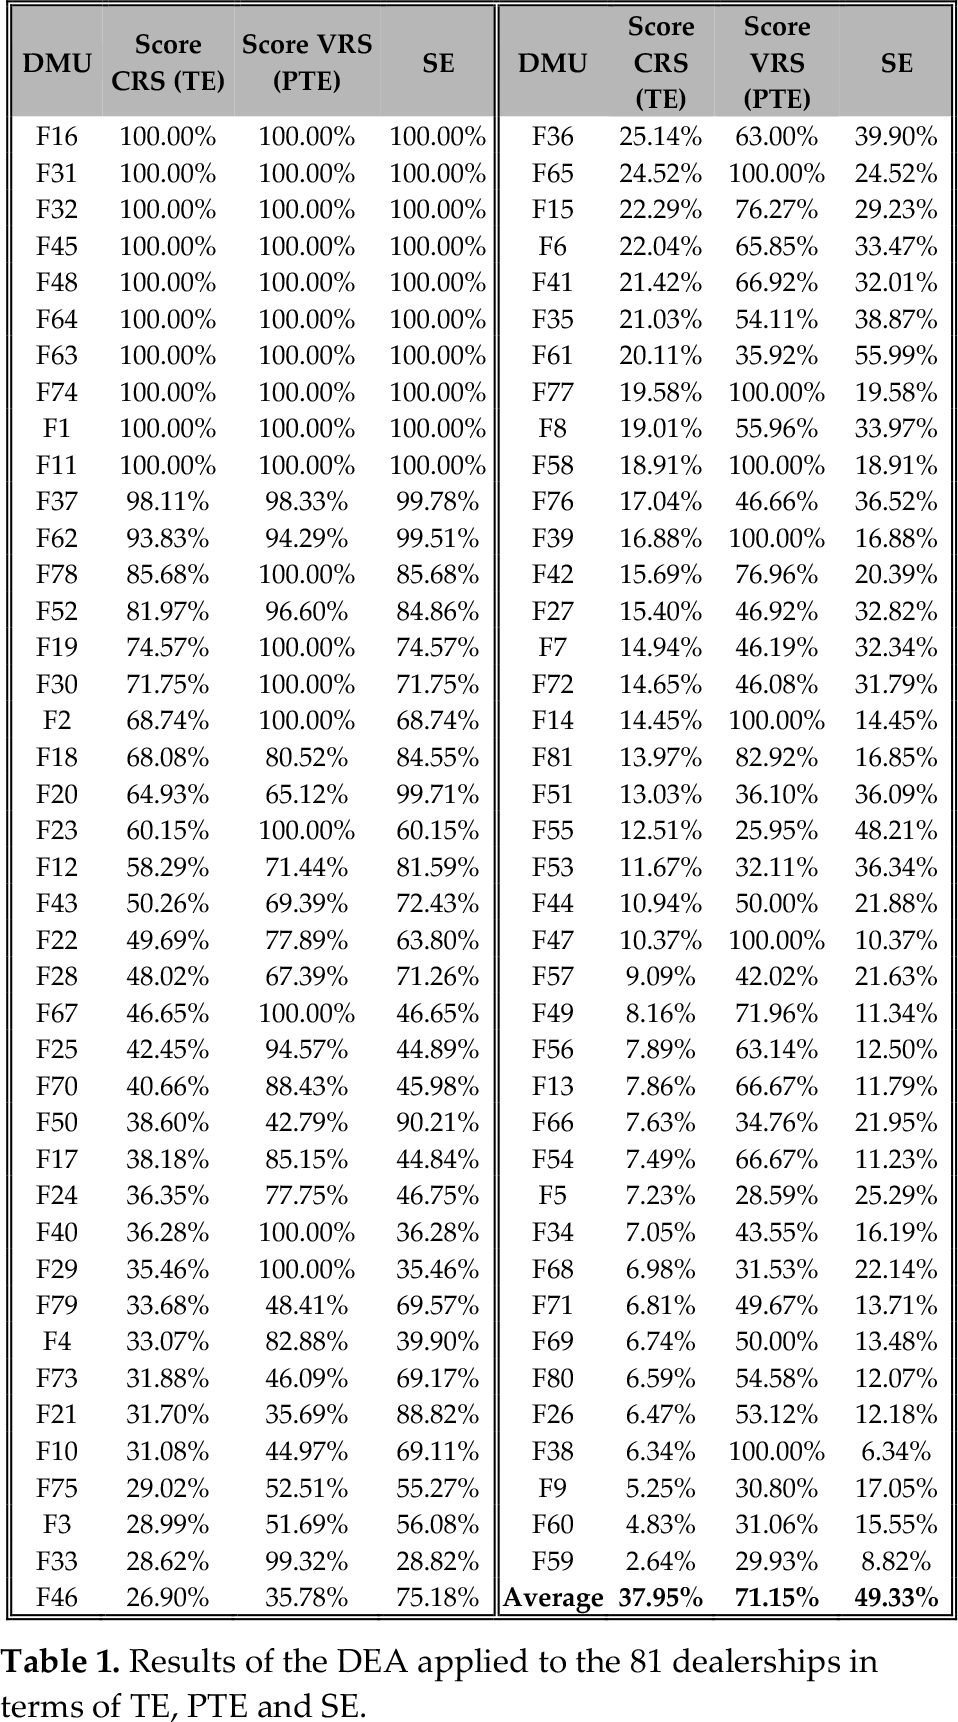
Remarkably, for the dealers in South Italy there is a notable difference between TE and PTE efficiency values; this means that meaning that, in spite of not being very efficient from a scale standpoint, they manage to bridge the gap through considerable effort at a managerial level.
5. Comparison of methods: Market Share versus DEA
The parent company under analysis has always adopted the market share method to evaluate the performance of its dealerships. In the current context of economic crisis, this evaluation method is no longer satisfactory since the true dealership efficiency is not taken into consideration. The traditional market share method only analyses the outputs, completely ignoring the inputs of the sales process.
This section compares the market share and the DEA performance evaluation methods, highlighting the differences between the two methodologies, as well as identifying which dealerships are overestimated and which are underestimated by the market share method.
Figure 2 shows the relationship between the market share scores (X axis) and the technical efficiency scores (y axis) of the 81 dealerships analysed.
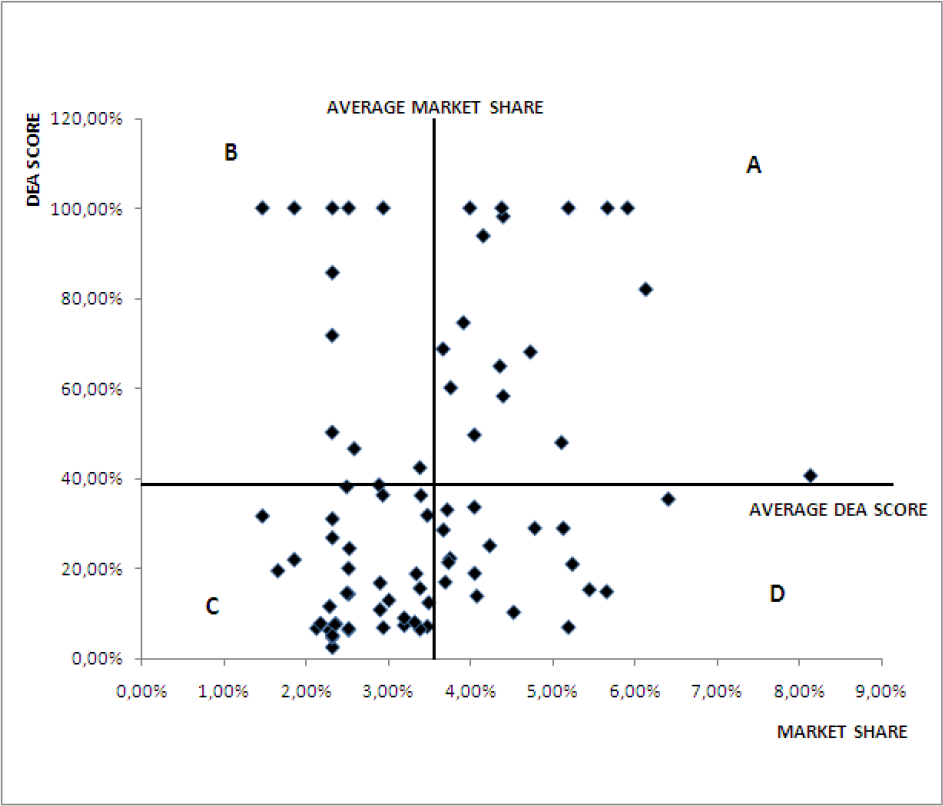
Comparison between the market share score and the DEA score (TE) of the dealerships.
The Cartesian plane has been divided into four areas (A, B, C and D) by the two intersecting lines representing the national average market share score and the national average DEA score. Of the 81 dealerships analysed, 17 are found within area A, in which dealerships are evaluated as better than the national average by both the market share and the DEA methods. Thus, the dealerships in this area of the plane are judged positively by both methods. In area C, the 34 dealerships also have comparable scores by both assessment methods, even though in this area the dealership performance scores are below the national average market score and DEA efficiency.
However, the two models provide very different ratings for dealerships found in the remaining two areas of the plane (B and D). The 12 dealerships in area B, despite having a lower market share than the national average, obtained a better-than-average score with the DEA method. In contrast, the 18 dealers in area D have a market share better than the national average, but nonetheless have a below-average technical efficiency score.
There are in fact as many as 30 dealerships which obtain differing scores when the two methods are applied.
From the data presented in Figure 2, various conclusions may be drawn for each of the areas:
Area A: the dealerships in this area have a remarkable market share and a better-than-average TE score, and are therefore the most efficient units. In particular, their TE scores show high scale efficiency and a considerable ability to optimize available resources. Consequently, these are the dealerships which guarantee to the parent company the best returns in the distribution network. Area B: the dealerships in this area, despite having a low market share, are more efficient than the average. The DEA results show good managerial ability and high scale efficiency. Consequently, it may be advisable to offer more incentives to such dealerships, which could easily increase their outputs by means of increasing their resources (number of salespeople and/or outlets). The situation is more complex for the dealerships which obtain a high technical efficiency score, because of lack of experience or poor potential demand. In such cases, incentives would not be likely to produce an improvement in efficiency, since such variables are exogenous and therefore not modifiable by the dealer. Nevertheless, the parent company should bear in mind the evaluation of such dealerships and consider implementing a reward programme with them, especially because, as they gain experience and the potential demand changes over time, there is a good chance that they will significantly improve their performance. Area C: the dealerships whose performance is rated below average by both methods are in this area. In order to improve these dealerships' performance it may be advantageous to set up a reward programme based on an increase in quantitative and qualitative bonuses. If, after a certain time period, a dealership has not managed to improve its performance in spite of such incentives, the parent company might consider cancelling the mandate of sale. Before taking such a decision, the parent company should obviously verify that the sales coverage of the territory is adequately guaranteed. For this reason, it may be necessary to find substitute dealerships, which could be chosen from among the dealers who already belong to the distribution network. Bearing in mind the geographical dealership distribution, it may be particularly advantageous to choose a substitute dealership belonging to area B. As they are already efficient, such dealerships could benefit from an increase in available resources in order to obtain an even greater market share. If it is not possible to find a substitute for dealers in area C, it may be worthwhile determining a minimum market share threshold. Below this threshold, the dealership presence in the distribution network would no longer be justifiable. Area D: the dealerships in this area have a high market share and are therefore already considered efficient by the parent company. However, their technical efficiency score could indicate either an inability on the part of the management to make the best of the available resources (low PTE), or poor sizing (low SE). The parent company might require the downsizing of the modifiable inputs (number of salespeople and/or outlets) of these dealerships or an increase in their sales targets in order to make them DEA-efficient.
6. Conclusions
The high level of uncertainty that characterizes future market demand in many industrial sectors makes it necessary to use strategic evaluation models in order to optimize investments and sustain demand [45].
The recent economic and financial crisis has considerably reduced consumption and sales, which has had a strong negative impact on the retail sector. In order to survive in such a profoundly unstable environment, assessment of the performance of individual dealerships has become crucial both for the parent company and the dealerships themselves. This paper has analysed the Italian distribution network of a large multinational automotive company. The performance of 81 dealerships with a mandate of sale for commercial and industrial vehicles has been evaluated. Dealership efficiency is measured using a non-parametric DEA method, in contrast to the market share method used by the parent company to date. Correct measurement of dealership efficiency is strategically significant, since dealership efficiency assessment is based the incentives system of the parent company.
The use of DEA allows various factors to be taken into account, including the true sales potential of each dealership, the nature of the sales territory, and the quality of the sales process; in short, the DEA method examines a considerable number of variables which are not considered in the state-of-the-art market share method. DEA focuses on frontiers rather than central tendencies by identifying the limits of efficiency of each dealership, rather than comparing dealerships to the average performance. In addition, the DEA method allows factors to be incorporated which are not under the control of the dealership management, in order to ensure equity in the evaluation of individual dealership efficiency [36].
The DEA method is implemented using four inputs (number of salespeople, number of outlets, number of days since the dealership received the mandate of sale, number of local businesses) and two outputs (sales and quality of service).
A technical efficiency score is calculated for each dealership, which is broken down into two components: efficiency of scale and pure technical efficiency. Thus it is possible to identify the true causes of inefficiency for each dealer, and to find potential solutions to these problems.
The main findings are summarized below:
The efficient dealerships (with a score of 100%) represent 12% of the total dealerships. Due to bad sizing, some of the dealerships obtain a pure technical efficiency greater than the technical efficiency (SE<100%). Depending on the specific dealerships, the badly sized resources are either structural in nature and depend on dealership management, or are due to exogenous causes and do not depend on the dealership management. Through the evaluation of the efficiency of scale, it is possible to identify those dealerships which should downsize (reduce their resources), adopting a policy of cost minimization. The pure technical efficiency scores highlight the need to provide some dealerships with greater incentives, encouraging them to optimize their available resources. The most powerful instrument to improve their efficiency levels consists in varying the sales targets and bonus incentives.
Lastly, this paper provided a comparison between the market share and DEA methods. The results show that the evaluation results for 30 out of the 81 dealerships differ completely between the two methods. This finding warrants the introduction of a new analytical methodology which is capable of providing a more comprehensive assessment of dealership performance in the distribution network. Moreover, the ability to determine which dealerships are less efficient and which factors cause such inefficiency would allow the parent company to employ corrective measures in order to improve performance throughout the entire distribution chain.