
Abstract
Abstract Electric powered wheelchairs have been developed for people with disabilities and the elderly who have difficulties walking and participating in social activities. However, for users with decreased cognitive abilities and judgment due to further aging, mobility aids that are not only powered but also intelligent are required. Intelligent powered wheelchairs with autonomous locomotion functions are one solution to this problem. This research focused on the complexity of coexisting “mobility types” on sidewalks and a prototype intelligent wheelchair equipped with interactive strategies for collision avoidance based on the surrounding mobility type was developed. In order to classify the mobility type of coexisting traffic participants, image-processing components combined with LIDAR were developed. Based on the classification results, the wheelchair selected and executed either a changing-lanes strategy or deceleration strategy autonomously.
Keywords
1. Introduction
Electric powered mobility devices can help people with disabilities and the elderly who have difficulties walking and participating in social activities [1]. Various types of powered wheelchairs with specialized interfaces have been developed for people with disabilities. Similarly, for the elderly, various types of mobility scooters have been developed. However, decreases in cognitive abilities and judgment due to aging make it impossible for some users of mobility aids to drive, even if they were able to drive previously. For aged users with decreased abilities, intelligent mobility aids with autonomous locomotion functions can be helpful.
To date, several intelligent powered wheelchairs have been developed. The useful locomotion functions of intelligent mobility aids can be roughly classified into two categories, namely, semi-autonomous and fully autonomous functions. The semi-autonomous NavChair [2] developed by Simon et al. has some helpful functions, such as obstacle avoidance, door passing and wall following. Similarly, an intelligent powered wheelchair based on a stereo omni-directional system developed by Satoh et al. [3] has semi-autonomous functions to avoid obstacles by monitoring the surrounding environment. The fully autonomous TAO Aicle [4] developed by Matsumoto et al. coordinates with an infrastructure-based sensor system to travel autonomously. These studies developed technologies necessary for autonomous locomotion such as localization and object detection, and achieved safe autonomous locomotion on a certain level.
For an autonomous vehicle moving in crowded locomotion spaces such as pedestrian areas, not colliding with other traffic participants is the most important. On this point, many existing studies focused mainly on algorithms of collision avoidance and not on strategies of collision avoidance. They developed avoiding algorithms basically based on proximity, direction and relative velocity between obstacles and the autonomous vehicle, as shown in Figure 1. Some researches considered autonomous locomotion in pedestrian areas as continued avoidance of pedestrians, who were substitutions of obstacles, as shown in Figure 2. Other researches realized the autonomous locomotion by always stopping the vehicle in front of pedestrians. This research thought that such uniform strategies of collision avoidance were not always effective for smooth and safe locomotion. In addition, such uniform strategies seemed not to be accepted by various traffic participants because traffic participants had socially implicit traffic priorities based on their mobility abilities and social characters. Therefore, we thought that interactive strategies based on additional information were necessary to realize smooth, safe and easily acceptable autonomous mobility aids. This research considered that the key to improved collision avoidance seemed to be interactions with traffic participants, which would enable intelligent mobility aids to utilize additional information.

Existing obstacle avoiding method based on proximity, direction and relative velocity

Existing autonomous locomotion with avoiding pedestrians
With regard to interactive strategies of collision avoidance, Murakami et al. [5] analysed the patterns of collision avoidance of pedestrians and wheelchair users in a hospital and found that strategies of collision avoidance were determined by the situation. Based on the experimental evaluations, their research showed the importance of examining whether or not pedestrians notice the wheelchair. Their research was one of the few studies that considered this interactive strategy. However, because our target driving situations are outdoor pedestrian areas such as sidewalks where various traffic participants coexist, further consideration of the characteristics of driving situations is necessary for the development of our target intelligent powered wheelchair. In this research, at first, we discussed the desired interactive strategies for intelligent powered wheelchairs. Based on the discussions, we designed the autonomous locomotion system with interactive strategies of collision avoidance. Then we developed the prototype system for the purpose of a feasibility test.
2. Interactive Strategy Based on Mobility Type
2.1 Distance-based Strategies of Collision Avoidance
As for the strategies of collision avoidance, avoiding all opposite traffic participants by changing lanes and always stopping in front of them are both typical strategies. Although existing research has adopted either one, both strategies have some advantages and disadvantages, respectively. Avoiding all opposite traffic participants has some risk of colliding with other moving traffic participants. On the other hand, stopping in front of all opposite traffic participants does not achieve smooth locomotion, which frustrates the riders of mobility aids and other following traffic participants. Thus, strategies of collision avoidance need to be interactive with locomotion situations to realize safe, smooth and acceptable intelligent mobility aids. On this point, this research proposes a distance-based interaction strategy as follows:
Short-range interaction, shown in Figure 3 Emergent collision avoidance by deceleration Middle-range interaction, shown in Figure 4 Interactive collision avoidance by deceleration or changing lanes Long-range interaction, shown in Figure 5 Predictive collision avoidance by deceleration, acceleration or changing lanes

Collision avoidance strategy for the short range

Collision avoidance strategy for the middle range
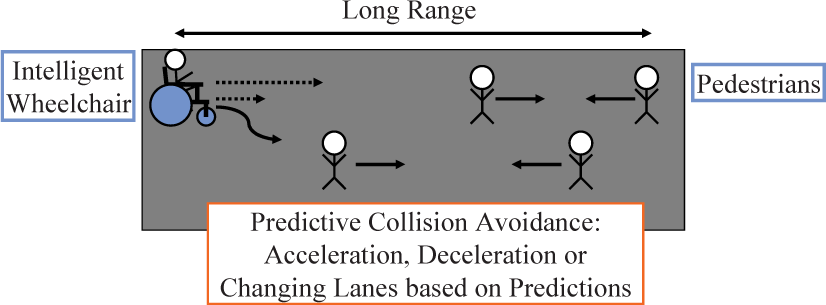
Collision avoidance strategy for the long range
For short range, because the risk of collision is obvious, safety is the most important factor. The vehicle should decelerate and stop in order to avoid collisions in this case. Because the industrial standards, such as Japanese Industrial Standards (JIS), suggest that usual wheelchairs stop with a deceleration distance shorter than 1.5m, this research thought that 3.0m would be an adequate threshold distance for the short-range opposite interaction. Meanwhile, for the middle range (longer than 3.0m), although the risk of collision becomes a little obvious, there are still some options to avoid collision. In this case, since the smooth locomotion is as important as the safe locomotion, interactions with other traffic participants become important. As for the upper threshold distance of the middle-range, natural interaction distances between vulnerable road users and pedestrians would serve as a useful reference. As mentioned in work by Liu et al. [6], the average margin distance between wheelchair users and pedestrians is approximately 5.6m when they avoid each other on a clear sidewalk. Thus, 6.0m, which was determined by rounding Liu's value, was assigned as the upper threshold distance. On the other hand, for long-range, safe locomotion is not as important as smooth locomotion because collision risk is not high. Thus, predictions about the locomotion of other traffic participants become necessary for smooth locomotion.
Of these three interaction strategies, strategies of collision avoidance for the short-range interaction has been discussed enough by existing researches. In addition, our past research [7] developed a predictive strategy for the long-range interaction. Therefore, this research aimed to develop interactive strategies of collision avoidance for the middle-range.
2.2 Mobility Type Classification for the Middle-range Interaction
Figure 6 shows a typical sidewalk assumed as the driving situation in this research. This scenario has a solid wall on one side and faces the road on the other side. The assumed width of the sidewalk was 2.0m, which is the narrowest width allowed for sidewalks in Japan. In such a driving situation, various kinds of traffic participants coexist. Pedestrians, wheelchair users and bicycle riders travel in common spaces, although the bicycle riders have only limited permission for most areas. They have different mobility abilities and social characteristics; therefore, they have different locomotion priorities in response. Thus, interaction strategies for the middle-range need to consider the mobility type of traffic participants. Figure 7 shows the schematic of the interactive strategies. For wheelchair users and slow pedestrians, the vehicle changes lanes to avoid them autonomously when they face each other on the sidewalks. On the other hand, for bicycle riders and fast pedestrians, the vehicle decelerates autonomously with the aim of being passed by. Slow pedestrians are assumed to be elderly, while fast pedestrians are assumed to be healthy and young. Although there are still various kinds of traffic participants in the real world, these four mobility types are the majority. Thus, this research set them as the target mobility types.

Assumed driving situation in this research

Schematic of interactive strategies of collision avoidance
Locomotion designs considering the characteristics of traffic participants have been discussed in the some research fields. For example, in the research field of civil engineering, Kin et al. [8] classified the types of traffic participants by “Travel Mode” for the purpose of the design of city and sidewalks and revealed an implicit order between travel modes by the survey of attitudinal priorities. Similar to their research, designs of autonomous locomotion functions considering the characteristics of surrounding traffic participants would be effective.
2.3 Design of Interactive Avoidance System Based on Mobility Type
In order to realize the interactive strategies of collision avoidance, the vehicle had to obtain the following information about the surrounding situations.
Position and size of static obstacles such as the wall. Position, size and velocity of traffic participants. Mobility type of traffic participants.
In addition, the information listed above must be obtained from a distance. Since 6.0m was assigned as the upper threshold distance of the middle-range interaction, the vehicle must get the information from a distance of at least 6.0m.
In order to classify the mobility type of traffic participants, existing researches proposed two kinds of classification methods: object recognition with LIDARs and image processing with cameras. As the former method, Stefan et al. [9] proposed a classification method between a pedestrian, car, truck and bike with LIDAR. Zhao et al. [10] combined the Markov model with the classification method and improved the accuracy of the classification. The advantage of the former method is that the classification system needs only the LIDAR to classify the objects and to measure distances to the classified objects. However, the former method has disadvantages, such as the system cannot classify the similar objects in the size and the locomotion velocity. Because our classification targets in this research were wheelchair users, pedestrians and bicycle riders, which were similar in front-observed size, our target system could not use the former method. Therefore, our target system mainly adopted the latter image processing method with a monocular camera, though our target system also used LIDAR to get information about the position of traffic participants.
As for the image recognition method, Haarlike [11] and Histograms of Oriented Gradients (HOG) [12] are typical existing methods of image recognition and have good performance in terms of human detection. However, these methods seemed ineffective for our target system because our target mobility types were similar in some parts. Therefore, since much more advanced technologies of image recognition were necessary, this research focused on using a two-stage JointHOG [13] method proposed by Mitsui et al. The HOG method focuses on edge shapes of target images to recognize what they are; then, it calculates histograms of oriented gradients of them. Furthermore, Mitsui's method recognizes images with the combinational occurrences of HOG features and seems to be effective in recognizing partly similar objects.
3. Implementation
3.1 System Summary
Figure 8 shows the appearance of the prototype of the intelligent powered wheelchair developed in this research. This vehicle has a laptop for calculation, a monocular camera for capturing video images and LIDAR for measuring distance information. Table 1 summarizes the devices used for this vehicle. Table 2 summarizes the specifications of the laptop used in this system. Although the vehicle shown in Figure 8 has sensors other than those listed in Table 1, the system did not use them in this research. Because the purpose of this prototype system was feasibility confirmation of the system concept, this system used some devices which were unbefitting for commercial popularization. To develop practical systems suitable for commercial popularization, other trials would be necessary.
Devices used for developed intelligent powered wheelchair

Specification of the laptop used for developed intelligent powered wheelchair


Appearance of the developed intelligent powered wheelchair
Figure 9 shows a flowchart of the proposed system with the interactive strategies. First, the system detects the wall of the sidewalk on the basis of the distance information of the points measured by the LIDAR. Then, the system clusters the remaining points in order to detect objects in the surrounding area and to determine their positions. Afterwards, the system matches the clustered data with the previously obtained clustered data by using the self-locomotion data calculated through the odometry method. As a result of this matching, the system calculates the velocity and direction of the matched objects. The matched cluster data are used to extract images of the candidates of the target mobility type. Using the extracted images, the system classifies the mobility type by combining several two-stage jointHOG detectors. Finally, the system decides the strategy of collision avoidance on the basis of the position, velocity and mobility type of the traffic participant in the situation. The system repeats the sequence and the target processing cycle of the sequence is 8.0Hz. Although the calculation cost varies a little due to the size of detected traffic participants, the measured processing speed almost satisfied the target cycle.
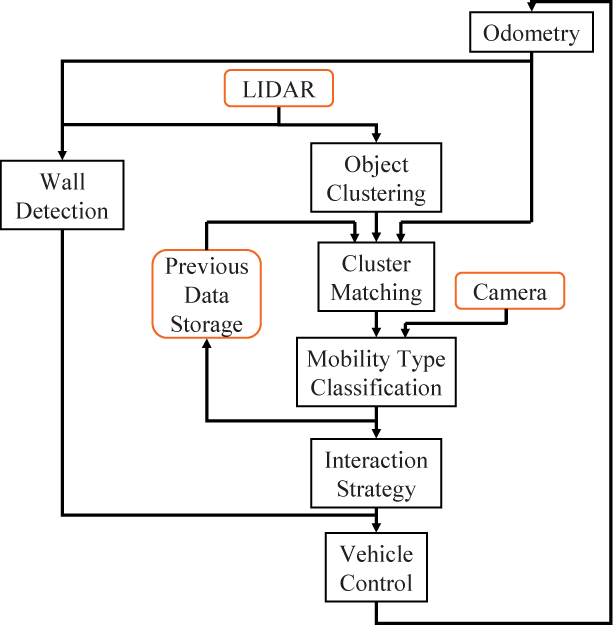
System flowchart of interactive avoidance system
3.2 Wall Detection
Figure 10 shows the definitions of the variables used for wall detection. The wall detection component clusters the candidate points that satisfy the conditions expressed by following formulas:
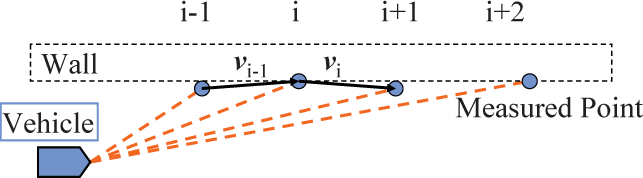
Definitions of the variables for wall detection


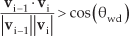
where v denotes the vector between the measured points, Dwd denotes the threshold value of the distance between the measured points and θwd denotes the threshold value of the deviation angle between the vectors. If the detected results are suspicious, the component estimates the direction of the wall by consulting the self-locomotion data calculated through the odometry method.
3.3 Object Clustering and Cluster Matching
Figure 11 shows the definitions of the variables used for object clustering. Using the remaining points not classified as part of the walls, the clustering component gathers the candidate points that basically satisfy the following condition:

Definitions of the variables for object clustering

where di denotes the distance between the measured points and Dcl denotes the threshold value of the distance between the measured points.
Using the clustered data, the system roughly calculates the position and size of the clusters. As the ratio of the shapes measured by LIDAR is less than half of all the shapes, the calculation formulations are simplified as follows:


where
Figure 12 shows the sequence for cluster matching. First, the component translates and rotates the centre point measured in the previous frame by combining the locomotion data through odometry. Although this research used an odometry method as the prototype system for the purpose of feasibility confirmation, feed-forward motion prediction based on time-series values of control input could be used partly as a substitute for odometry. The component then matches the moved points with the current points by the Nearest Neighbour method. After that, the component calculates the velocity and direction of the matched point. In order to stabilize the velocity calculation, the component outputs the results of the velocity calculation based on the moving average value of the time-series velocity.

Sequence for cluster matching
3.4 Mobility Type Classification
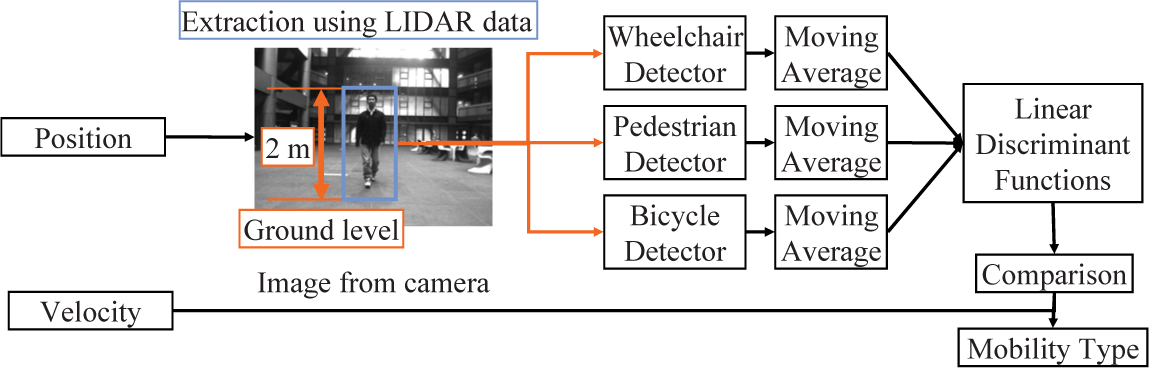
Figure 13 shows the sequence for mobility type classification. Based on the position and size of the cluster, the component extracts the captured image vertically. Similarly, based on the distance of the cluster, the component extracts the image horizontally between the ground level and a certain height. The size of the original images captured by the monocular camera is 640 × 480 pixels. Each jointHOG detector calculates the similarity point of the extracted image. For the similarity, the final calculation results of jointHOG methods were binary in the original research of Mitsui et al. However, because this research wanted to compare the similarity of images for each mobility type, summation values of the classifier in the second-stage Real AdaBoost, which was formulated by the Mitsui's research, were adopted as similarity criteria. Although some non-linear functions of the classifier had possibilities of improving recognition, this research adopted linear calculation of the classifier as the first step. To conduct these processes quickly, the calculations of each detector are parallelized with the openMP library. In order to stabilize the results of the similarity points, the component calculates the moving averages of the similarity points. Furthermore, in order to reduce the differences of the detecting capability of each detector, the component normalizes each result of the moving average with linear discriminant functions. Details and parameter optimization of the linear discriminant functions are explained in the next chapter. Based on the velocity and the comparison results of the normalized similarity points, the component classifies the mobility type of the detected cluster.
Sequence for mobility type classification
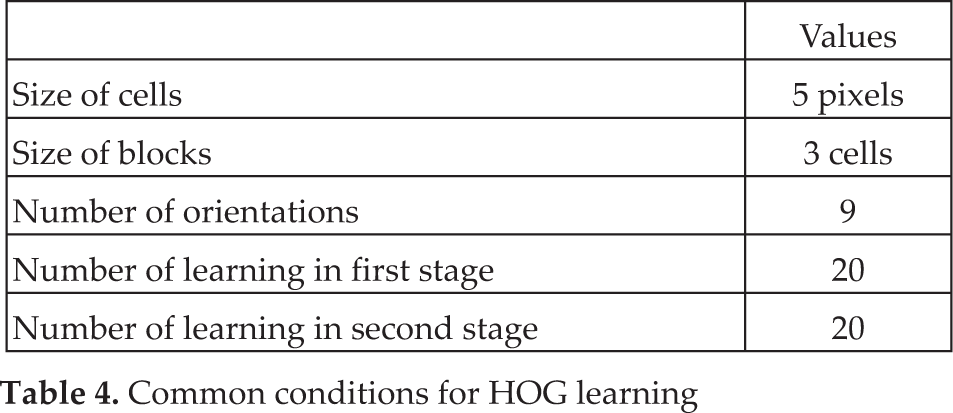
Figure 14 shows examples of the images used for the learning of the HOG detectors. The images for learning consisted of pictures of several collaborators in several places. Tables 3 and 4 summarize the learning parameters. Because these conditions were determined through trial and error, further adjustments are necessary to improve the performance of the detectors.
Respective conditions for HOG learning of detectors

Common conditions for HOG learning
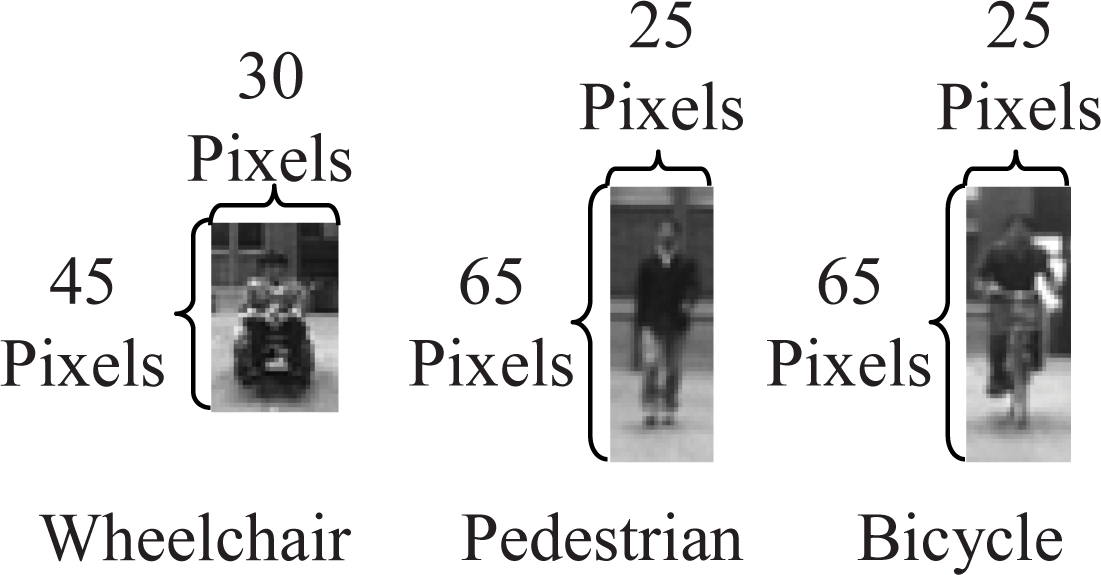
Examples of images used for the HOG learning
3.5 Interaction Strategy and Vehicle Control
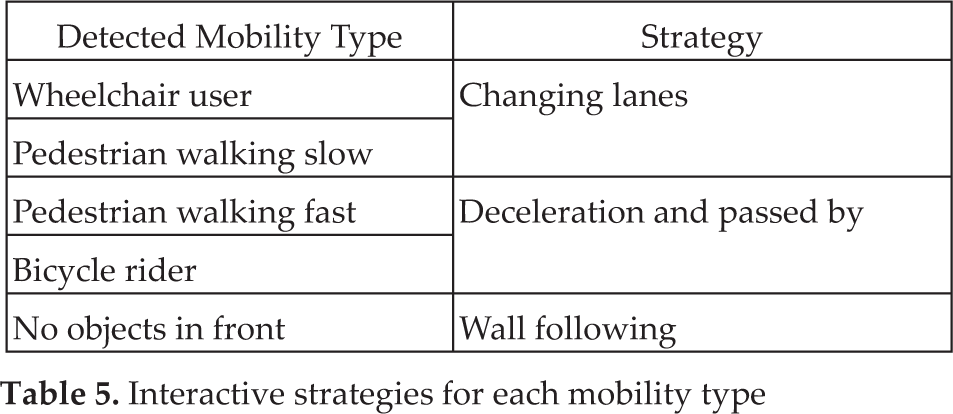
Table 5 summarizes the interactive strategies for each mobility type. For wheelchair users and bicycle riders, the component always decides the constant strategies. For pedestrians, the component changes the strategies on the basis of the velocity of the pedestrian. If the pedestrians, who are assumed to be healthy and young, walk faster than the vehicle, the component selects the deceleration strategy. On the other hand, if the pedestrians, who are assumed to be elderly, walk slower than the vehicle, the component selects the changing-lanes strategy. In the current system, the component selects the strategy by considering only the mobility type of the nearest traffic participants in front of the vehicle. If there are no objects in front of the vehicle, the vehicle moves by following the wall.
Interactive strategies for each mobility type
Based on the strategy determined by the previous component, a vehicle-control component controls the locomotion of the vehicle. The control algorithm is the feedback from the preview deviation to yaw rate of the vehicle and is based on the preview driver models [14]. Figure 15 shows the definitions of the variables used for yaw rate control and the equation for control is expressed as follows:

Definitions of the preview distance

where γt is the control yaw rate of the vehicle, K is the gain for the yaw rate control, Δp is the preview deviation, Δ t is the target value of the preview deviation and Dp is the preview distance. K, Dp and Δt are the variable parameters used for the interactive strategy. The driving velocity was assigned a constant value of 3.0km/h, which is half the value of the velocity permitted for a powered wheelchair on sidewalks.
4. Parameter Optimization for Mobility Type Classification
4.1 Method
In order to optimize the parameters of the classification system, operation confirmations of the system were conducted. As shown in Figure 16, the collaborator approached and the system classified the mobility type. The evaluation focus was on whether or not the system could discriminate each mobility type correctly. The evaluation area was from 3.0m to 13.0m because the system could not capture the whole body of the collaborator within 3.0m. For the verification of the classification system, two collaborators conducted ten trips for each mobility type. These data were used for both initial tests for the system without linear discriminant functions and latter tests for the improved system with them.

Schematic of the experiment scenario
4.2 Classification Results without Linear Discriminant Functions for Normalization
For grasping the characteristics of the classification system without linear discriminant functions, this section explains the results of certain trips of collaborator A for each mobility type. Other results of both collaborators show the common characteristics in varying degrees. Figure 17 shows the similarity points after the moving average process when the opposite mobility type was a wheelchair user. The red, black, and blue lines represent the time-series similarity points for the wheelchair, the pedestrian and the bicycle, respectively. The vertical axis represents the similarity points, whereas the horizontal axis represents the proximity of the collaborator. As the collaborator approached from the far point to the near point, the direction of the collaborator's locomotion is leftward in the graph. At first glance, the point of similarity for the wheelchair, which was the correct type in this case, seems relatively high although the point of similarity for the bicycle has a higher value than that of the wheelchair in some areas. Similarly, Figure 18 shows the moving averaged similarity points of each detector when the opposite mobility type was pedestrian. As for this result, the system could detect the correct type of the collaborator at all area. Figure 19 shows the moving averaged similarity points of each detector when the opposite mobility type was a bicycle rider. Although the system could detect the correct type in the near area, the system made wrong classifications of the collaborator's type in the far area.
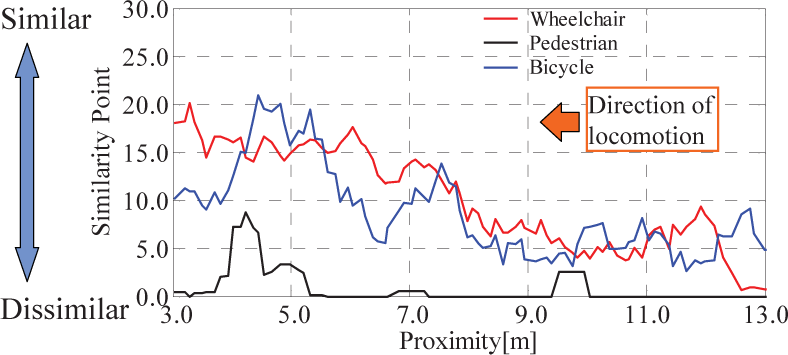
Moving averaged similarity points when opposite mobility type was a wheelchair user
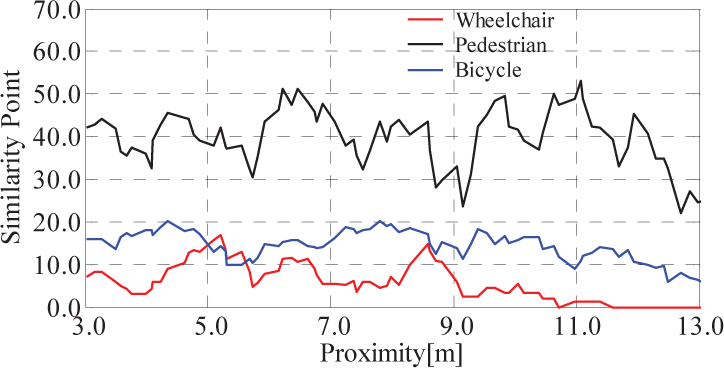
Moving averaged similarity points when the opposite mobility type was a pedestrian

Moving averaged similarity points when the opposite mobility type was a bicycle rider
These results indicate that only simple comparison between the similarity points of each detector cannot classify correctly the mobility type of the detected traffic participants. This is because the detecting capabilities of each detector were different. Since the shape of a pedestrian is clearer than other mobility types from a perspective of edge shapes, the detecting capability of the pedestrian detector was stronger than other detectors. In addition, this is also because our classification targets were partly similar in shape. In fact, the shape of the upper body of the wheelchair user, pedestrian and bicycle rider is almost same. Moreover, both wheelchair and bicycle have the wheel. The effect of these similar shapes seems to be the cause of the misclassification. However, the following tendencies of misclassifications were also confirmed.
For the wheelchair user, the detectors of both wheelchair and bicycle calculated a large value. For pedestrians, only the detector of the pedestrian calculated a large value. For the bicycle riders, the detectors of both pedestrian and bicycle calculated a large value.
The partly similar shapes of each type seemed the reason for these tendencies. These tendencies were common in several trials to various degrees. Therefore, it was expected that normalization with linear discriminant functions could make the accuracy of the classification better than simple comparison.
4.3 Parameter Optimization of Linear Discriminant Functions
The linear discriminant functions for normalization are expressed as follows:
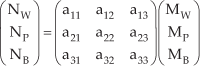
where NW, NP and NB denote the normalized similarity points for wheelchair user, pedestrian and bicycle rider respectively, aij denotes the gain for normalization and MW, MP and MB denote the moving averaged similarity points. To determine the gains, similarity points of ten trips for each mobility type were used. The results of collaborator A were used for parameter optimization and verification, while the results of collaborator B were used only for verification. These data were same ones as mentioned in Section 4.1. With the recorded moving averaged similarity points and assumed normalized similarity points, the gains for normalization were determined with a regression calculation. Assumed normalized similarity points were assigned 1.0 for the correct type, while they were assigned 0.0 for the wrong types.
4.4 Classification Results with Linear Discriminant Functions for Normalization
In order to verify the linear discriminant functions, similarity points of all trips were reanalysed with the linear discriminant functions. Figures 20, 21 and 22 show the normalized similarity points of collaborator A when the opposite mobility type was a wheelchair user, a pedestrian or a bicycle rider, respectively. Each data shown in Figures 20, 21 and 22 corresponds to the data shown in Figures 17, 18 and 19. At first glance, global trends of the classification results seem correct although the system still misclassifies the mobility type in the far area. To numerically evaluate the advantages of linear discriminant functions, correct classification ratios of all ten trips, which were mentioned in Section 4.1, were calculated in each area of proximity. Figure 23 shows the evaluation result of collaborator A. The vertical axis represents the correct classification ratio, whereas the horizontal axis represents the proximity of the collaborator. Within 9.0m the correct classification ratio is above 80.0%. As the target proximity of the distance limit mentioned in Section 2.3 was 6.0m, this system satisfied the initial specification as the classification system. Similarly, Figure 24 shows the evaluation result of collaborator B, whose data were not used for parameter optimization. Similar to the results of collaborator A, the correct classification ratio is above 80.0% within 10.0m. These results confirmed the feasibility of the system concept proposed in this research although the number of collaborator results for the verification was only one. Enhancements of the classification capability and robustness by collecting much more varied shapes of traffic participants and verifying them is necessary to develop practical systems.

Normalized similarity points when the opposite mobility type was a wheelchair user

Normalized similarity points when the opposite mobility type was a pedestrian

Normalized similarity points when the opposite mobility type was a bicycle rider

Correct classification ratio for each mobility type of the collaborator A at each distance

Correct classification ratio for each mobility type of the collaborator B at each distance
5. Confirmation of Driving by Interactive Strategy
5.1 Method
In order to confirm the operation of the whole system including the vehicle control, the vehicle drove on a test course. Figure 25 shows the appearance of the test course, which followed an example of a sidewalk. The width of the test course was 2.0m, which is the narrowest width allowed for a sidewalk in Japan. The test course had imitation walls on one side, while it had red cones on the other side. The collaborator approached from a point farther than 15.0m. The vehicle detected and classified the mobility type of the collaborator while driving on the course. When the collaborator approached the limit distance, the vehicle selected and executed the interaction strategy according to the classified mobility type of the collaborator.

Appearance of the test-driving situation
5.2 Result
Figures 26 and 27 show the driving results when the opposite mobility type was a wheelchair user. On the contrary, Figures 28 and 29 show the driving results when the opposite mobility type was a bicycle rider. The vertical lines in orange indicate the time when the vehicle reached 6.0m before the collaborator. For the situations where the opposite mobility type was a slow pedestrian or a fast pedestrian, results of the same sort were confirmed. As for the deviation distance to the wall shown in Figure 26, the smooth trend after 15.0 seconds is estimated by the odometry component because the vehicle reached almost the end of the test course. From the figures, it can be confirmed that the vehicle can classify the mobility type correctly and execute the correct interaction strategy. From these results, this research confirmed the least operation of the proposed system, which utilized additional information about surrounding traffic participants and behaved interactively.

Driving results when the opposite mobility type was a wheelchair user

Sequence of photos when the opposite mobility type was a wheelchair user
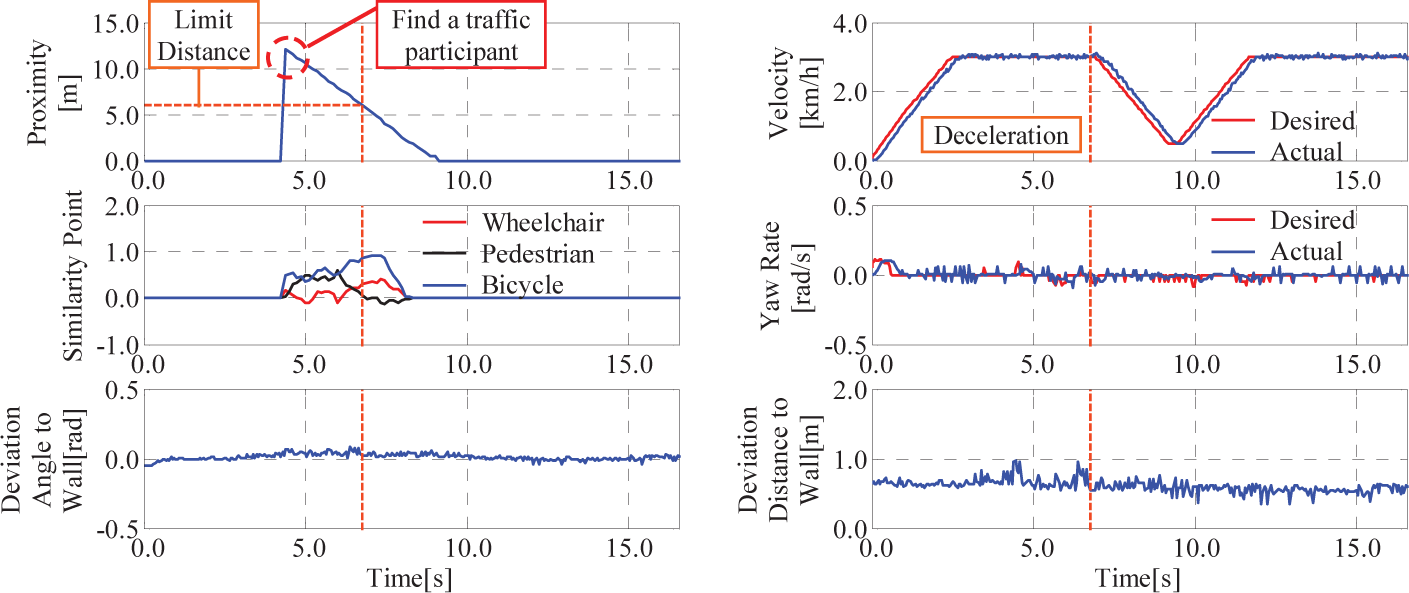
Driving results when the opposite mobility type was a bicycle rider

Sequence of photos when the opposite mobility type was a bicycle rider
6. Conclusion
The objective of this research was to design a concept of interactive strategies of collision avoidance based on the surrounding mobility types and develop an intelligent powered wheelchair equipped with prototype systems for the purpose of feasibility confirmation. Considering the characteristics of the driving situations where various mobility types coexist, an interactive avoidance system was designed. Furthermore, a prototype intelligent powered wheelchair was constructed to classify between mobility types. With the linear discriminant functions, the performance of the classification component was improved so that the system could classify the mobility type at a certain level. In addition, we confirmed that the vehicle drove and behaved safely by the proposed interactive strategies.
However, we have still many future works. The processing speed of the current system was not fast. In addition, the system could only classify between four mobility types based on image processing and estimated velocity, even though many more types of mobility types coexist in the real world. To solve these problems, hardware implementation of image processing for further parallelized and fast calculation may be effective. In addition, as the assumed driving situation, where only one traffic participant coexisted, was very simple, system expansion for the more complex and crowded situations is also going to be one of our future works. Furthermore, optimizations of system devices which can be added to usual powered wheelchairs are necessary for the commercial popularization.
7. Acknowledgments
This work was supported by Grant-in-Aid for JSPS Fellows 10J08623.