
Abstract
Abstract The uniform discrete curvelet transform (UDCT) is a novel tool for multiscale representations with several desirable properties compared to previous representation methods. A novel algorithm based on UDCT is proposed for the fusion of multi-source images. A novel fusion rule for different subband coefficients obtained by UDCT decomposition is discussed in detail. Low-pass subband coefficients are merged to develop a fusion rule based on a feature similarity (FSIM) index. High-pass directional subband coefficients are merged for a fusion rule based on a complex coefficients feature similarity (CCFSIM) index. Experimental results demonstrate that the proposed algorithm fuses all of the useful information from source images without introducing artefacts. Compared with several state-of-the-art fusion methods, it yields a better performance and achieves higher efficiency.
1. Introduction
With the application of image sensors in many fields, multi-source image fusion techniques are increasingly important. Images of a scene can be captured using different sensors, times, angles and distances. These images may contain a large amount of different content that can provide complementary and redundant information. Image fusion approaches can transform all the important information from each source image into a fused image while eliminating superfluous data. The fused image can provide a better description of a scene than any of the individual source images [1, 2]. In many image-based application fields, image fusion is widely regarded as an important and promising research area. So far, image fusion has been successfully used in many real-world fields, such as defence surveillance, medical imaging, remote sensing and computer vision [3–5].
During the last decade, there has been much research into image fusion methods and numerous tools have been developed to solve different problems. These can be categorized into spatial domain and transform domain techniques [6]. However, fusion methods based on multiscale decomposition [7] in the transform domain are increasingly popular because of their better robustness and reliability. Pyramid-based [8–11] and discrete wavelet transform (DWT) [12–14] approaches are typically used in image fusion. Of these, DWT methods have some advantages, such as: temporal–frequency localization, increased directional information and low redundancy [15, 16]. However, DWT approaches also have some drawbacks in practical applications. A 2D DWT is directly constructed as the tensor product of two 1D transforms, so it has only limited directions and is isotropic for each scale and location. In addition, DWT methods cannot effectively represent a signal that has features along smooth curves. To overcome these drawbacks of DWT in image analysis, a large number of new multiscale transforms have been developed in recent years. Examples include ridgelets [17], curvelets [18], contourlets [19] and NSCT [20]. Compared to traditional transforms, these are true 2D image representation tools with multiscale, multi-direction and anisotropy features.
The principle for selecting coefficients is another key step in image fusion. A variety of fusion strategies have been discussed in the literature and these can mainly be divided into three categories: pixel-based, window-based and area-based [21–23]. Window-based and area-based fusion rules make full use of the local characteristics of neighbourhood pixels and thus are superior to pixel-based rules [24].
In 2010, Truong and Chauris proposed a uniform discrete curvelet transform (UDCT), for which the forward and inverse transforms form a tight and self-dual frame [25]. This means that input images can be reconstructed perfectly. As a novel tool for multiscale representation, UDCT has higher approximation accuracy for geometric shapes and optimal sparsity. UDCT has several desirable properties for image analysis, such as a lower redundancy ratio, a hierarchical data structure and easy implementation. In addition, UDCT runs rapidly and fully satisfies image fusion processes in practice. Moreover, UDCT is shift-invariant in an energy sense for each complex band. Therefore, we applied UDCT to the field of multi-source image fusion for the first time.
The major contribution of this paper is the proposal of a novel fusion algorithm for multi-source images based on UDCT and a feature similarity (FSIM) index [26]. The input images are decomposed into subbands at different scales and directions using UDCT. Low-pass subband coefficients are merged to develop an FSIM-based fusion rule. The gradient magnitude component in the FSIM index is obtained by considering horizontal, vertical and two diagonal directions. In this way, the local features of an image can be better represented than when only horizontal and vertical directions are considered. The high-pass directional subband coefficients are merged to develop a CCFSIM-based fusion rule. Redundant and complementary regions can easily be distinguished according to FSIM and CCFSIM index values. A weighted average process is used for the redundant region and a selection process is applied for the complementary region [27]. The local energy is used as a saliency measure in the low-pass subbands. Feature magnitude (FM) is used as a saliency measure in the high-pass subbands. The proposed fusion rule improves the performance of fusion systems to yield better quality fused images.
The remainder of the paper is organized as follows. Section 2 reviews basic UDCT theory in brief. Section 3 describes the proposed image fusion algorithm in detail. Section 4 presents and discusses the experimental results. Section 5 concludes.
2. Uniform discrete curvelet transform
In this section, we briefly review UDCT theory and the properties [25] used in subsequent sections.
UDCT is a new version of the discrete curvelet transform that is based on multirate filter bank (FB) theory. UDCT is implemented in the Fourier domain and is designed as a multiresolution FB consisting of a set of discrete filters and decimation and up sampling blocks. This takes advantage of both an FFT-based discrete curvelet transform and an FB-based contourlet transform.
To illustrate the structure of multiscale UDCT decomposition, a three-level UDCT FB is displayed in Figure 1(a) for J=3 (1≤j≤J) scales and 2Nj=3×2 n (n≥0) directional bands for the jth scale. The number of directional subbands satisfies the parabolic scaling rule.

Structure of the multiscale UDCT. (a) Iterative multiple level of UDCT. (b) Equivalent FB.
First, a set of 2N 2D directional filters F1(ω),l = 1,⃛,2Nj and a low-pass filter F0(ω) are constructed, for which the directional subbands and the low-pass subband can be decimated without aliasing. Since the directional filters have one-sided support in the frequency domain, they have complex subband coefficients. The 2D signal x(n) is filtered using F1(ω) and F0(ω). Second, the filtered signals are down sampled with three decimation ratios for the 2N directional bands and the low-pass band for the (2N+1)th band FB. D0(N) is the decimation ratio for the low-pass band. D1(N) and D2(N) are the decimation ratios for the first and last 3×2 n directional bands, respectively. The three decimation ratios are:

Finally, a multiscale UDCT is constructed by cascading the same FB at a lower band, i.e., the output of D0(N) in Figure 1(a).
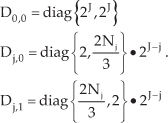
However, in practical implementations, UDCT does not need to follow an iterative structure as in Figure 1(a). It can be implemented directly, as in Figure 1(b). All the curvelet functions are estimated at once according to the number of scales and directions of the transform. In Figure 1(b), F̂j,1(ω) denotes the directional filters for scale j and direction l corresponding to Fl(ω). The equivalent low-pass filter is F̂0(ω), corresponding to F0(ω). With the equivalent filters, the decimation ratios D0,0, Dj,0 and Dj,1 are defined as:
The UDCT inherits the advantages of both curvelet and contourlet transforms. Moreover, compared to existing transforms, it has several additional properties such as a lower redundancy ratio, a hierarchical data structure, easy implementation and shift invariance for each complex band in the energy sense. The lower redundancy ratio of UDCT is very practical in industrial applications. A more detailed description is available elsewhere [21].
3. Feature-based image fusion with UDCT
In this section, a novel fusion algorithm based on UDCT and the FSIM index is discussed in detail.
Figure 2 illustrates the block diagram of the proposed image fusion algorithm. To simplify the discussion, we only consider a pair of source images (A and B) that are merged into a composite image (F). Again, it is assumed that the source images have been registered. The key idea in Figure 2 is that a pair of input images is decomposed into different subbands using UDCT and the FSIM index and CCFSIM index are then used to combine the subband coefficients. Finally, the fused image is reconstructed by applying the inverse UDCT to the merged coefficients. The proposed image fusion approach consists of the following steps:

Block diagram of image fusion based on UDCT and the FSIM index.
As discussed in Section 1, besides multiscale transform methods, fusion rules are also key factors in image fusion schemes. Existing fusion rules have been described in detail elsewhere [7]. Considering the characteristics of the subband coefficients decomposed by UDCT, the FSIM index [26] is used as an additional tool to discriminate complementary and redundant regions between the source images. The FSIM index is a measure of feature similarity among images. Phase congruency (PC) and image gradient magnitude (GM) are two components of the FSIM index. As complementary components, PC and GM reflect different aspects of the human visual system.
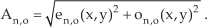
First, convolution between 2D log-Gabor filters and the input image f(x,y) yields a set of orthogonal vectors [en,o(x,y),on,o(x,y)] for scale n and orientation o. The local amplitude is defined as:
The PC at position (x, y) is defined as:
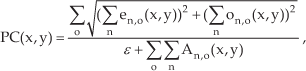
where ε is a small positive constant and the value of PC lies between 0 and 1. The closer PC is to 1, the more salient the feature.
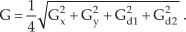
The image gradient can be computed using convolution masks. Sobel [28], Prewitt [28] and Scharr [29] are commonly used gradient operators. The Scharr operator can be used to obtain horizontal and vertical image gradients [26]. However, GM is obtained by considering horizontal, vertical and two diagonal directions in the present study. In this way, the local features of an image can be better represented than when only horizontal and vertical gradients are considered. Horizontal, vertical and diagonal Sobel operators are applied to the image and four directional gradients (Gx, Gy, Gd1 and Gd2) are obtained. The horizontal, vertical and diagonal Sobel operators are written as:

The GM of input image f(x, y) is then defined as:
The similarity SL(x, y) for input signals f1(x, y) and f2(x, y) is defined as:
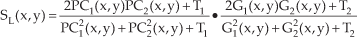
where T1 and T2 are positive constants and SL(x, y) is a real number between 0 and 1.
The FSIM index between f1(x, y) and f2(x, y) is defined as:

where PCm(x,y)=max(PC1(x, y), PC2(x, y)) is used to weight the importance of SL(x,y) in the overall similarity measure. Ω denotes the image region.
The high-pass directional subband coefficients provide detail-rich information. They can effectively express salient features of images such as edges, lines and contours. The residual low-pass subband coefficients represent the main energy of source images and provide rich structural information. Here, the FSIM index is applied to the low-pass coefficients to distinguish complementary and redundant regions. According to the FSIM score, a weighting or selecting rule is used to merge coefficients. The high-pass subband coefficients of the UDCT decomposition are complex. Accordingly, a CCFSIM index was developed by considering phase changes for the complex coefficients.
3.1 Fusion rule for low-pass subband coefficients
A fusion rule for the low-pass subband was developed based on the local region defined around centre point (x,y). The size, M×N, is 3×3 or 5×5. Using (4) and (6), PC and GM maps are first obtained using a sliding window for the overall low-pass subband. The FSIM index between coefficients
The FSIM index reflects the similarity of low-pass subband coefficients between input images. The FSIM value is used to distinguish redundant and complementary regions. A threshold T is defined between 0 and 1. Here, we take T=0.7. Regions with FSIM≥T have high similarity and there is redundant information between coefficients

where the weights ωA(x,y) and ωB(x,y) depend on the local energy of the coefficients
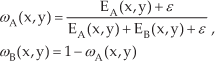
where ε is a small positive constant used to avoid a denominator of zero. The local energy of the low-pass coefficients is defined as:
where w(x,y) is an M×N Gaussian template with a standard deviation of 0.5. The sum of the coefficients in the Gaussian template is 1, in order to enhance the robustness of the algorithm.
For regions with FSIM<T, the low-pass subband coefficients
3.2 Fusion rule for high-pass subband coefficients
This section describes the fusion process for high-pass directional subband coefficients

where Ω denotes a local region of size M×N, k is a small positive constant that improves the robustness of the CCFSIM index and
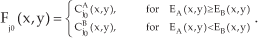
When the high-pass coefficients for the jth scale and lth orientation are merged, the threshold is first defined as T=0.7. For regions with CCFSIM≥T, there is more shared information and more redundancy among source images, so a weighted method is selected. For regions with CCFSIM<T, little information is shared and the source images are complementary. In this case a selection method is used to preserve detail information in the source images. The proposed fusion scheme is written as:
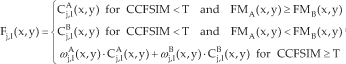
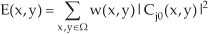
where FM(x,y) is the feature magnitude of the region, defined as:

PC(x,y) and G(x,y) can be extracted from the PC and GM maps obtained when computing the CCFSIM index. w(x,y) is an M×N Gaussian template with a standard deviation of 0.5. The sum of the coefficients in the Gaussian template is 1. ε is a small positive constant; here, we set ε=1. In addition, α and β are applied to adjust the relative importance of PC and GM. Here, we use α=1 and β=2. FM represents local features and the amount of information contained in the image. FM can effectively represent salient features in the high-pass subbands of source images.
The weights
Finally, all the UDCT coefficients are merged and the inverse UDCT is applied to the coefficients of the fused image for reconstruction.
4. Experiments and analysis
In this section, the proposed algorithm is tested on several sets of images. The results are compared with those for different fusion algorithms to validate the performance. For comparison, we use the discrete wavelet transform (DWT), contourlet transform (CNT), nonsubsampled contourlet transform (NSCT), shiftable complex directional pyramid transform (SCDPT) [31] and UDCT-simple. All of these use averaging and absolute maximum selection schemes for merging low- and high-pass subband coefficients, respectively.
Four sets of different image types were tested to evaluate the performance of the proposed algorithm: a set of out-of-focus images, a set of multimodal medical images, a set of images of navigation aids for helicopter pilots and a set of remote sensing images. The image data were evaluated using subjective visual inspection and objective assessment tools. The parameters for the different fusion algorithms are shown in Table 1.
Parameters for the different fusion methods

4.1 Visual analysis
The first experiment was performed on a pair of out-of-focus clock images with perfect registration, as shown in Figure 3. Comparison of the source (Figure 3(a), (b)) and fused images (Figure 3(c)–(h)) shows that important information in the source images is well integrated. However, the images fused using DWT and CNT (Figure 3(c),(d)) are not clear enough and have lower contrast; artefacts were also introduced. The images fused using the other approaches (Figure 3(e)–(h)) are obviously clearer and have stronger contrast than the DWT and CNT results. The differences among the images in Figure 3(e)–(h) are very slight, so it is difficult to evaluate the image quality by direct visual inspection. To observe the image quality in more detail, one area in the images was magnified.
Figure 4(a)–(f) shows magnified images of the region marked by the boxes in Figure 3(c)–(h). The performance of the different fusion algorithms can be observed from these magnified images. The DWT-based fused image has edge bends and serious deformation (Figure 4(a)). The wavelet transform has limited directions and cannot characterize smooth curves. Thus, aliasing easily occurs and leads to image distortion. The CNT-based fused image in Figure 4(b) has a similar problem to that of Figure 4(a). The quality of the images fused using the NSCT, SCDPT and UDCT-simple methods is significantly better and the edges are smoother (Figure 4(c)–(e)). However, slight image distortion is still evident. NSCT, SCDPT and UDCT are multiscale and multi-directional tools for image representation. They have several desirable features, such as high approximation accuracy for geometric shapes, good sparsity representation and an optimal frequency response. Consequently, the fused images in Figure 4(c)–(e) have better visual quality than those in Figure 4(a),(b). However, the NSCT, SCDPT and UDCT-simple fusion schemes are pixel-based simple fusion rules that do not consider neighbourhood pixels. Thus, they are sensitive to noise and artefacts can easily be introduced. Compared to the other fused images, the UDCT-FSIM image in Figure 4(f) shows optimal quality, with the best visual effect and smoother and sharper edges. This comparison reveals that the UDCT-FSIM-based approach effectively determines complementary or redundant information between source images. It can preserve all the important information of the source images while avoiding artefacts. In addition, UDCT-FSIM has greater robustness. In conclusion, the proposed fusion algorithm has optimal performance.

Out-of-focus source images (256 level, size 256×256) and fused images: (a) focus on the right-hand clock; (b) focus on the left-hand clock; and fused images using (c) DWT, (d) CNT, (e) NSCT, (f) SCDPT, (g) UDCT-simple and (h) UDCT-FSIM methods.

Magnified regions from the fused images in Figure 3(c)–(h) using (a) DWT, (b) CNT, (c) NSCT, (d) SCDPT, (e) UDCT-simple and (f) UDCT-FSIM methods.
Figures 5–7 show source images and images fused using different fusion algorithms for different applications. The visual effects for the image sets were the same as for Figure 3. Image fusion by the UDCT-FSIM based approach perfectly preserved useful information and the fused image is close to the source images. For the other fusion methods, loss of information and distortion are evident for the fused images. Thus, the proposed fusion algorithm yields better performance for both multifocus and multimodal images.

Medical source images (256 level, size 256×256) and fused images: (a) CT image; (b) MR image; and fused images using (c) DWT, (d) CNT, (e) NSCT, (f) SCDPT, (g) UDCT-simple and (h) UDCT-FSIM methods.
4.2 Quantitative analysis
Visual analysis was used to evaluate four image sets, but this is very subjective. Observers may report different results for an image, depending on experience and perspective. Thus, visual assessment alone is not an accurate measure of algorithm performance. Therefore, objective quantitative analysis tools were also used to evaluate the performance of different fusion algorithms. Three metrics were used for evaluation: information entropy (IE), mutual information (MI) [32] and an objective image fusion performance measure (QAB/F) [33]. IE quantifies the average information content in an image. MI indicates how much of the input information the fused image contains. QAB/F, proposed by Xydeas and Petrović, reflects the preservation of input edge information in the fused image. The larger the values for the three metrics, the better are the fusion results.
The results show that the DWT and CNT methods are the worst. However, for Figure 3, IE is greater for the DWT and CNT methods than for the other approaches. The results are from the introduction of redundant information to increase the information content. For Figure 6, QAB/F is slightly lower for UDCT-FSIM than for the other methods, but the IE and MI results are better than for the other algorithms. The results for the NSCT, SCDPT and UDCT-simple approaches are only slightly different. This is consistent with the subjective visual analysis. Compared with other fusion algorithms, the proposed UDCT-FSIM approach yields better performance. Consequently, the UDCT-FSIM transforms more underlying information from the source images to the fused image and reduces redundancy, while avoiding the introduction of artefacts. The quantitative results are consistent with the visual analysis, confirming that the proposed UDCT-FSIM algorithm yields satisfactory image fusion results.

Source and fused images of navigation aids for helicopter pilots (256 level, size 256×256): (a) source low-light-television (LLTV) sensor image; (b) source thermal imaging forward-looking-infrared (FLIR) sensor image; and fused images using (c) DWT, (d) CNT, (e) NSCT, (f) SCDPT, (g) UDCT-simple and (h) UDCT-FSIM methods.
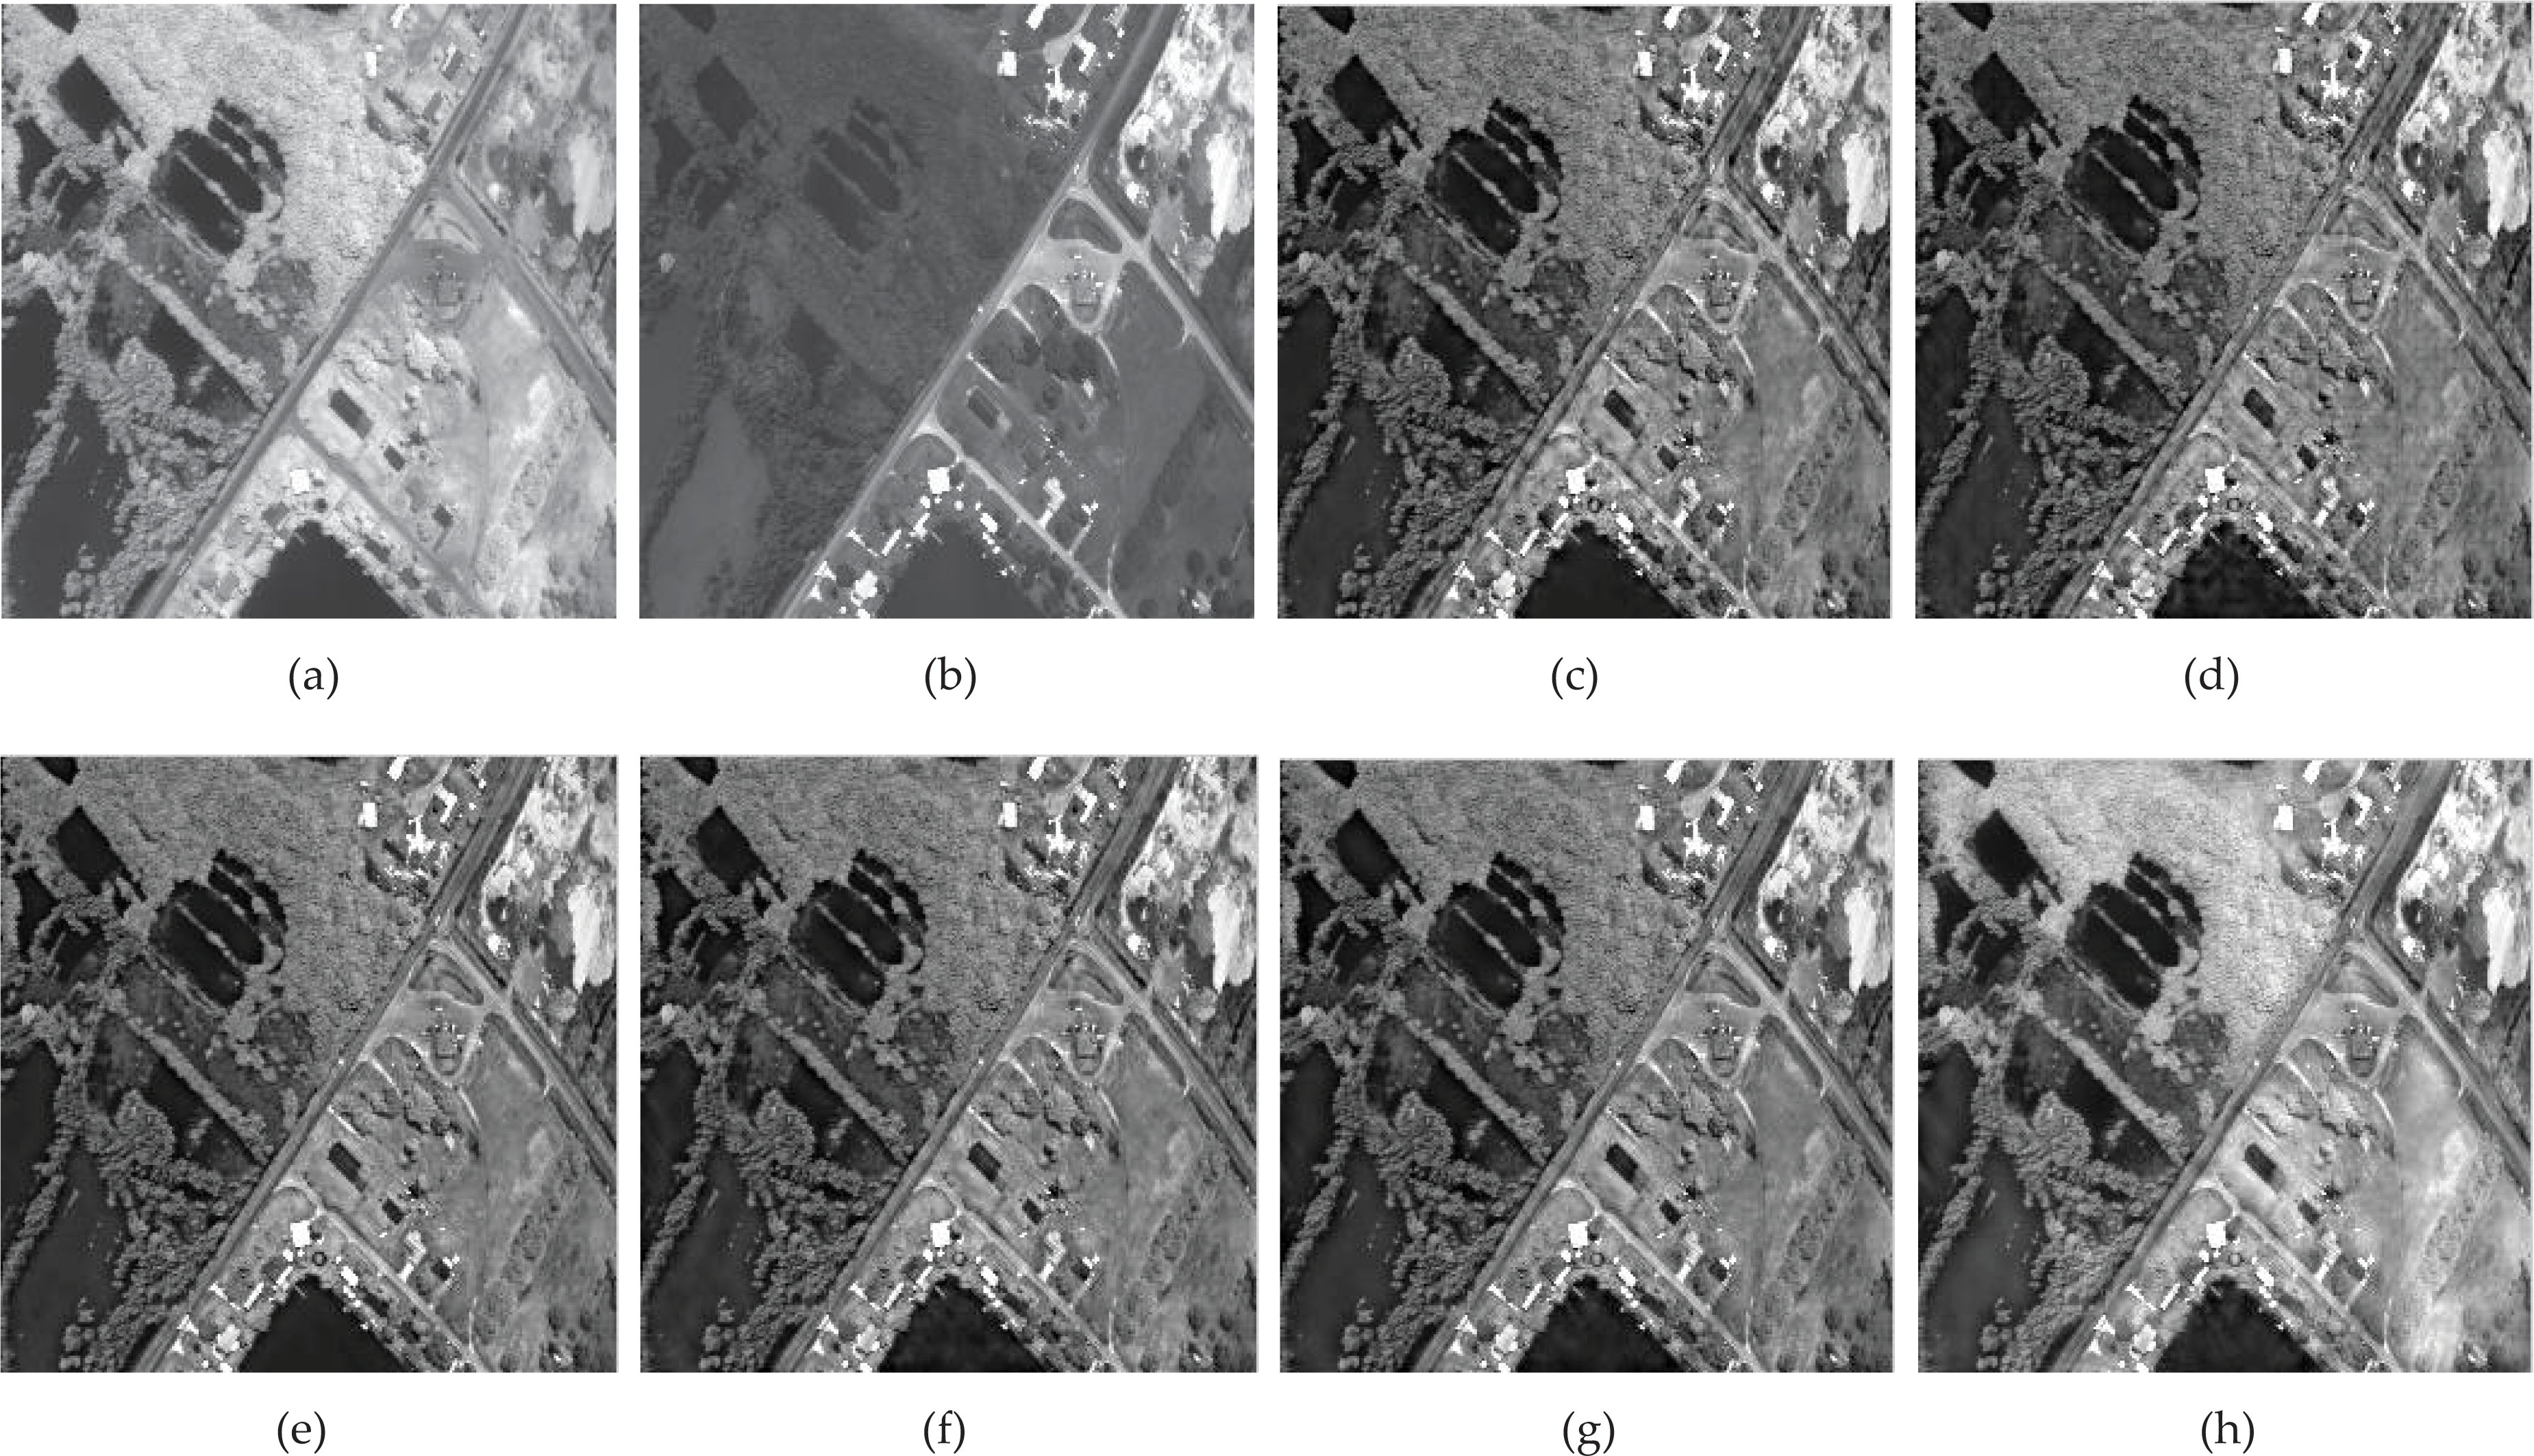
Remote sensing source images (256 level, size 256×256) and fused images: (a, b) input images; and fused images using (c) DWT, (d) CNT, (e) NSCT, (f) SCDPT, (g) UDCT-simple and (h) UDCT-FSIM methods.
5. Conclusion
A novel image fusion algorithm based on UDCT is proposed. We applied UDCT, a novel tool for multiscale and multi-directional decomposition, to the field of multi-source image fusion for the first time and observed a considerable improvement in performance. Using the UDCT characteristics, coefficients are selected according to FSIM and a CCFSIM index for the low-pass and high-pass subbands. Depending on the FSIM and CCFSIM scores, complementary and redundant information between source images can be distinguished. According to the complementarity or redundancy, a weighting or selection rule is applied to merge the coefficients. The local energy is used as a saliency measure for the low-pass subbands. FM is used as a saliency measure for the high-pass subbands. Experiments confirmed that our algorithm yields encouraging performance in terms of both visual analysis and objective quality metrics.
Figure 8 shows the metric results for the different fusion methods for the images in Figures 3 and 5–7.

Quality metrics for the different fusion methods
6. Acknowledgments
This work was supported by the National Basic Research Program of China (973 Program) 2012CB821200 (2012CB821206), the National Natural Science Foundation of China (No. 91024001, No.61070142) and the Beijing Natural Science Foundation (No. 4111002).