
Abstract
ZnFe2O4 nanocomposites have been prepared by a simple co-precipitation method. The prepared samples were characterized by Scanning Electron Microscopy (SEM), Powder X-ray Diffraction (XRD), Energy Disperse X-ray Analysis (EDX), Transmission electron microscopy (TEM) and UV-visible absorption spectral techniques. Conductivity measurements show a transition from ferrimagnetism to paramagnetism. The enhancement in fluorescence spectra shows that there is an electronic transition to an exciting level. In UV-Vis spectra, the peak observed at 647nm indicates ZnFe2O4 nanocomposites are a photoactive compound. The above results suggest that these nanomaterials can be used in optoelectronic applications.
1. Introduction
The development of optical nanoparticles has resulted in major advantages in biological applications, such as imaging and sensing, since the 1990s [1–2]. These applications require monodisperse and photostable properties in nanoparticles, which are amenable to further surface modification for the conjugation of fluorophores [3]. So far various approaches have been developed to synthesize magnetic fluorescent bifunctional nanocomposites [4]. For example, the use of magnetic Zn2+, Co2+ and Mn2+ ions to partially substitute Cd2+ or Zn2+ ions in CdSe or ZnSe nanocrystals. Other research involved the preparation of Fe3O4/CdSe and Fe2O3/CdSe nanocomposites with magnetic properties [5–6]. The stability of ferrite nanocomposites is applicable in microwave devices because Zn and Ni ferrite have high resistivity, a high Curie temperature, chemical stability and good magnetic properties at high frequencies [7].
Recent research in this field has mainly focused on increasing the quantum yields of synthetic quantum dots (QDs), which can be diversely applied in biotechnology, sensors, superconductors etc. The substituted magnetic QD composites are expected to have more opportunities for technological application, especially in medical fields [8–10]. Kim et al. [11] reported the preparation of bifunctional magnetic-optical nanocrystals by growing a luminescent CdSe shell over metallic cobalt nanoparticles. Current investigations reveal that the ZnFe2O4 nanocomposites were active, due to their great sensitivity towards the photoelectronic properties.
2. Experiments
The ZnSO4. 7H2O, FeSO4. 7H2O, FeCl3 and sodium hydroxide (NaOH) used were analytical grade and were used without further purification.
Synthesis of ZnFe2O4 nanocomposites was prepared by employing a co-precipitation method [12] by taking high-purity ZnSO4. 7H2O, FeSO4 7H2O and FeCl3 as starting materials. The proper stoichiometry of the starting materials was weighed separately, followed by the addition of a suitable quantity of de-ionized water to make 0.5M solution, which was stirred for 1 hour to obtain a homogeneous solution. A 1M NaOH solution was added drop wise into the above solution at 333K with constant stirring until the precipitation was obtained. Further heating of the precipitate in its alkaline condition was continued at a soaking temperature of 373K for 6 hours in order to get the ZnFe2O4 nanocomposites. Finally, the obtained precipitate was washed with double distilled water repeatedly and dried at 333K for 12 hours. The obtained ferrites are deagglomerated by grinding using an agate mortar and pestle in acetone to obtain very fine particles. These particles were calcinated in a silica crucible at 673K for further crystallization [13].
3. Methods
The synthesized ZnFe2O4 nanocomposites were subjected to X-ray diffraction studies [using a Phillips X'pert diffractometer and a Cu Kα radiation source λ = 0.154nm] to determine the crystal phase composition. Elemental analysis was carried out by an energy dispersed X-ray analysis (EDAX) spectrum and surface morphology was studied by scanning electron microscopy (SEM: Hitachi S-4800). Transmission electron microscope (TEM) experiments were carried out on a JEOL JEM2010 transmission electron microscope operated at 200kV. The optical properties of this sample were investigated by using a UV-Visible absorption spectrophotometer (Shimadzu PC 1650 model) and fluorescence spectra taken from a spectrofluorophotometer (Shimadzu RF 5301 model).
The electrical conductivity measurements were conducted using a KEITHLEY source meter (Model – 4240). The powder nanocomposite samples were pressed uniaxially into a 2mm thick pellet with a diameter of 10mm by applying 120Mpa of pressure for 3 minutes. The pellets were sintered for thermal stability at 300K for 3 hours and silver paste was applied on both sides of the pellets for better contact with the electrode. The DC electrical conductivity measurements were carried out at a temperature between the range of 300–650K and electrical conductivity σ was calculated by the formula mentioned below (1).

Where Ea is the activation energy, KB is Boltzmann constant and T is the temperature. The activation energy was calculated from an Arrhenius plot.
4. Results and discussion
Figure 1 illustrates XRD patterns of synthesized ZnFe2O4 nanocomposite powder after calcinations. From the curve all the observed diffraction peaks can be indexed to a cubic spinel phase with fcc structure magnetite according to JCPDS card No 82–1042. Six characteristic peaks marked by their Miller indices (220), (311), (400), (422), (511) and (440) with 100% intensity at 2θ = 34.87° correspond to the reflection plane (311). The average particle size was determined by Debye-Scherrer's formula, that is 20 nm ± 5 nm.

X-ray Diffraction pattern of ZnFe2O4 nanocomposites.
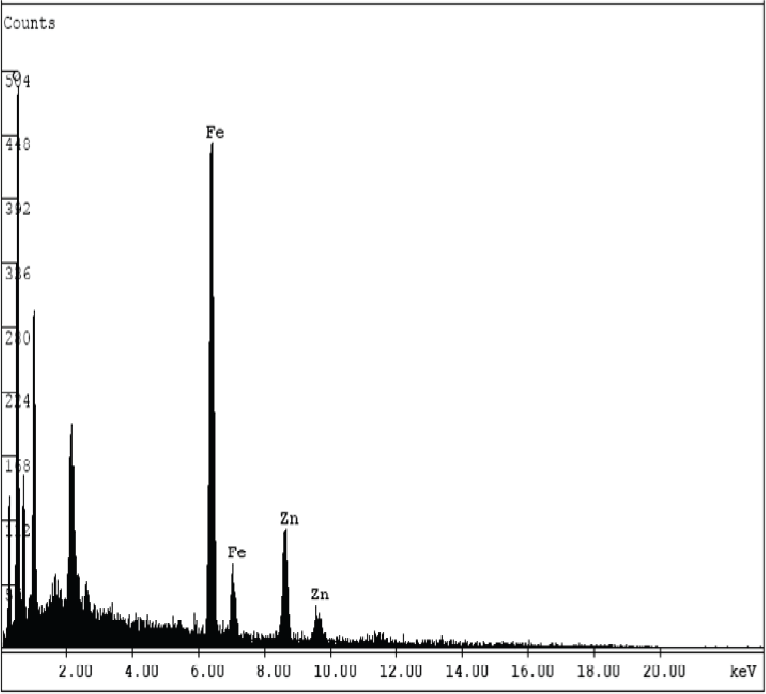
Energy Disperse X-ray Analysis spectrum of ZnFe2O4 nanocomposite.
SEM images of ZnFe2O4 nanocomposites are shown in Figure 3 (a) & (b). It can be observed that there is a non-uniform distribution of zinc ions in ferric oxide nanocomposites (before/after calcinations) with irregular shaped particles. It is evident that before calcination the samples have some agglomerates and are irregular in shape. After calcination a spherical in shape with uniform morphology can be seen and that there is a narrow size distribution of the particles.

Scanning Electron Microscopy image of ZnFe2O4 nanocomposites (a) before calcination (b) after calcination.
Figure 4(a) presents a TEM observation of the ZnFe2O4 nanocomposites. The crystallite sizes were obtained from the analysis of TEM images and were in good agreement with the sizes determined by Debye–Scherrer approximation. Figure 4(b) shows a high resolution TEM image that indicates that the zinc ferrite's nanocomposites are highly porous in nature and the zinc particles are coagulated with ferrite particles. The average crystalline size was found to be 2nm.

(a) Transmission electron microscopy micrograph and (b) High resolution transmission electron microscopy image of the same ZnFe2O4 nanocomposites.
5. Optical Properties
Metal nanoparticles have attracted much attention because of their distinctive electronic and optical properties arising from reduced dimensionality and a high surface-to-volume ratio. In accordance with this fact, absorption spectroscopy was used to monitor the polydispersity of nanoparticle sizes in a colloidal solution.
The fluorescence spectra also provide fascinating information about the nanoparticles. The fluorescence onset shifts with respect to the quantum confinement [14]. These results suggest that fluorescence spectroscopy is a useful tool for monitoring the nature of the nanoparticles' surface and how it changes with particle size.
It is exciting to note that there is a remarkable change in colour of ZnFe2O4 nanocomposites when dispersed in double distilled water and exposed to UV light. The experimental results exhibit a reddish brown colour at 450nm and an orange-red colour at 650nm, as shown in Figures 5(a) and 5(b).
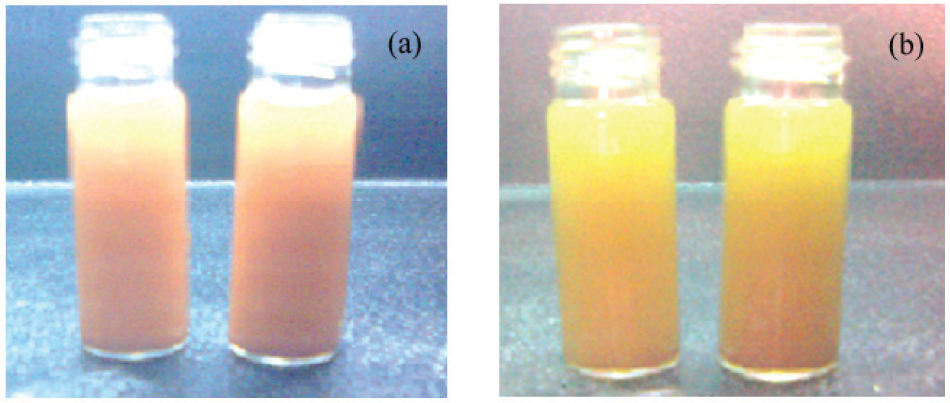
Change in colour when nanocomposites are dispersed in distilled water (a) 650nm (b) 450nm.
5.1 Absorption spectroscopy
The absorption spectra of ZnFe2O4 nanocomposites were recorded by dispersing the particles uniformly in the double distilled water in presence of HCl media (0.3N) at different concentrations (0.001, 0.002, 0.003, 0.004g/10ml) at a wavelength range of 250 to 800nm. ZnFe2O4 has been known to have strong absorption in the UV-Vis range [15, 16, 17]. As shown in Figure 6, the ZnFe2O4 nanocomposites have strong band edge absorption in the wavelength region of 250 to 800nm. The sharp absorption band formed at 334nm shows the overlap of optical property with the Beer-Lambert law. Figure 6 shows the variation of absorption with intensity at different concentrations and that the observed hyperchromic shift tends to be a small shift in electronic excitation. From the above results, it can be suggested that the prepared ZnFe2O4 nanocomposites are optically active.

UV-Visible absorption spectra of ZnFe2O4 nanocomposites at different concentrations (a) 0.001g/10ml (b) 0.002 g/10ml (c) 0.003 g/10ml (d) 0.004 g/10ml (e) 0.005 g/10ml.
5.2 Fluorescence properties
Figure 7 shows the room temperature fluorescence spectra (FL) of ZnFe2O4 nanocomposites with different concentrations, recorded in the 330 to 700nm wavelength range. Intense fluorescence emissions were observed under excitation at 367nm. In the entire FL spectrum, broad visible emission bands were observed. The first is the blue band at 367nm and the second is the orange-red band at 645nm. The blue emission at 376nm is attributed to the defect-related emission, particularly interstitial zinc defects [18].

Room temperature fluorescence spectra of ZnFe2O4 nanocomposites with different concentrations.
For the ZnFe2O4 nanocomposite samples, a second emission band in the yellow-orange region centred at about 647nm is observed, which is significantly contributed to by the Fe-Zn phase [19]. It can be observed that the sample gives out orange-yellow light, which corresponds to the FL spectrum result [16].
The highest intense peak corresponds to the maximum transition probability. If the wavelength of the radiation is λ and ΔE is the gap between the energy states, the transition probability is significant only when hv= ΔE or hc/ΔE, in accordance with the Fermi golden rule [20]. Here the observed fluorescence emission spectra was widely varied depending upon the individual vibrational energy levels of the ground and excited states of ZnFe2O4 nanocomposites [21]. The fluorescent efficiency of ZnFe2O4 nanocomposites is estimated for different concentrations, as shown in Figure 7. As the concentration of ZnFe2O4 nanocomposites was increased from 30μM to 700μM, the corresponding intensities at 647nm were also amplified. An enhanced concentration of ZnFe2O4 nanocomposites led to a boost in the number of fluorescence centres, which contributed to the improvement in intensity as well as the electronic exchange within the ZnFe2O4 nanocomposites. Even with an increase in irradiation time, the intensity of the emission band positioned at about 647nm was enhanced and the trend was consistent with the changes in the corresponding surface plasmon band of these nanocomposites.
6. DC Electrical characterization
The obtained DC results reveal a variation in the electrical conductivity of the prepared samples with temperature (Figure 8). It was found that conductivity increases with an increase in temperature, showing a semiconducting behaviour. The two steps of conductivity are observed here: the first step in conductivity is almost constant with an increase in temperature of up to 490K, and in the second step, conductivity increases gradually beyond 490K. The graph of lnσ verses 1000/T (Figure 9) can be fitted into an Arrhenius plot, which has two straight lines with different slopes. This Arrhenius plot has a break at critical temperature Tc = 490 K, which is attributed to different conduction mechanisms.

Variation of DC electrical conductivity with temperature.

Arrhenius plot of ZnFe2O4 nanocomposites.
The electrical conductivity in ferrites can be explained on the basis of exchange of electrons between ions of the same element that are present in more than one valence state distributed randomly over equivalent crystallographic lattice sites (Fe3+ Fe2+) [22]. It is well known that the change in slope is attributed to the Curie temperature or to a change in the conduction mechanism [23–25]. At the Curie temperature, the samples transform from an ordered ferrimagnetic state to a disordered paramagnetic state with a marked increase in conductivity.
There are several results that reveal ferrimagnetic behaviour at room temperature [26]. Hence, the observed break at 490K may be due to a phase transition from ferrimagnetic to paramagnetic nature. The activation energies were different in these two regions and can be calculated from an Arrhenius plot near Tc. The calculated activation energy value in the ferrimagnetic and paramagnetic regions were found to be 0.49eV and 0.55eV, respectively. In the ferrimagnetic region, the conductivity is due to electron hopping between Fe2+ and Fe3+ ions in B sites, which results in a lower value of activation energy. In the paramagnetic region a higher value of activation energy was found, which suggests that the conduction mechanism in this temperature range is different from that of low temperature region. The prepared sample was calcined at 400K, during that time the oxygen ions escape from the spinel structure and thereby create anion vacancies. Therefore, the conduction due to anion vacancies may be responsible for the increase in conductivity due to the higher activation energy in the high temperature region.
7. Conclusion
The ZnFe2O4 nanocomposites were prepared by employing a co-precipitation method. The XRD confirms that the highest intensity peaks were at 2θ=34.87°, which corresponds to the reflection plane (311) and the average particle size was found to be 20±5nm. SEM results reveal that before calcinations samples have some agglomerates and are irregular in shape but after calcination samples show uniform and almost spherical structural morphology with a narrow size distribution of particles. The changes observed in fluorescence emission spectra at the range of 550nm-70 nm of ZnFe2O4 nanocomposites were due to the oscillation of electrons from a ground state to an excited state. Finally, the electrical conductivity of the nanocomposites increases with increase in temperature, which is the observed behaviour of semiconductor materials. It is also observed that, the ZnFe2O4 nanocomposites undergo a transition from a ferrimagnetic state to a paramagnetic state.
Footnotes
8. Acknowledgements
The author would like to thank UGC for providing the Rajiv Gandhi National Fellowship (JRF). The author acknowledges IISc, Bangalore for providing spectral data.