
Abstract
In this paper, we present technical approaches that bridge the gap in the research related to the use of brain-computer interfaces for entertainment and facial expressions. Such facial expressions that reflect an individual's personal traits can be used to better realize artificial facial expressions in a gaming environment based on a brain-computer interface. First, an emotion extraction filter is introduced in order to classify emotions on the basis of the users' brain signals in real time. Next, a personality trait filter is defined to classify extrovert and introvert types, which manifest as five traits: very extrovert, extrovert, medium, introvert and very introvert. In addition, facial expressions derived from expression rates are obtained by an extrovert-introvert fuzzy model through its defuzzification process. Finally, we confirm this validation via an analysis of the variance of the personality trait filter, a k-fold cross validation of the emotion extraction filter, an accuracy analysis, a user study of facial synthesis and a test case game.
1. Introduction
Brain-computer interfaces (BCI) use electrophysiological brain signals as meaningful data with which to manipulate remote devices or applications, in contrast to conventional interfaces such as keyboards, mice and touchpads. Electrical activity, captured by a number of electrodes on the scalp, is used to carry out feature extraction and pattern classification. Related applications have been used as an alternative means of communication for motor-impaired people [1-5]. Interestingly, some studies on BCI have been recently extended into areas of entertainment such as interactive human-computer games for healthy users. BCI applications have appeared in entertainment and the game industry as a means to adapt and control applications using brain signals [6-9].
Techniques for automating the analysis of facial expressions [10-12] are critical to the realization of more natural and effective human-computer interactions, which can add to existing studies of human emotion and affective computing and enhance applications in a broad range of areas. In a given case, however, a false expression can be interpreted as a true expression because the user may be hiding their genuine emotion. This happens because recognition tasks rely mostly on image- or video-based approaches. A facial expression may seem unnatural because the representation could more likely depend on the user's intention [13–14] than on genuine physiological signals obtained using an electroencephalogram (EEG), electromyogram (EMG), electrocardiogram (ECG) or Galvanic skin response (GSR).
Facial expressions have attracted considerable interest because they are one of the principal modes of nonverbal communication and of conveying emotional states [15-17]. Most previous studies on the recognition of facial expressions using BCI have been adopted in the entertainment industry; these methods, however, do not seem to display the synthesis of facial expressions with great refinement [18-20]. In the entertainment industry, which includes computer games and animation, the characters' facial expressions are largely dependent on their personality types, for example, whether they are introverted or extroverted. Such personality traits have to be taken into consideration in order to better realize the subtle distinctions between facial expressions. Indeed, even the same emotion or expression is not identical for different characters, but is slightly different due to their varying personalities [21].
As seen in Table 1, many studies have been conducted relating to BCI, personal traits and facial expression. Moreover, some of them dealt with a combination of BCI and personal traits or facial expression recognition. However, attempts to merge all of them are rare even though they are highly correlated with each other and such an attempt could improve human-computer interactions.
Studies of personality traits and facial expression

In this paper, an emotion extraction filter (EEF) is then introduced, which can recognize emotions from EEG brain signals as well. Next, a personality-trait filter (PTF) is designed to classify extrovert and introvert types from EEG brain signals using an EEG fuzzy model. In addition, an extrovert-introvert (EI) fuzzy model is constructed on the basis of the intensity of the facial expressions of the different EI types. A novel method of creating facial animation from motion capture data is presented as well, which automatically extracts the contraction values of the facial muscles. This enables us to realize real-time facial animation for a game player who is connected to an EEG device. To validate the proposed schemes, we have conducted an analysis of the variance (ANOVA) of the PTF, a k-fold cross validation of the EEF and an accuracy and user study of facial synthesis. We have also created a test case game. The preliminary works were presented in [22]. The rest of this paper is organized as follows: the next section presents a review of the related literature. Next, we discuss the design of the EEF, which uses formulas to determine various emotions from the EEG data. Thereafter, we look at the design of the PTF, which takes EEG data as an input and produces personality traits such as very extrovert (VE), extrovert (E), medium (M), introvert (I), and very introvert (VI). Finally, validation experiments are presented and our conclusions are summarized.
2. Emotion Extraction Filter
The purpose of the Emotion Extraction Filter (EEF) is to automatically recognize a facial expression from EEG brain signals.
2.1 EEG Data Acquisition
To obtain EEG data for each emotional state, six healthy subjects with a mean age of 21.33±3.32 participated in our experiments. The subjects were instructed to sit on chairs that were 1m from the screen in an electrically and acoustically shielded room to avoid external interference such as noise or interruptions; the temperature was maintained at 18–22 °C. At the beginning of the experiments, the subjects were asked to assume a neutral expression without any particular intention, in order to rule out any biased emotions and brain signals, which were sampled for 20 seconds. Following this, the subjects were asked to express facial expressions as they liked for three to five seconds. This was done because recognition of voluntarily expressed emotion has been broadly used in recent brain research [24-26]. Before samples of their brain signals were taken, they were instructed to practice making expressions by referencing photographs of facial expression from Ekman's study [27]. The experiments were performed 5 times for each of the participant's expressions and we collected 210 samples of EEG data for the six emotions and the neutral expression. The EEG signals were recorded with a Neuromedi LXE-3204 with a sampling frequency of 512 Hz that was band-pass filtered between 0.5 and 50 Hz. An additional 60 Hz notch filter was applied to avoid power line contamination. Ag/AgCl electrodes were placed on the F4 and T4 positions [28] according to the International 10–20 system, as shown in Figure 1, and the bilateral mastoids were used as positions of the reference and ground electrodes. In addition, images of the subjects' expressions were recorded on video files while the brain signals were being sampled. The videos were used to delete noises from eye blinking and body movement by carefully and simultaneously observing both the subjects' appearance on the recording stage and their brain signals.
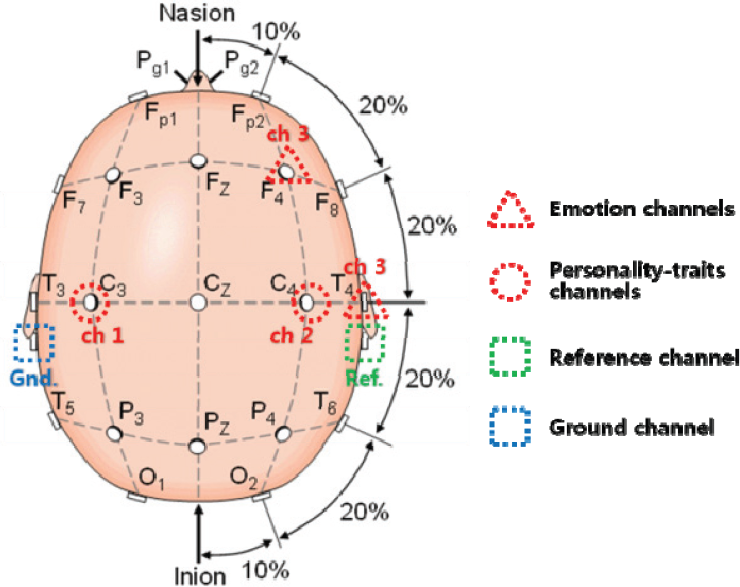
The position of electrodes used for EEF (F4 and T4) and for PTF (C3 and C4) in the 10–20 system
2.2 Feature Extraction
Having sampled the brain signals, representative features had to be carefully chosen in order to classify the emotions. The aim of feature extraction is to provide distinctive metrics for emotion classification. Theoretically speaking, it can be said that a person's emotional state represents internal responses to external stimuli that can be distinguished in terms of their magnitude. For instance, varying levels of intensity (magnitude) of facial expression have been observed even in the same person as the result of different levels of stimuli. For example, what happens when someone one knows has died? Clearly the magnitude of one's sadness depends on one's degree of familiarity or relationship with the dead person. The more familiar one is, the more grief is felt. Hence, the intuitive idea behind the approach of this research is that the derivatives of brain signals are most likely to reflect distinctions among expressions.
Prior to calculating the first derivatives of brain signals, a sampled EEG signal denoted by Xk needs to be normalized, where index k represents the kth sample. The normalized EEG signal denoted by Ek can be acquired by (1), where its value ranges from 0 to 1.

where Xk is the kth sampled EEG signal.
Before computing derivatives, we break Ek into sequential windows denoted by Δ s , where s is the sth window within Ek. The first derivatives of the normalized EEG data Ek at window s marked by Δ s for each channel is computed using (2), which indicates the mean value of the first derivatives at time t within window s. In our experiments, the interval of t was found to be around 2 seconds (1,024 samples), denoted by T.

where s represents the sth window in Ek, and t is the time index within window s and t ∊ T. Finally, the vector consisting of Δs for channel F4 and T4 is used for the features.
2.3. Classification of Emotions
To classify facial emotions as represented by the features of brain signals, we employed the six classification algorithms using a machine learning tool, WEKA [29]. Our hypothesis is that a few channels have to be chosen in order to implement BCI for games where a game player needs a brain interface that is more compact than versatile. So, F4 and T4 channels were selected for classification because of their capacity to make distinctions between the features of expressions relative to other combinations of channels. Finally, we decided upon four expressions to be classified: neutrality, happiness, surprise and anger.
The features of two channels (F4 and T4), represented by derivatives of the brain signals of emotions, are taken to perform the classification. First, a neutral expression is perceived and if it is not present the expressions of happiness, surprise and anger are determined in sequence. Table 1 also shows classification results produced by other classification algorithms using a machine learning tool, WEKA. All the results were tested with 10-fold cross validation to evaluate training results.
3. Personality Trait Filter
The Personality Trait Filter (PTF) seeks to determine a personality trait from brain signal inputs, using an EEG fuzzy model, and to then map it to the corresponding expression as rated by the magnitude of the facial expression. In short, the personality traits defined as EI types—VE, E, M, I, and VI—must be automatically extracted from brain signal inputs in order to better realize the subtle distinctions.
3.1 Data Acquisition for EEG Fuzzy Model
The participants were seated in a comfortable chair around 2 m away from the screen and instructed to gaze at the blank screen for 2 minutes, maintaining a relaxed state and keeping their body still while the electrophysiological data acquisitions were performed two times. In addition, the Myers-Briggs Type Indicator (MBTI) was used to classify participants into Extrovert and Introvert types [30]. Analysis of the EEG data was done by using Telescan v2.9 (Laxtha Inc., Korea). To select valid data, EEG samples during the first and last 30 seconds were eliminated. After that, the power spectral density (PSD) [31] of alpha (8–12 Hz) and beta (26–30 Hz) frequency bands was extracted in order to build the EEG fuzzy model.
3.2 EEG Fuzzy Model
The EEG fuzzy model is designed on the basis of input brain signals. It takes PSDs of EEG data as inputs and returns a fuzzy membership value derived from the nine fuzzy rules. Three fuzzy sets—low, medium and high—are taken into account in order to build the EEG fuzzy model by calculating the two PSDs of alpha and beta frequency bands. The orders of alpha and beta are dependent on their magnitudes.
Two EEG fuzzy models for both alpha and beta are required so they can be combined according to fuzzy rules. In Figure 2, the fuzzy models of alpha and beta are shown. We define fuzzy rules in order to combine two PSDs (alpha and beta) into one fuzzy model called the EI fuzzy model, which will be defined in the next section, taking into consideration VE, E, B, I, and VI. In this study, we employ the findings of Gram et al. [23] which present the alpha fuzzy value as being relatively greater than the beta fuzzy value in E and the beta fuzzy value is greater than the alpha fuzzy value in I.

EEG fuzzy model for alpha and beta
Finally, nine rules are required for the design of the EI fuzzy model described using the “If-Then” clause as shown in Table 2.
Classification Results of EEF

3.3 Data Acquisition for the EI Fuzzy Model
To build an EI fuzzy model, weights for each EI type were derived from the pictures of the subjects' facial expressions. Subjects were instructed to visualize six universal expressions. After that, we took photographs of seven facial expressions (surprise, anger, fear, disgust. sadness, happiness and neutral) of 30 subjects using a digital camera (D80, Nikon, Japan, 10.2 megapixel resolutions). The locations of the feature points were decided based on the movements of 21 facial muscles that occurred while people were making facial expressions. We also acquired an individual's motion data for six facial expressions from each participant using an optical motion capture system (Motion Analysis Co., 120 frames/sec). The weight is also used in order to retarget a participant's motion capture data to the motion capture data of each subject. Wewould expect to observe greater movements of facial components in each expression in the E rather than I types.
3.4 EI Fuzzy Model
The EI fuzzy model takes the fuzzy membership value obtained from the EEG fuzzy model as an input to calculate a fuzzy expression rate that represents the magnitude of facial expressions through its defuzzification process. The EI type also needs to be used when cloning facial motion capture data to subjects. The method of designing the EI fuzzy model was as follows.
The 30 participants were asked to respond to an MBTI GS test in order for us to determine their character types. We determined that there were 20 extroverted subjects and 10 introverted subjects. Six facial expressions with facial feature points were acquired by taking photographs.
A Euclidean distance was calculated, denoted by T, between the feature points of the neutral expression and the six expressions.
The weight w, which indicates the relative weights obtained from the pictures of the 30 participants' expressions, was computed using w = T/Im, where T is the distance between an expression and each neutral expression, and Im is the distance between the minimum expression and each neutral expression. Cloning of the facial motion capture data for the subjects without consideration of their EI type was performed in a previous study by the authors [32]. Here, however, the EI type has to be considered in order to retarget each individual expression, which enables us to calculate the EI fuzzy model by simply applying w. Facial cloning was performed to transform the motion capture data (calibrated for the canonical face) into the cloned data from the 30 participants using the multiplication of w by the derivative of the facial motion data.
According to the magnitude of the cloned motion data obtained from step 3, above, we arranged the facial motion data for the six expressions on the horizontal axis in the EI fuzzy model in order to derive the expression rate.
The left plot in the first row in Figure 3 displays all 35 markers, the facial motion data obtained from aforementioned step 3, for VE, balanced and VI. The right plot in the first row magnifies the positions of the number 6 marker in 3D in order to better distinguish each marker. Similarly, the left plot in the second row indicates the number 35 marker positions. As can be observed in the table in the second row of Figure 3, the marker positions of the Y coordinates show relatively greater movement in VE than in VI. The range of the expression rates for surprise derived from facial motion capture data and that depend upon the EI type (VE, E, M, I, and VI) are shown in Figure 4. In a similar manner, we produced EI fuzzy models for other expressions as well.
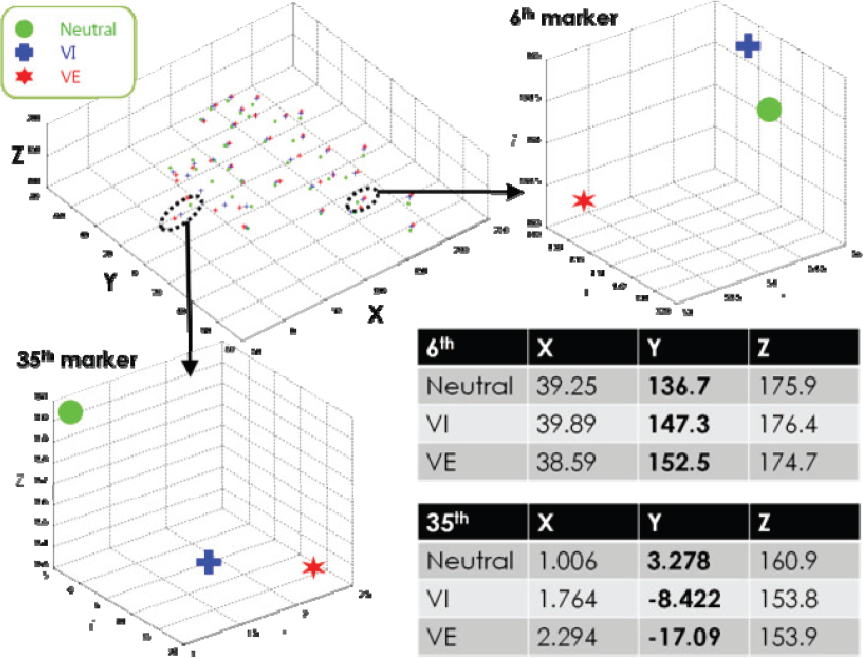
Facial motion capture data (top left) after showing relative locations between different personality traits. The number 6 marker (top right) and the number 35 marker (bottom-left) for VE, Neutral, and VI, and their positions.
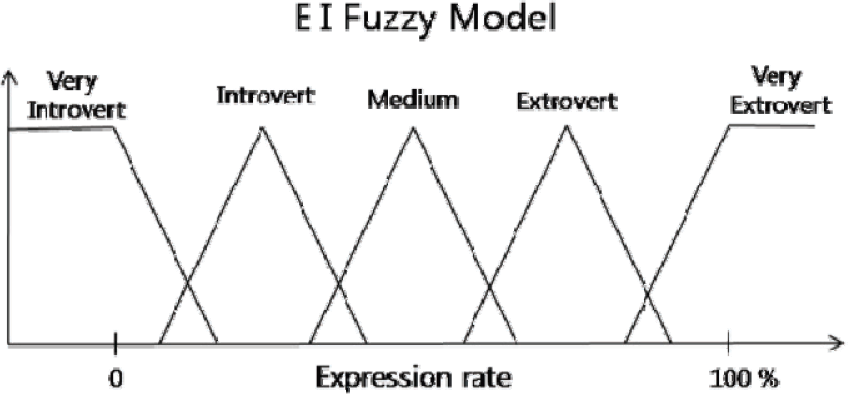
EI fuzzy model for an expression of surprise.
Finally, by employing centroid defuzzification using the EI fuzzy model proposed by Mamdami [33], the appropriate expression rate for a selected EI type can be determined. Later, based on an expression rate derived from the EI fuzzy model, we produced facial expressions that reflect each EI type.
3.5 Derivation of Expression Rate
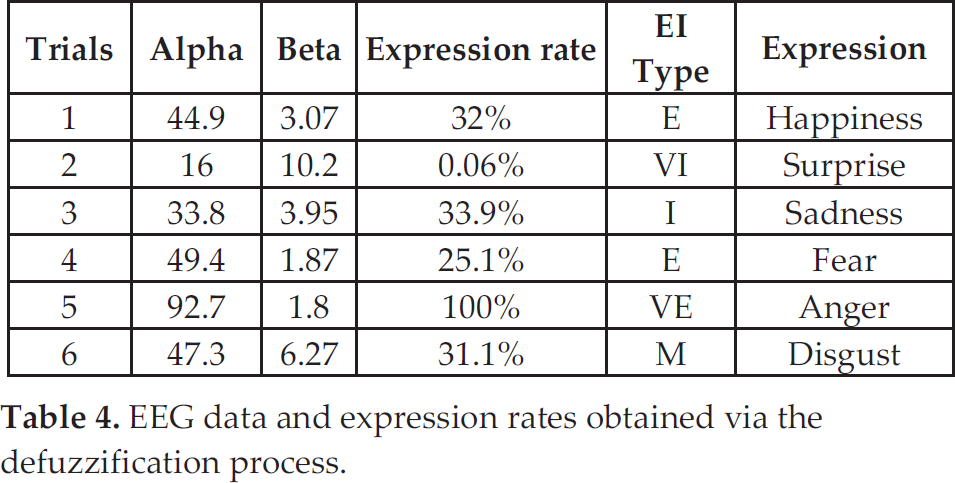
As previously described, we designed the EEG fuzzy model using EEG data, including alpha and beta as input parameters. By employing centroid defuzzification, as previously mentioned, we can derive an expression rate in which the fuzzy membership of the EEG fuzzy model is taken as an input to the EI fuzzy model. Accordingly, the results of the defuzzification appear in the expression rates: 32% for happiness, with alpha (44.9) and beta (3.07) for the extroverted traits, as shown in the first row in Table 3. The expression rates were similarly calculated for the other six expressions as well.
Fuzzy rules for EI fuzzy model

4. Facial Animation for BCI
For facial animation, we used a synthesis of facial expressions based on 21 muscles [27][34]. The derivative of a muscle movement as calculated from facial motion capture data was obtained from a sequence of facial movements, which yields a change of rates between frames. This derivative of a vertex in a 3D model can also be computed in facial expressions in a 3D face that corresponds to a set of facial motion capture data. Thus, we used that derivative to produce a corresponding facial expression by computing rate of change between frames.
1) Schematic approach
Each muscle is marked by two end points called a starting point and an ending point. Based on the fact that the starting point is fixed and the ending point is movable when expressions are formed, as shown in Figure 5, we are able to derive muscle contractions from facial motion capture data.

Movements of one of the frontalis muscles.
We defined a piece of facial motion capture data at a given time t denoted by M(ti) as in (3):

where in tensor notation,
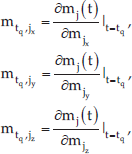
and 1 ≤ i ≤ n, and 1 ≤ j ≤ k, with maker index j.
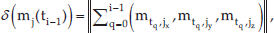
We can intuitively understand that δ in (4) implies the distance between a neutral expression and each piece of facial motion capture data. We acquired the maximum distance between a neutral ending point and the furthest ending points and used it for the normalization of δn, with each δ divided by the maximum value that indicates the relative movement of the ending point. Some examples of muscle movements such as the eyes, eyebrows, mouth and linear muscles are shown in Figure 6.

Movement of the ending point of the frontalis muscle, eye muscle, and mouth muscle.
2) Derivation of contraction
To generate a synthesis of the facial expressions for each frame, a value of contraction is derived from δn (0 to 1) multiplied by the maximum contraction value of a given muscle.
For each frame where δn is known, it was quite easy to calculate the muscle contraction C automatically. Thus, the above mentioned approach makes it possible to automatically extract 21 muscle contractions, which offers multiple possibilities with which to easily create facial animations. Once we have an expression rate derived from the EI fuzzy model, we can obtain a corresponding animation represented by the contraction of 21 muscles.
5. Experiments and Discussions
5.1 Synthesis of Facial Expression
Using centroid defuzzification, we apply the EI fuzzy model to derive the appropriate expressions for VE, E, M, I and VI. The fuzzy membership of the EEG fuzzy model is taken as the input to the EI fuzzy model to obtain the expression rate. Microsoft MFC and OpenGL were used to carry out the proposed method. Figure 7 indicates that the observed results showed there to be more emphatic expressions in VE than in VI. For instance, the expression of sadness in VE seems more depressed than in B and VI. However, unlike the other expressions, in the expression of fear there is the greatest movement of features in the case of VI. Table 4 shows the EEG data for each expression corresponding to EI types. For instance, the expression of happiness consists of VI (0.0284%), B (29%), and VE (100%) in sequence with each piece of EEG data: alpha (20.28) and beta (9.3) of VI, alpha (45) and beta (5.8) of B, and alpha (86.1) and beta (1.8) of VE.
EEG data and expression rates obtained via the defuzzification process.
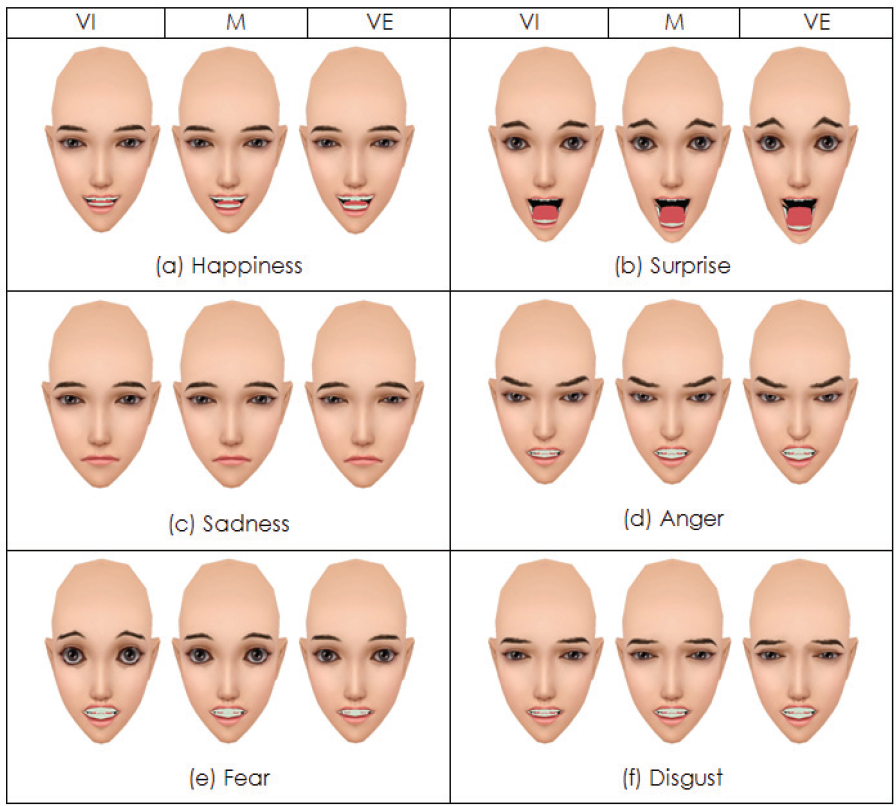
Six expressions with VI, M and VE.
5.2 Verification of PTF
ANOVA analysis for personality traits using channels C3 and C4 indicates that the p-values of PSDs of alpha (F:8.859, p=0.030 for C3, F:7.226, p=0.007 for C4) and beta (F:25.789, p=0.000 for C3, and F:8.109, p=0.005 for C4) prove acceptable with the condition p<0.05, which implies that the personality traits (VI, I, M, E, VE) can be distinguished from one another.
EEG data corresponding to EI types

In addition, the magnitude of facial expressions were found to be markedly distinct for facial expressions that only included happiness (F:7.283, p=0.007), surprise (F:3.617, p=0.050) and anger (F:3.694, p=0.048), while the p-values of other expressions appear as sadness (F:3.421, p=0.058)), fear (F:1.489, p=0.284) and disgust (F:2.855, p=0.088).
5.3 Verification of Facial Animation
To verify that the facial motion data matched the facial animations generated by the 3D face model, we computed a disparity between the two datasets. The comparisons are shown by the norm of the distance between a neutral face and each frame after coordinate scaling transformations.
To compute the disparity of the corresponding samples, we scaled the expression coordinates in proportion to the facial motion data and then computed their distances. By plotting these distances, we found that the two motion curves for the expression of happiness seemed to be equivalent, as shown in Figure 8. The red line indicates the movements of the vertices in the facial animation and the blue line shows those of the facial motion capture data. The maximum distances between the neutral face and each frame are circled; these being 34.4 and 31.8. The plots show that the magnitude of values appeared in the order of VE, E, M, I and VI, meaning that the expression of happiness is more conspicuous in the model for extroverted traits.
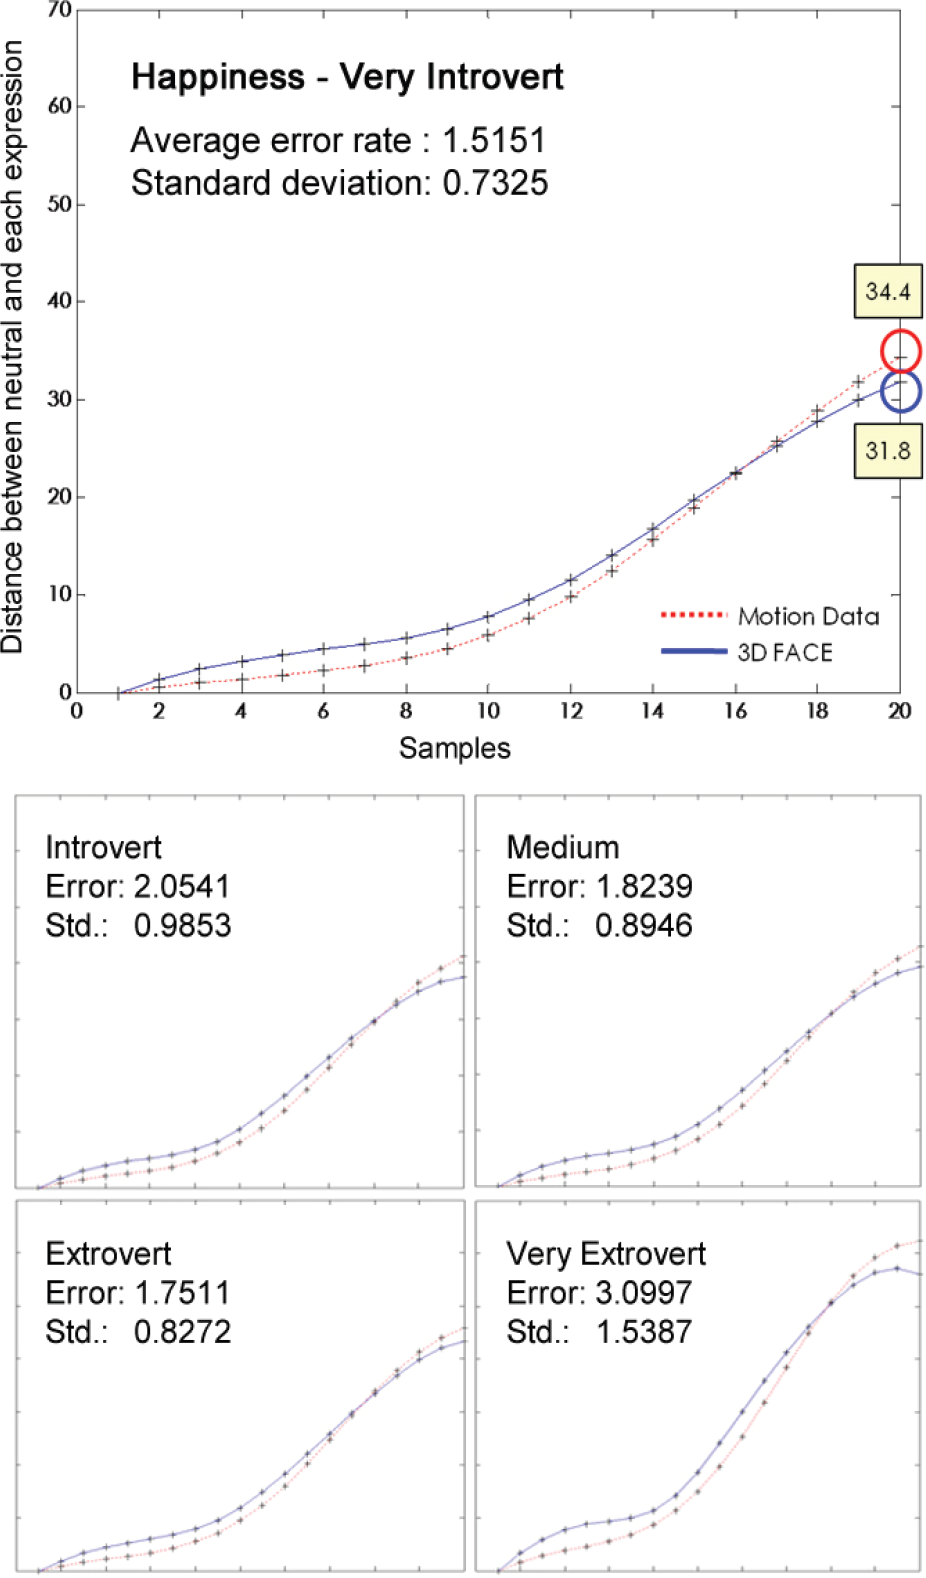
Validation of the motion data of each EI model vs. their facial expression synthesis on a 3D face
5.4 User study for Facial Expressions
In addition, we performed a user study to validate the feasibility of facial expression synthesis. Thirty subjects participated in a questionnaire survey that gauged their satisfaction with the expressions and the degree of distinction between the expressions that communicated different personality traits. The scores ranged on a scale from 0 to 5 points, with higher scores indicating more reliable judgment than lower scores. The score results regarding the satisfaction with the expressions show the following averages: happiness (4.13), surprise (4.35), sadness (4.26), anger (4.61), fear (3.74) and disgust (3.74), with a grand average of 4.14 and a standard deviation of 0.35. The results for the degree of distinction between exaggerated expressions for the personality types yielded the following averages: happiness (3.39), surprise (4.00), sadness (3.81), anger (3.87), fear (3.68) and disgust (4.06), with a grand average of 3.80 and a standard deviation of 0.25.
5.5 Case study for a Real-time Game using BCI
To utilize the proposed methods, we developed a real-time game that uses BCI, in which the 3D face of a character makes facial expressions in real time while a player wearing an EEG device on his/her head manipulates a ‘Flag-up’ game. First, the player wears the EEG device to discover his/her personal trait as determined by PTF, such as VI, I, M, E, and VE. Once this trait is known, the player's emotion as derived from the EEG brain signals can be automatically determined by EEF which is realized by the SVM [35] in real time. The initial stage of the interface is shown in Figure 9, along with the PSDs for each channel and the black screen that is used to experiment with the PTF and to determine an expression rate. The scenario of the game is as follows: the player needs to operate a blue flag and a white flag according to the text commands that appear just above the character.
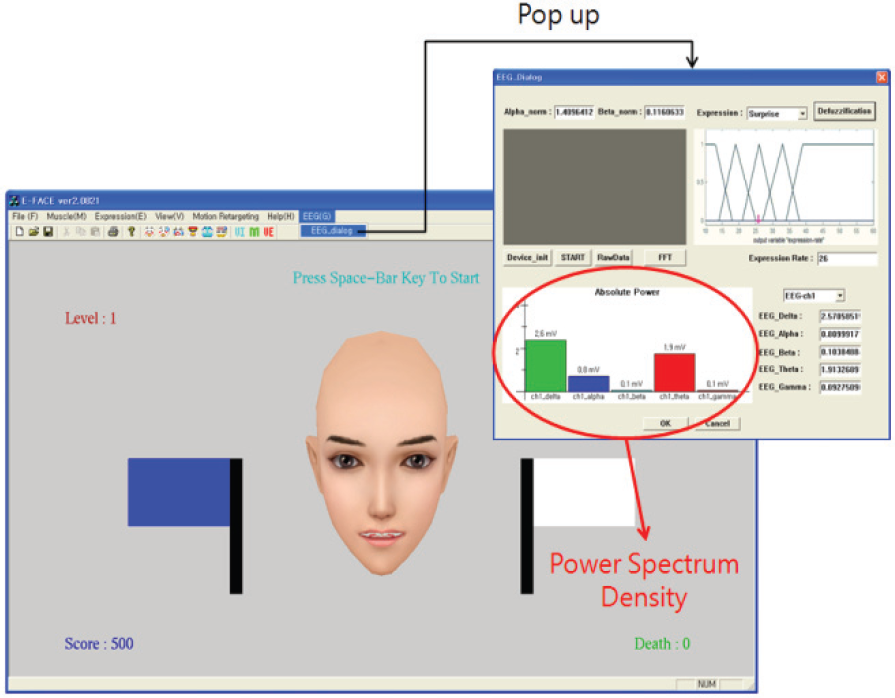
Game interface showing a character and PSD graph with EEG fuzzy model
Also, scores are calculated by an increase of 100 points when a player follows the game rules and a decrease of 100 points when he/she does not. Facial expressions are created in real time while the game is taking place. As the game continues, the player's emotions that are transferred to the character can be displayed, as shown in Figure 10. The degrees of expression take into consideration the personality traits and emotions that have been successfully detected. Each arrow indicates the matched expression rate as determined by PTF and EEF.

Character's expressions in gaming using BCI
5.6 Limitations
There are a number of limitations to the proposed approach that can be improved upon in the future. For example, the methods could be extended so as to take into consideration the automatic recognition of more facial expressions from the EEG data and to reflect more personality traits as well. In addition, the involuntary emotions that are evoked by stimuli need to be perceived in order to extend the scope of the proposed work. For future work, more samples of EEG data of facial expressions need to be collected to make the classification more successful.
6. Concluding Remarks
In this study, we bridged the gap in the existing research on BCI for entertainment use, by studying how facial expressions convey different EI types in order to better realize facial expressions for BCI. The EEG fuzzy model returns a fuzzy membership based on fuzzy rules. The EI fuzzy model then uses the fuzzy membership value to calculate a fuzzy expression rate using defuzzification. Interestingly, we found that each magnitude of expression stemming from a facial movement in the EI fuzzy model corroborates the fact that the expressions of the extroverted traits (VE or E) are more conspicuous than those of the introverted type (I or VI). These findings indicate that the facial expressions in E and VE traits were determined to be more distinct from one another, compared to I and VI traits. Also, the EEF classifies facial expressions using a learning machine tool, WEKA. Facial animations that were created using a muscle-based approach were shown to validate the proposed method.
The automatic extraction of muscle contractions from facial motion capture data also enhanced the animation process in an easy manner.
Footnotes
7. Acknowledgments
This work was partially supported by a Korea Science and Engineering Foundation (KOSEF) grant funded by the Korean government (No. 2009-0072325). The authors wish to thank J. Lee and S. Lee for initial experimental assistance.