
Abstract
In this paper, feature extraction based on data-wave is proposed. The concept of data-wave is introduced to describe the rising and falling trends of the data over the long-term which are detected based on ripple and wave filters. Supported by data-wave, a novel symbol identifier with significant structure features is designed and these features are extracted by constructing pixel chains. On this basis, the corresponding recognition and positioning approach is presented. The effectiveness of the proposed approach is verified by experiments.
1. Introduction
Vision has been widely studied for many robotic applications such as visual serving[1], object tracking[2], human-robot interaction, etc. Among these applications, visual recognition and positioning plays an important role. In structural environments where illumination conditions are stable, vision-based recognition and positioning have received good solutions when the distance between camera and object is close. However, problems arise when the distance is larger or environments are complex and unstable. Some methods have been proposed to address these problems. Background subtraction[3] is often used for object tracking and their positions can be calculated with the help of prior knowledge. This method is feasible with immobile cameras, however it is hard to distinguish different objects effectively. Template matching algorithms[4] based on image region and feature point matching[5] have been used for object recognition. In [6], Yamaguchi and Mizoguchi present an object recognition method based on online template learning. There are still many recognition methods based on the object features of shape, colour and texture[7–9].
For robots working in unknown and complex environments, especially a multi-robot system in which group members cooperate with each other, real-time recognition and positioning of multiple objects is required with adaptability to changing environments. In this case, one solution which has received much attention is to equip identifiers with objects of interest and thus the problem is converted into the recognition and positioning of identifiers. As a typical identifier, colour mark is commonly used[10][11]. In order to recognize different robots or objects with corresponding colour marks, a basic method is to use thresholds in RGB space to find the colours of interest and achieve identification. Compared with RGB space, HSI is proven to be more robust against light changes[12]. In [13], Minten et al. makes a fiducial mark that is made up of two rectangles with different colours and a spherical coordinate transform (SCT)[14] is used. Although significant improvements have been made in colour mark-based recognition, this method still has many limitations and environmental adaptability needs to be further enhanced. A feasible way to reduce the influence of illumination is to use a shape feature instead of colour. In [15], a method based on shape features for robot navigation is given. In addition, some image quality improvement methods may also be used for better recognition such as colour correction[16][17], super-resolution[18], etc. Considering the requirements of multiple objects with enough discrimination as well as visual angle adaptability, in this paper, the structure feature is utilized for better recognition.
The main contributions of this paper are summarized as follows. We introduce the concept of data-wave as well as the corresponding detection means, which is applicable to structure information extraction of an image. On this basis, a novel symbol identifier is designed with its structure features in the form of data-wave extracted from pixel chains.
The remainder of the paper is organized as follows. Section 2 describes the feature extraction based on data-wave. In Section 3, a kind of symbol identifier is designed and the corresponding recognition and positioning approach is also presented. The experiments are given in Section 4 and Section 5 concludes the paper.
2. Feature Extraction Based on Data-wave
2.1 Data-wave
We define a sequence of data with a rising trend and a falling trend over the long-term as data-wave, as shown in Figure 1. There are two types for data-wave: ridge wave and valley wave. For ridge wave, its rising segment comes before the falling segment, while the rising segment of the valley wave comes after the falling segment; notice that some fluctuations may exist which will destroy the overall variation trend locally. Those fluctuations with intermediate data among three adjacent data being obviously larger or smaller than two other data are called ripples. Accordingly, we have ridge ripple and valley ripple (see Figure 1). Given a sequence of data DS, a ripple filter and a wave filter are designed in order to acquire the rising and falling trends.
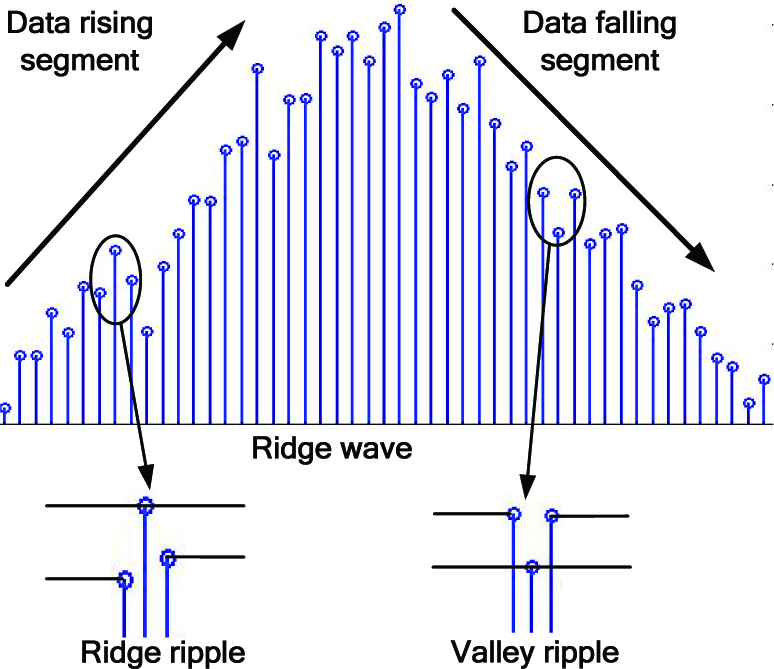
Data-wave and ripple
When three adjacent data d1, d2, d3 satisfy the conditions m(d)≥th1 and sgn(d2−d1)×sgn(d2−d3)=1, these three data compose a ripple, where m(d)=|2d2 d1−d3| is the fluctuation amplitude and th1 is a given threshold. The function of ripple filter is to adjust the intermediate data to (d1+d3)/2. An illustration of a ripple filter is given in Figure 2.
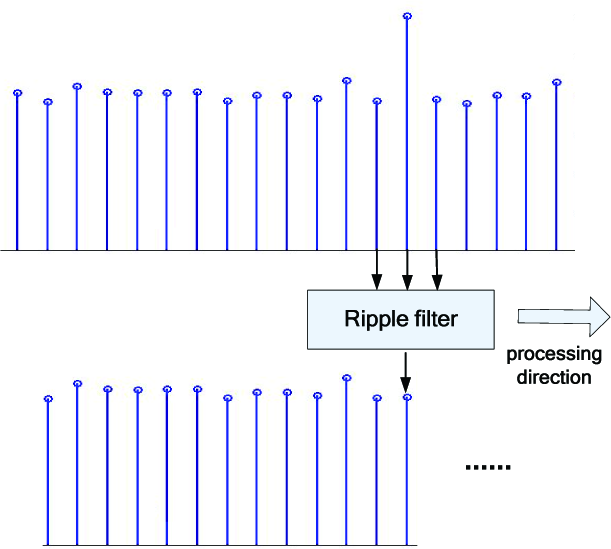
Ripple filter
In order to achieve the detection of a data rising segment and data falling segment for DS, a wave filter is used based on the result of the ripple filter as follows.

where Di is the value of ith unit in DS, tg1=avrD+th2, tg2=avrD-th2, avrD may be given by the average value of data and th2 is a given threshold.
From Eq. (1), there are only three values −1, 0, 1 after the wave filter is executed, as shown in Figure 3. We consider the case with one −1 before a series of 0 and one 1 after them as a data rising segment with its length of the number of data. The data falling segment will arise when one 1 comes before a series of 0 and one −1 comes after them. The first and the last values of a segment are called head value and tail value, respectively. In particular, in a data rising segment or falling segment, there may be only a few, or even no, 0.

Data filtering and segment detection based on ripple filter and wave filter
2.2 The Application of Data-wave in Image Analysis
In an image, we define a sequence of connected pixel points as pixel chain whose data may be analysed by data-wave. In a grey image, a pixel chain may be expressed by a single data sequence formed by grey values of pixels, while in a colour image, the expression is a combination of three data sequences corresponding to the R, G and B components of pixels. When a pixel chain goes across an image edge, there is at least one data rising or falling segment. If a line is crossed by a pixel chain, there is at least one ridge wave or valley wave. By analysing the data rising and falling of pixel chains chosen flexibly, abundant structure information may be described, which is robust to local interference.
In the following, the data rising and falling will be determined based on the output of wave filter. Firstly, we analyse a random DS whose data are evenly distributed within [0, Du]. Let avrD=ηDu and th2=kDu, where η∈[0, 1], k∈[0, 0.5]. Because data distributions in a DS are independent from each other, from Figure 3, the maximum appearance probability of a rising/falling segment with its length of l may be calculated as follows.

where
Figure 4 gives the curve of pr(l) with η=0.5 and k=0.02. From Figure 4, we can see that the maximum appearance probability of a rising/falling segment reduces dramatically with the increasing of l. A smaller l corresponding to a higher probability in a random DS means that it is difficult to acquire reliable information from actual signals from the segment with a length of l. In actual applications, l is larger for reliability. In addition, the reliability may also be improved with the increasing numbers l1, l2 of head value and tail value before and after the segment. When l1+l2+l≥lt, where lt is a given threshold, we think that a data rising or falling segment exists.

The curve of pr(l) with η=0.5 and k=0.02
3. The recognition and positioning approach of symbol identifier
3.1 The design of symbol identifier
In order to better extract the structure feature by utilizing data-wave, the symbol identifier of the object is specifically designed with positioning information being implied, as shown in Figure 5. The symbol identifier is composed of three zones: top arch zone, radial central zone and bottom arch zone. In addition, there are four parts in the radial central zone: left, up, right and down. The spokes only distribute in the left and right parts of the radial central zone, and they taper off from the exterior near to the centre point psc of the radial central zone. Those two arcs, which lie in the top arch zone and bottom arch zone respectively, belong to a circle whose centre is psc. In addition, there is a small darker circular area around psc.

The symbol identifier
In each zone, there are four candidate colours: saturated red, saturated green, saturated blue and pure black. RGB space is chosen to describe colours and a saturated colour refers to the colour where two of its RGB components are 0, while the third one is large (usually 2150). For convenience of expression, the nonzero colour component of a saturated colour is called its main component, while the other components are called vice-components. Additionally, the number of spokes in the left or right part may be 0, 1, 2, 3 or 4. Therefore, the possible combination for symbol identifier may up to 43×52. Even if some invalid cases are removed, such as there is no spoke in the left and right parts, a substantial quantity still exists which is suitable for actual applications.
3.2 The Features of the Symbol Identifier
In order to extract the structure features of symbol identifier, a template with Nc+1 pixel chains is constructed, which is shown in Figure 6, where Nc is an even number. It is easy to know if the base point in the template is the centre point of the symbol identifier as these chains should have the following features:
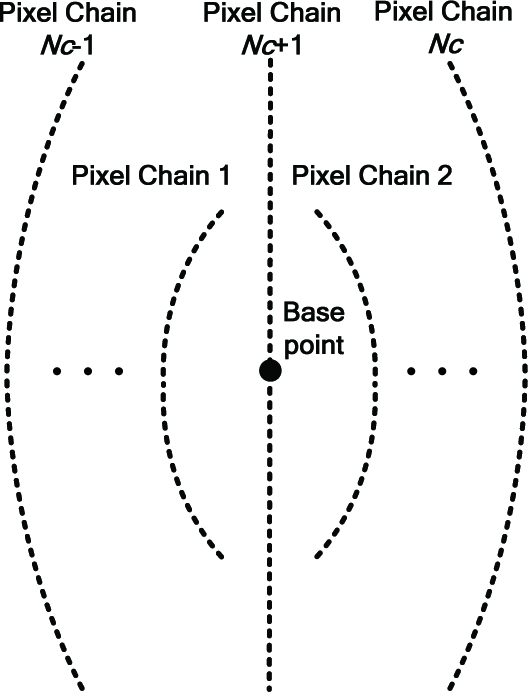
The structure features' extraction template based on pixel chains for the symbol identifier
The data sequences of pixel chains 1, 3,…, Nc-1 corresponding to vice-components of spokes colour should have the same number and arrangement of the data rising segment and data falling segment. In addition, the number of valley waves is equal to that of spokes where the chains go across. Similar conclusions can be drawn for pixel chains 2, 4,…, Nc.
When pixel chain Nc+1 is short enough, data sequences of this chain corresponding to vice-components of spokes colour should have one valley wave due to the small darker circular area around psc. With the increasing length of pixel chain Nc+1, a data rising segment and a data falling segment corresponding to two arcs in the top arch zone and bottom arch zone will arise, and they are almost symmetrical about the base point. Additionally, there is only one valley wave between these two segments.
Besides the features extraction based on pixel chains, some other features for the centre point of the symbol identifier can also be found:
Luminance feature: RGB components are lower than a given threshold due to the small darker circular area around psc.
Luminance difference feature: RGB components are obviously lower than those of points in the up part and down part of radial central zone.
3.3 Recognition of Symbol Identifier
Without image preprocessing a series of judgment machines are constructed based on features provided in Section 3.2 for recognition, and each of them corresponds to a certain feature. Every point of an image is judged by judgment machines one by one and it will be removed directly once it is unable to satisfy the criterion of any judgment machine. Those points that pass all judgment machines constitute a set of candidate points and they are classified according to spokes' distribution and colours' arrangement. Combined with priori knowledge, the centre points of corresponding symbol identifiers are then acquired.
Judgment machines may also be organized optimally. We introduce passing rate p and computing time t to describe the property of a judgment machine. The passing rate of a judgment machine is the ratio of the number of points that can pass the judgment to the total number of points it judges. For an image with a great number of points, this index has a relatively stable statistical significance. It is easy to know that the passing rate P of the combination of all judgment machines is the product of the individual passing rate when the features used by judgment machines are independent of each other. Thus, we have

where NA is the total number of points in an image, ti is the computing time of the ith judgment machine and p0=1 for unity of expression. The ordering of judgment machines is converted to make T be minimum and this is a typical multi-stage optimization problem. Suppose there are only two stages and we have T1=NAt1+NAp1 t2. After the order of these two stages is exchanged, we have T2=NAt2+NAp2t1. Therefore, T1-T2= NA(1-p2)t1-NA(1-p1)t2. When T1<T2, we get:

We define
3.4 Positioning of Symbol Identifier
Figure 7 gives the positioning diagram of the symbol identifier. We establish the camera coordinate system, whose origin point is camera lens and Z axis is lens axis, and thus we have
The positioning diagram of the symbol identifier

where (x1, y1, z), (x2, y2, z) are the coordinates of centre points of the top arc and bottom arc, respectively, and (u1, v1) and (u2, v2) are their image coordinates that may be obtained based on pixel chain Nc +1; f is the focal length in the pixels of the camera; dA is the actual diameter of the circle where these two arcs are located. Therefore, the space position of the symbol identifier may be given by ((x1+x2)/2, (y1+y2)/2, z).
4. Experiments
The experiments are conducted to verify the proposed approach. In order to achieve the recognition of a symbol identifier from a farther distance, i.e., where it is small in the image, only ridge ripples are filtered and lt cannot be too large due to the properties of both the identifier and pixel chains. In the following experiments, the parameters are as follows: lt=4, th1=60, th2=5, Nc=2, dA=19cm.
Experiment 1 is conducted to test the distance and visual angle adaptability. Figure 8 gives the recognition results which are displayed in red circles. In experiment 2, illumination conditions are changeable and the results are depicted in Figure 9. Figure 9(a) and Figure 9(b) demonstrate the recognition results in a brighter and darker environment, respectively.
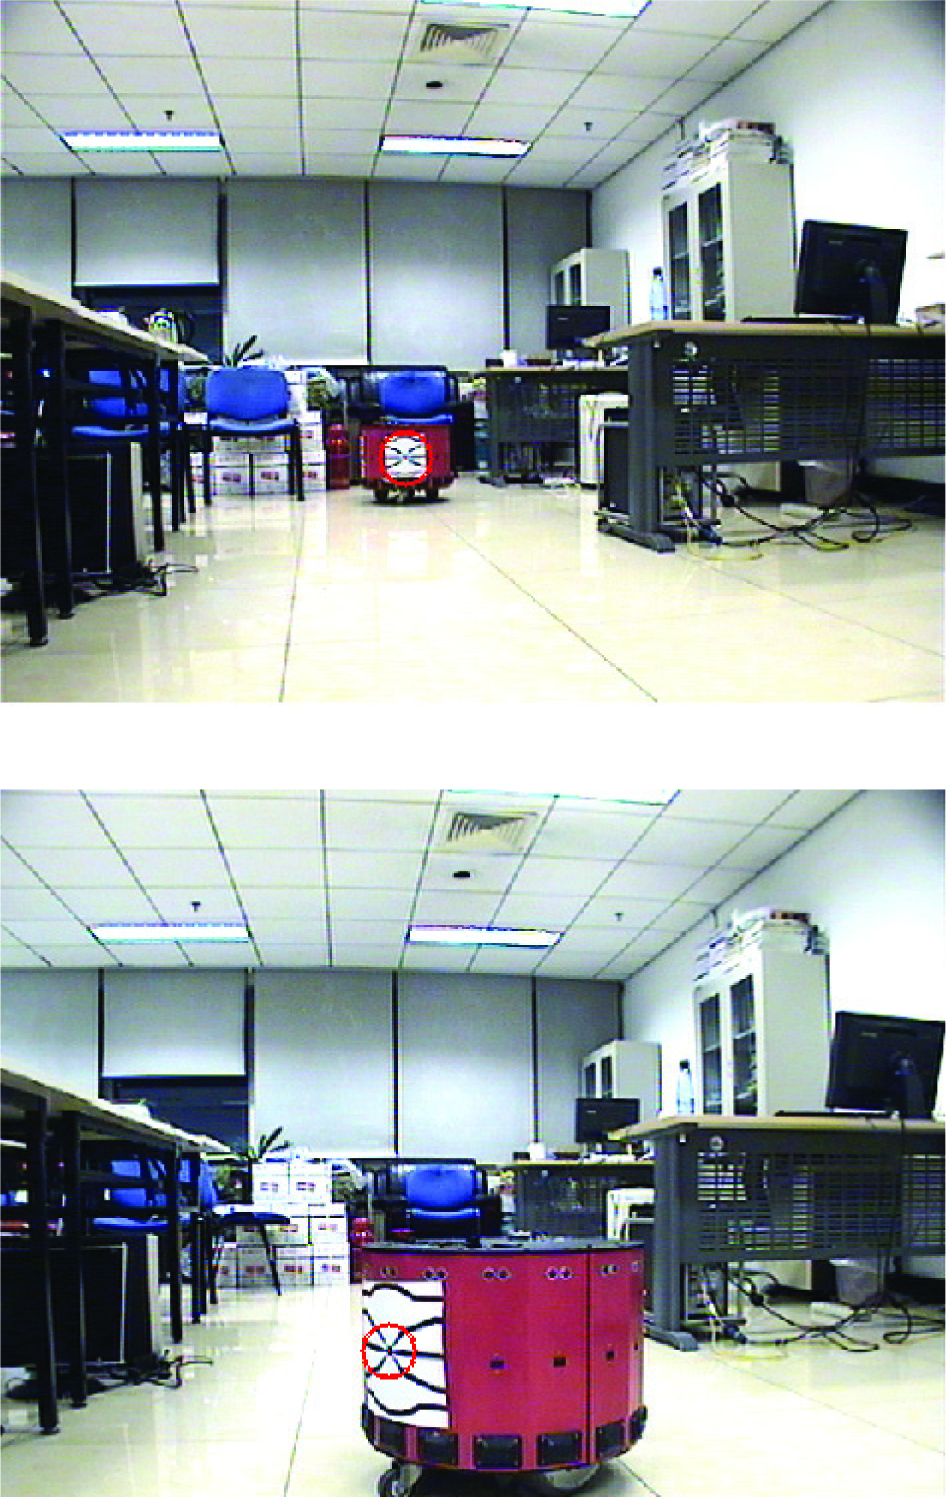
The recognition result of the symbol identifier in experiment 1

The recognition results of the symbol identifier in different illumination conditions
Experiment 3 considers the case with a moving object. Figure 10 gives the positioning result of the symbol identifier placed on the object. From the measurement values of the centre point of the symbol identifier and actual path, the proposed approach is considered effective.

The positioning result of experiment 3
5. Conclusions
This paper firstly describes feature extraction based on data-wave. The specifically designed symbol identifier to identify the object is then given and its structure features are extracted from a series of pixel chains. On this basis, the recognition and positioning approach of the symbol identifier is proposed. The results of the experiments show the proposed approach works well with certain adaptability to illumination conditions. In the future, we shall focus on the construction of pixel chains for better structure features' extraction. In addition, the actual application in multi-robot systems will be conducted.
Footnotes
6. Acknowledgments
This work is supported in part by the National Natural Science Foundation of China under grants 61273352 and 61175111, and in part by the National High Technology Research and Development Program of China (863 Program) under grant 2011AA041001.