
Abstract
In this paper, a generalized equation of pulse propagation in semiconductor optical amplifier (SOA) under the effects of four wave mixing (FWM) has been derived. This equation is applicable for any wavelength division multiplexing system in presence of both interband and intraband effects. The equation is solved numerically regarding the primary conditions of the problem considering the amplitudes of the sideband pulses at the entrance of SOA are zero. The gain of low frequency pulses will be higher than the gain of the high frequency pulses, as well as the gain difference between different pulses will be reduced with the increasing of frequency detuning. On the other hand, the effects of saturation and the asymmetric gain will control the mixing efficiency of the sideband pulses generated on the left and right of active pulses depending on the power of the input pulses and the frequency detuning.
Keywords
1. Introduction
The use of semiconductor optical amplifiers (SOAs) as inline amplifiers has received renewed interest due to the penetration of optical networking into the metro market [1]–[3]. An SOA used as a receiver preamplifier is an elegant approach to optical pre-amplification since the SOA can be integrated with the photo detector. An SOA array can even be used as a compact channel equalizer where the wavelength channels can be equalized through gain adjustment on their individual amplifiers [4,4]. SOAs have already proven their worth in applications for high capacity transmission in metropolitan environments. Therefore, a compact SOA with the potential for mass production and the ability to be integrated into other passive distribution platforms is very attractive for the cost-sensitive metro market. In multichannel fiber-optic communication systems using wavelength division multiplexing (WDM) system [6]–[8], FWM gives rise to interference between channels, thus decreasing the channel quality. Impairments due to FWM play a role in pseudo-linear transmission systems [9,9] as well as in parametric amplifiers. FWM products are of particular importance, as those products fall into the signal band. Each FWM product has different power and the total powers can be used to calculate the noise generated at each frequency [11]–[13].
The determination of FWM products number is a classical problem, but the calculation of each power generated at a certain frequency is very important subject. WDM promises advantages for switching and routing as well as for transmission [9,9]. Optical cross-connects are currently being developed which can switch an entire wavelength from an input fiber to an output fiber. Particularly, simple and compact wavelength converters that help to avoid wavelength blocking. All-optical wavelength conversion has successfully been demonstrated with SOA devices exploiting the FWM [11].
Carrier density modulation and the associated nonlinear phenomenon of FWM affect the performance of amplifiers in two ways. First, the amplifier gain becomes different for different channels. As a result, the output channel powers become unequal even if all channels have the same power at the amplifier input, second some energy is transferred to new sidebands located on each side of the boundary channels as a result of FWM making the amplifier less efficient [12].
In this paper, we are presented a new analysis of FWM to describe the amplification of an arbitrary number of input fields in WDM system by including the combined effects of interband and intraband processes. This case is called as multichannel mixing. The FWM process affects the active channel gains as well as generates new sidebands beyond the boundary channels. We illustrate these effects by describing different systems. The analysis will be done numerically since the analytic one is impossible.
2. Theoretical Treatment
Consider a large number of modes with amplitudes A_n,….,A_1,Ao,A1,…An and angular frequency w_n,….,w_1wo,w1,….wn. The total electrical field be described as a set of discrete oscillating spectral modes

where c.c. denotes the complex conjugate, U(x,y) is the transverse field distribution supported by SOA cavity geometry, ê is the polarization vector of the electric field and Am (z) are the complex amplitude (the phase matching are not included here due to very little effects).
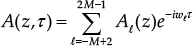
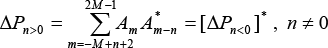
The general case may be found for M channels system by considering a WDM system with M channels, where M −1 channels will be generated on each left and right side of the active channels. Hence, the total channels in this system will become 3M – 2. The indices of active channels are 1,2,3,……‥,M, while the indices of the left and right products, respectively, are –M +2, –M +3,…,0 and M + 1,M + 2,…,2M −1. It is important to note that, all channels have the same pulse shape and power, such that the approximations of the pump-probe configuration cannot be done in the present problem. However, assuming the central pulsation at w1, Eq.(1) may be rewritten as

where
The power of the electrical field can be determined by substituting Eq.(3) into P (z, τ) =| A (z, τ) |2 to get

where Ω is the frequency detuning. The first term represents the total stationary optical power of all pulses. Moreover, Eq.(4) may be reformed to obtain

where
The propagation equation of an optical field in the SOA is described by the following equation [14]

Eq.(7) may be modified to include the intraband and interband effects as follows

where A is the pulse amplitude and α is the attenuation factor. The parameters β m and gm (m = cdp, shb, ch) represent the linewidth enhancement factors and the gains of the respective process. Note that, the approximation At Δk ≈ 0 (phase matching condition) is satisfied through the derivation of the above equations due to short device length and low dispersion of the SOA.
2.1 Gain Dynamics
The carrier density of electrons N in the active region can be found by solving the rate equation [2]

where I is the current flowing through the active region of volume V, q is the electron charge, τc is the carrier lifetime and Psat is the saturation power. The gain g (N) is assumed to vary linearly with the carrier density, that is
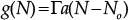
where Γ is the confinement factor, a is the gain coefficient and No is the carrier density at which the active region becomes transparent. For pump-probe configuration system, Eqs.(9) and (10) will give the following solution [9]

where

Here, go represents the small signal gain. Depending on Eq.(6), the solution in Eq.(11) may be extended to any system of channels to obtain
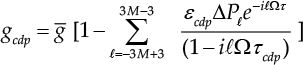
On the other hand, the simplified differential equations for the gain coefficients of intraband effects are [14]

where gsat is the saturation gain and m = shb, ch. The parameters εm and τm are the gain compression factors and the characteristic times of the respective process. For pump-probe configuration system, the solution of Eq.(13) will take the following form [13]

Also, Eq.(14) may be extended to any number of channels depending on (6) to obtain

2.2 Generalization of Propagation Equation
Inserting Eqs.(12) and (15) into (7), using (3) and expanding the summation of amplitudes, yields

where γm = εm (1 – βm). Eq.(16) contains a large number of terms that may be classified into 3M – 2 differential equations depending on the exponential function at each set. However, equating the coefficients of the same exponential functions eiKΩτ, where K is an integer, will generate 3M – 2 differential equations that may be described by the generalized equation

where

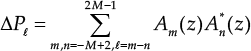
and j is an integer that denotes the channel index, i.e. channel location, and M denotes the number of active channels in the system. The coefficient ΔPn is defined as
Eqs.(17) and (18) are our main result in this paper. They describe how the complex amplitude of each channel evolves along amplifier by including the effects of both interband and intraband processes. The former contribution becomes negligible for Ωτ cdp >> 1 since carriers cannot respond fast enough to changes in the amplitude if Ω exceeds much more than τcdp−1. In general, the indices j and k in Eq.(17) take integer values which extends beyond the number of channels M since FWM creates new frequency components on both sides of the boundary channels.
Practically, it is often sufficient to consider only M – 1 additional channels on each side. One then solves Eq.(17) numerically with j =–(M −1) to j =2M −1 by setting Aj (0) = 0 for values of j outside the range j = 1,2,3,…M (active channels). Since Aj is complex, one needs to calculate 6M – 6 of the parameters AP, that may be determined to form a set of 3M – 2 nonlinear differential equations that may solve to characterize the amplifier.
As an example, the extraction of Eqs.(17) and (18) for M = 6 and j = 4 will give

and

For a larger system, i.e. large M, the above equations will be very huge. For example if M = 20, there is a set of 58×2 from ΔPj that must be calculated to explain the propagation equations of the system. However, the analytical solution for M > 2 is impossible, hence the numerical treatments will be adopted.
3. Results and Discussion
To compute the FWM performance of SOA in WDM systems, a computer program has been written in Mat Tab to analysis the system of equations in Eq.(17) using a fourth-order Rung-Kutta method with a fixed step size. The simplified computation is equivalent to dividing the SOA into k sections, each of length ΔL = L / k which is equal to the step-size of the Rung-Kutta integration. The device parameters used in the simulation are listed in table(1).
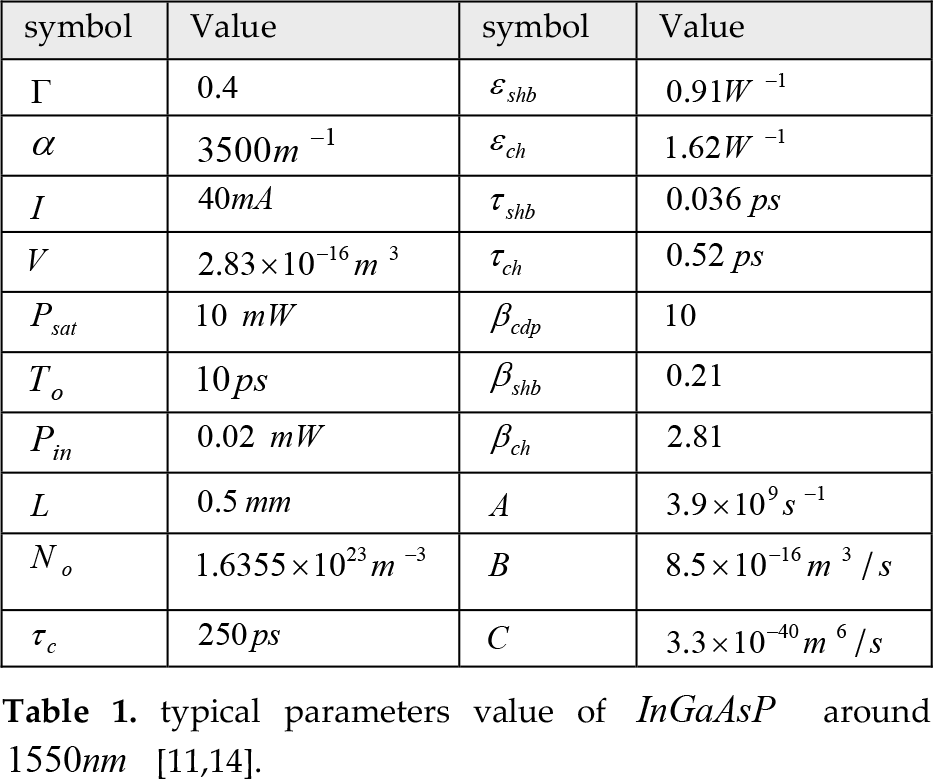
Fig. (1) represents the sidebands power as a function of channel 1 power in the case of constant power at channel 2 for 2-channel WDM system using different frequency spacing. For 2-channel system with P1 >> P2, any frequency spacing gives a higher conversion efficiency for the left sideband power in comparison with the right sideband. Physically, two photons at w1 are annihilated to create two photons at w1 – Ω and w1 + Ω. Similarly, two photons at the frequency w2 are annihilated to create two photons at the frequency at w2 – Ω and w2 + Ω. As a result, the left FWM product is the larger one for any frequency spacing due to P1 >> P2, see [9]. The situation is changed for comparable P1 and P2, where the saturation effects will dominate at the higher frequency. In turn, the sideband powers curves will be intersected at a certain power of the channel 1 depending on the frequency detuning. The intersection take place at higher frequency detuning for higher channel 1 power. In other words, using a same power for 2-channel system will dominate the left sideband power for lower frequency detuning and the right sideband power is dominated for higher frequency spacing. The intersection point represents the equalization of asymmetric amplification in SOA and saturation effects, where the power of channel 1 will control the shifting of intersection point.

sidebands power (in a system of two active channels where channel 2 is constant, P2=0.2mW) as a function of power of channel 1, for different frequency spacing.
Fig.(2) explains the behavior of powers for three WDM systems (2-channel, 4-channel and 8-channel). The figure represents the power behavior of active channels and their sum as a function of frequency detuning. The power behavior of active channels and their sum variations is well expected, where the effect of FWM is to increase the gain for the low frequency channel and to decrease it for the high frequency channel. The curve of active channels sum has approximately a constant value in higher frequency detuning and it decrease in low frequency because the FWM that causes the depletion of active channels. Generally, all active channels experience a high variation in the low frequency detuning but the variation is very small for the higher frequency detuning. Again, this situation may be attributed to the small conversion efficiency for higher frequency detuning.

three WDM systems (2-channels, 4-channels, and 8-channels). The power of each active channel and the sum as a function of frequency detuning.
4. Conclusions
In conclusion, the effect of FWM on the active channels is to increase the gain for the low-frequency channel and to decrease it for the high-frequency channel. On the other hand, the effect of FWM on the sideband channels are controlled by the equivalence of the saturation effects and the asymmetry of gain, where the left and right sideband powers are varied depending on the input power and frequency detuning. For large frequency detuning, the power variations are very little, but the need for large bandwidth in optical communication will prevent this selection. As a result, we cannot avoid the FWM in WDM system.