
Abstract
We address the problem of classifying 3D point clouds: given 3D urban street scenes gathered by a lidar sensor, we wish to assign a class label to every point. This work is a key step toward realizing applications in robots and cars, for example. In this paper, we present a novel approach to the classification of 3D urban scenes based on super-segments, which are generated from point clouds by two stages of segmentation: a clustering stage and a grouping stage. Then, six effective normal and dimension features that vary with object class are extracted at the super-segment level for training some general classifiers. We evaluate our method both quantitatively and qualitatively using the challenging Velodyne lidar data set. The results show that by only using normal and dimension features we can achieve better recognition than can be achieved with high-dimensional shape descriptors. We also evaluate the adopting of the MRF framework in our approach, but the experimental results indicate that thisbarely improved the accuracy of the classified results due to the sparse property of the super-segments.
1. Introduction
With the increasing availability of 3D sensors such as lidar sensors, stereo and SFM(Structure From Motion) systems, the 3D point clouds of urban scenes are easier than ever to collect. The lidar sensor is faster and more accurate than other 3Dsensors. It is important to provide a suite that can automatically segment and classify the data into object classes, since the segmentation and the classification of 3D point clouds are critical for several important applications including scene understanding, autonomous robots and cars.
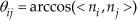
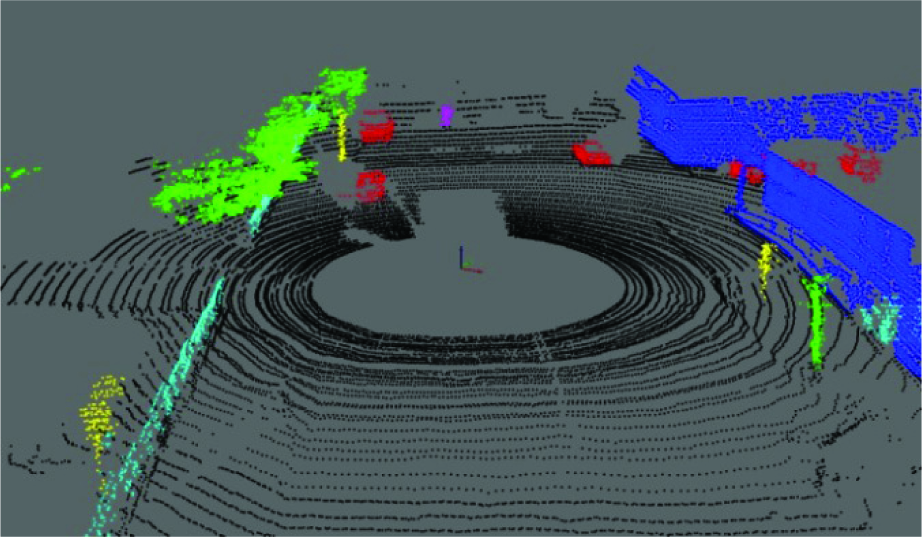
Taking autonomous cars as an example, to move safely and efficiently through urban streets, as Figure 1 shows, the autonomous car needs to distinguish between the ground and obstacles, which include people, cars, signs, houses and fences, and obtain the location of the obstacles at the same time.
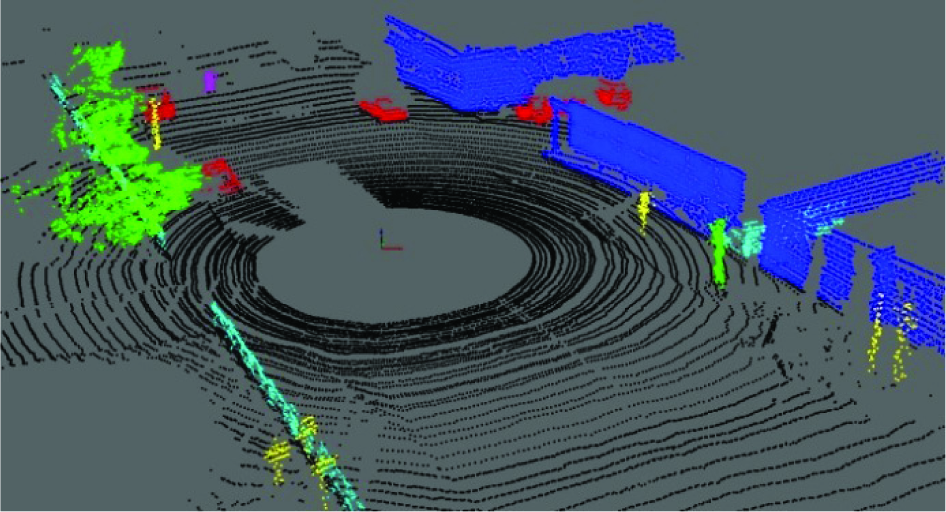
Scan data of a typical urban street scene. The hand labeling is colour-coded: black-ground, red - car, green - tree, yellow - sign, blue - house, cyan - fence, magenta - person.
2. Literature Review
Over the last few years, many efforts have been made to solve the problem of segmenting and classifying objects in 2D images, which contain colour and texture information, and impressive results have been obtained[1, 2]. However, one potential drawback of employing 2D appearance information is the dramatic changes that can occur due to camera position and perspective change and lighting and texture variations [3]. The 3D point clouds collected from 3D sensors are invariant to those factors, but the segmentation and classification of 3D point clouds are still challenging due to occlusions caused by obstructions, density variation caused by different distances of objects from the sensors, and lack of colour and texture cues. Biosca et al. [4] proposed a method to segment 3D point clouds into planar parts without semantics. Pu and Vosselman [5] proposed an approach to segment 3D point clouds into polygon parts with features, but they focus on the segmentation and reconstruction of buildings.
Two main groups of techniques exist for semantic segmentation of 3D point clouds. The first group, called point-based techniques, are based on classifying every point with features that take neighbouring points into account. In [6], for every point to be labelled, some neighbouring points are picked by a fixed radius sphere or cylinder, and properties of the local neighbourhood of a point, such as how planar the neighbourhoods are or the height of the neighbouring points, are computed. Then, Associative Markov Network (AMN) models, which enforce the preference that adjacent points have the same label, are applied for the supervised learning. More recently, some more efficient approaches, such as using anisotropic models [7], higher-order cliques with Conditional Random Field (CRF) models [8, 9], and Non-AMN models [10, 11], have been proposed. A different approach is presented in [12] that involves combining the top-down cues available from object detection using local 3D feature detectors and descriptors and bottom-up MRF for the purpose of semantic segmentation. Generally speaking, the main advantage of the above methods is that the graphical models can optimize the segmentation and classification jointly by minimizing the energy function defined over the graph representing the 3D points and their neighbouring points. However, the training of the model is represented by a high computational cost. With the learned parameters, the inference also takes a long time. Furthermore, a feature that only takes very small-scale neighbourhoods into account lacks distinctive information.
Another group of techniques for semantic segmentation of 3D point clouds is group-based techniques, which aim to solve the time-consumption problem of the point-based techniques. Lalonde et al. [15] first propose a grouping method: the saliency features (named scatter-ness, linear-ness and surface-ness) in a local neighbourhood are computed, and a parametric model of the saliency features distribution is learned by fitting a Gaussian Mixture Model using the Expectation-Maximization algorithm. Then, the 3D points that share similar characteristics are grouped into connected components. Finally, the features of the connected components are exacted to classify the different types of objects. Lim et al. [16] describe over-segmenting the 3D point clouds into super-voxels using 3D scale theory [17] and setup CRF models for super-voxels instead of 3D points with features that include colour and intensity provided by 2D images, saliency features and normal vectors of super-voxels. Similarly, Tombari et al. [18] deploy a specific grouping algorithm using salient 3D key points within the 3D point clouds and the MRF models with 3D local features to classify the 3D key points. The main limitation of this method is the uncertain affected areas of 3D key points. Another approach introduced in [19] generates a soup of segments using mean-shift clustering, considers merges between clusters of up to three neighbouring segments, and classifies the soup of segments by using spin image signatures describing an object.
In this paper, we present a group-based framework for the semantic segmentation of urban street 3D point clouds using only shape cues. Our method differs from most recent proposals because it employs a region-growing segmentation method to over-segment the 3D point clouds into super-segments, which consist of small-scale individual objects and planar surfaces of large-scale man-made objects (e.g., houses and fences), with the following considerations. First, small-scale individual objects and planar surfaces of large-scale man-made objects have more distinctive information than very small–scale neighbourhoods of 3D points. Second, instead of segmenting the houses and fences into individual objects as in [19], we use the planar surfaces of the houses and fences as super-segments for classification because the houses and fences have various shapes, which are combinations of planar surfaces and difficult to classify, especially for noisy and incomplete point clouds. Finally, using super-segments can further reduce the number of data items. With this method, the total processing time can be significantly reduced.
Another key idea of our proposal is the deployment of general-purpose classifiers rather than collective classifiers. Thanks to this approach, our framework is more flexible and general so that we can choose a suitable classifier, such as nonlinear classifiers or kernel-based classifiers. As an additional contribution, our proposal deploys projected ground dimension features, which are computed by the bounding box of points projected from 3D space into a 2D ground plane. The projected ground dimension features are more effective than saliency features [17] with respect to the scatter-ness and surface-ness of super-segments. Moreover, computing the projecting ground dimension features is faster than computing a spin image [13].
The paper is organized as follows. Section 3 provides an overview of our framework. Section 4 proposes an algorithm to generate the super-segments for 3D point clouds. Section 5 presents the features extracted from the super-segments. Section 6 is devoted to the experiments and results. Section 7 concludes this paper.
3. Overview of the Framework
Figure 2 shows an overview of our framework. Given a 3D point cloud of an urban street scene, the proposed approach starts by finding ground points by fitting a ground plane to the scene. This is because the ground connects almost all other objects and we will use a connect component based algorithm to over-segment the point clouds in the following step. Similarly to [19], we project the points to the xy plane of the coordinate system, bin the points into grid cells of size 20cmx20cm, build a subset of points that consists of those that fall within a range of the minimum z-value in each cell, and run RANSAC plane fitting on the subset of points across all cells in the entire point cloud to obtain the ground plane estimation. The points close to the ground plane are labelled as ground and not considered in the remainder of our approach.
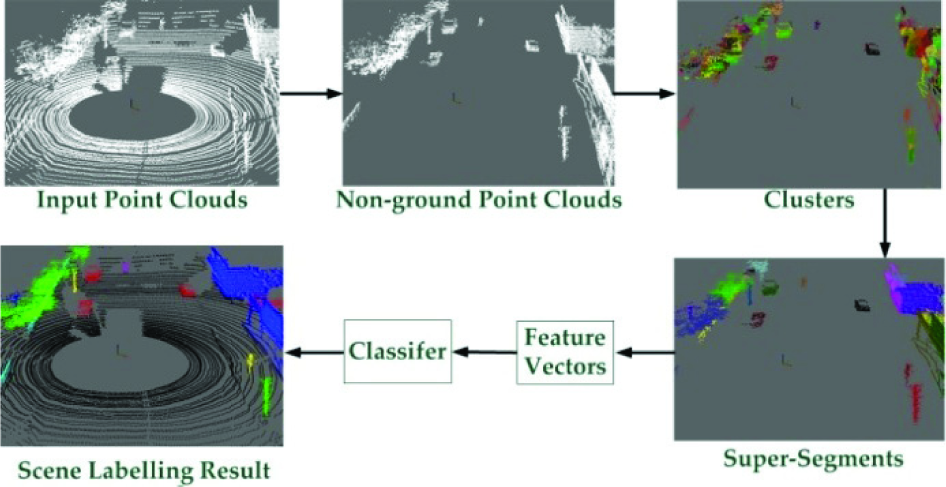
Overview of our framework
After segmenting out the ground points from the scene, we use a connect component based algorithm to cluster the points with a fixed size. According to the cluster's characters, the clusters are merged into super-segments that consist of small-scale individual objects and planar surfaces of large-scale man-made objects. Six discriminative features are extracted from the super-segments and combined together to train a general classifier. Finally, an accurate classification of urban street scenes is obtained, as presented in Section 6.
4. Segmentation of Point Clouds
Pixels and points are not natural entities. They are merely a consequence of the discrete representation of images or 3D objects [20]. Pixels and points by themselves contain a limited amount of information, especially for points in 3D point clouds, which lack colour and texture information. A point is not enough to determine the correct object label, while the proposed super-segments have enough discriminative features to label objects. To generate the super-segments, we propose two stages of segmentation: a clustering stage and a grouping stage.
4.1 Clustering Stage
In the clustering stage, an unorganized point cloud P is divided into small parts, called clusters C. We have considered two different methods. The first, referred to as the super-voxel method [16], iteratively estimates the radius of the super-voxel with respect to the estimated curvature, density and colours of points. It is easy to infer that this method is time consuming due to the iterative estimation. Trading off between the speed and accuracy of the clustering algorithms, we propose another approach modified from object point clusters [21], which aims to obtain individual objects with the assumption that there are large distances between individual objects. In our approach, a cluster is defined as Equation (1).

where p is a single 3D point, i is the cluster index, dth is the threshold of the maximum distance, and N is the maximum point number of a cluster. Equation (1) means that the distance between one point and its nearest neighbours belonging to the same cluster is less than d th (0.3m in our experiments). First, a point was randomly chosen from unclustered points in the scene, and then a cluster was grown around it. The limitation of the point number of a cluster is used to divide a point cloud into small parts, instead of individual objects or connected objects. The small distance between two objects may lead to segmentation error, but the maximum point number of a cluster will reduce the error rate (less than 0.2% in our experiments). The cluster example of one scene is presented in Figure 3. Different clusters are labelled with different colours.
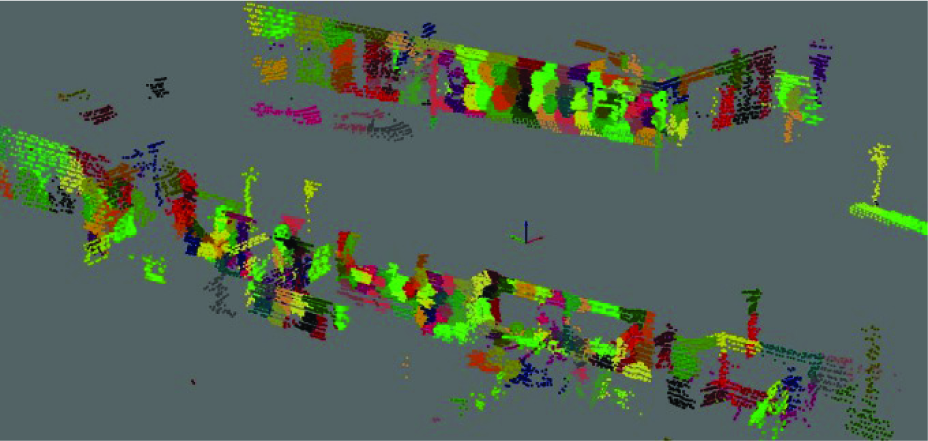
A cluster example of one scene
4.2 Grouping Stage
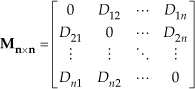
In the grouping stage, we propose an algorithm to merge clusters C into super-segments S via region growing with respect to the connectivity and normal vector of clusters. Supposing Ci has m points and Cj has n points, the distance between Ci and Cj is defined as Equation (2). The connectivity of clusters can be represented by an adjacent matrix

In contrast, we calculate the angle between the normal vector of a cluster and the vertical vector using Equation (4) and the normal similarity of clusters via the angle between two clusters using Equation (5).
where ni and nj are normal vectors at Ci and C j respectively, and nv is the vertical vector (0, 0, 1). The normal vectors are calculated by using RANSAC-based leastsquares plane fitting. Then, we can merge the clusters by solving the set union problem [20], which consists of maintaining a collection of disjoint sets under the following operations:
union(A,B): combine the two sets A and B into a new set named A;
find(x): return the name of the unique set containing the element x.
The proposed grouping algorithm first merges the clusters by considering the connectivity (
A group example of one scene
5. Features of Super-segments
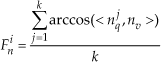
For each super-segment, we extract six features computed by using 3D points within a super-segment to train the classifiers. The six features are Area, Lower area, Edge ratio and Maximum edge of the projected bounding box, Height above ground and Normal angle, which are denoted as Fia, Fila Fire, Fime, Fih and Fin for each super-segment i. The first four features are computed based on the projected bounding box, which is obtained by projective transformation according to the following steps:
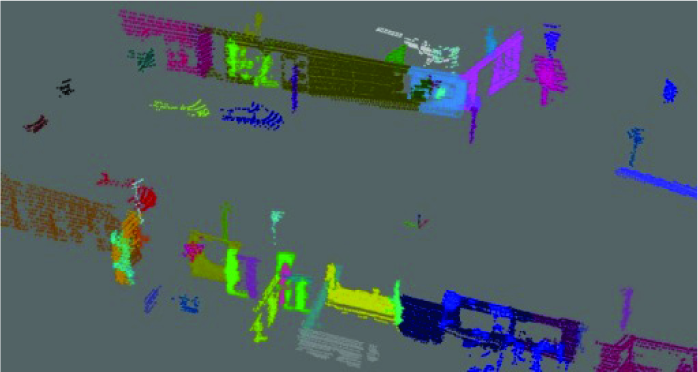
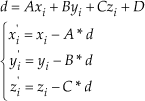
Project the 3D points Pi(xi,yi,zi) (blue points in Figure 5) within a super-segment to the ground plane Ax + By + Cz + D = 0 using Equation (6) and obtain the points Pi(xi,yi,zi) (red points in Figure 6).
3D points are projected to the ground plane The projected bounding box Compute the eigenvalues (λ1,λ2,λ3) and eigenvectors (α1,α2,α3) of all Pi. Then, project the Pi to the eigenvectors, resulting in Pi″(x″i,yi″,z″i) (black points in Figure 6). Compute the projected bounding box of all Pi (the red box in Figure 6).
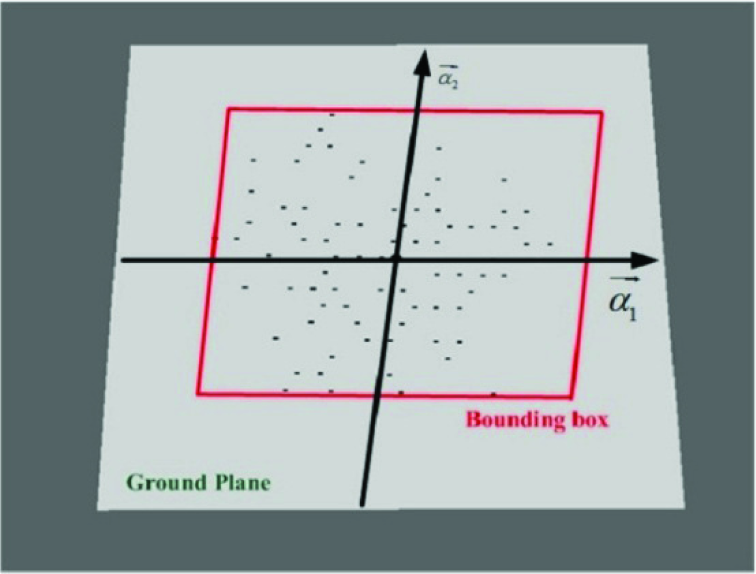
Because of the segmentation of the point clouds, the projected bounding box has some effective features for classifying the super-segment due to the invariant dimension of objects. For example, the point clouds belonging to people have a small projected bounding box area. We extract four features based on the projected bounding box.
6. Experiments
We use the challenging Velodyne lidar data set [19] to evaluate our algorithm's performance. The data set consists of ten different urban scenes, and each scene has nearly 70,000 points. The hand-labelled points belong to seven semantic object classes, which include House, Fence, Tree, Sign, Car, People and Ground. The task of our approach is to extract the ground points and classify other points into the first six categories. Finding ground points is discussed in Section 3, and the ground recognition accuracy is approximately 94.2%. Our experiments in this section are intended to show the advantages of super-segments and their features for classification.
6.1 Quantitative and Qualitative Evaluation
In our experiments, we develop two general classifiers trained by ANN (Artificial Neural Network) and Boosting. Our first classifier is built with a standard feedforward ANN. We choose RPROP [23] to perform the optimization because this method allows weights for each sample. We experimentally find that two hidden layers with sizes of 50 and 20 works well on our samples. One advantage of an ANN is that it is easy to transform the testing result into a classifying probability. Our second classifier is built by the Boosting algorithm with a total number of 200 decision trees, each with a maximum depth of 5. These parameters are determined by our experimental results. Friedman summarized four Boosting algorithms: Discrete AdaBoost, Real AdaBoost, Gentle AdaBoost and LogitBoost in [24]. Because Real AdaBoost can obtain a class probability estimate of each decision tree, we choose it as our Boosting algorithm. However, the final output f of each decision tree is not the probability. The relationship between class probability p and f is f = (1 / 2)log(p / (1 − p)). Based on this, we can still obtain the class probability estimate, which can be fed to a MRF model.
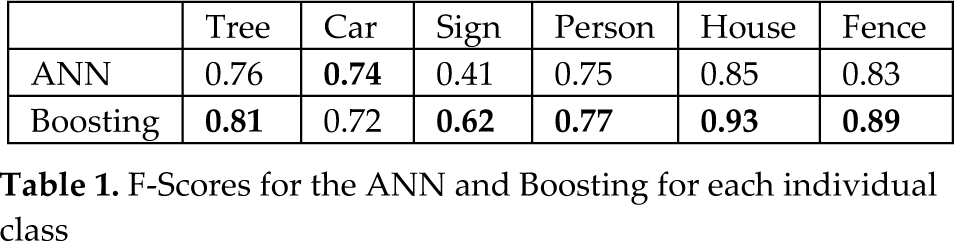
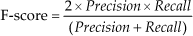
Of the 10 scenes, we train using seven and test on the remaining three scenes. Once the super-segments are classified, all the points belonging to a super-segment are labelled with the same class as the super-segment. Figures 7 and 8 present the precision and recall confusion matrices between the six classes over all 10 scenes using the ANN classifier. Figures 9 and 10 present the precision and recall confusion matrices using the Boosting classifier. As we can infer from Figures 7–10, the ANN achieves better recall than Boosting. In contrast, Boosting achieves better precision than the ANN. Therefore, we use the F-score as defined in Equation (9) to evaluate the classifiers. As Table 1 illustrates, Boosting outperforms the ANN for each individual class.
F-Scores for the ANN and Boosting for each individual class
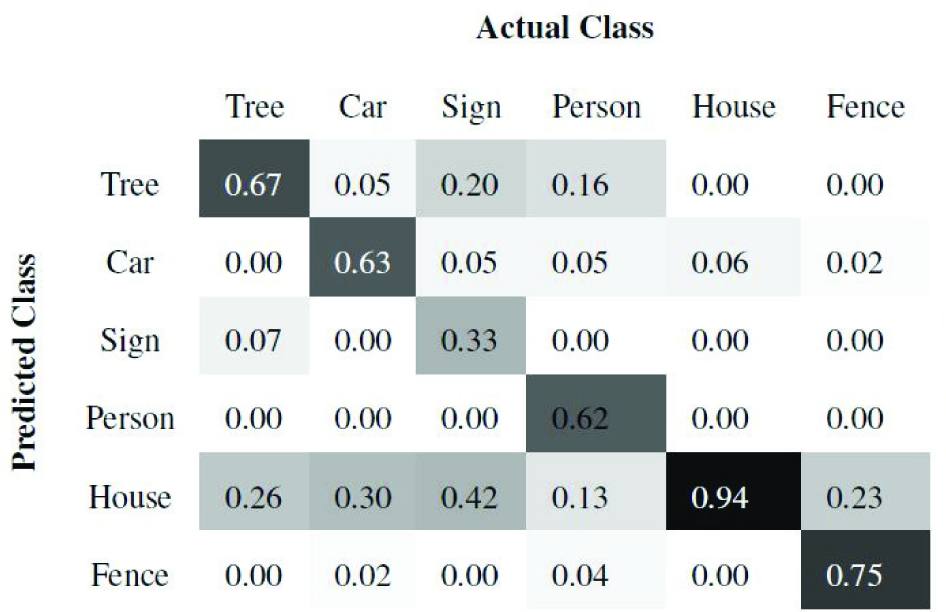
Column-normalized precision confusion matrices between the six object classes using the ANN.
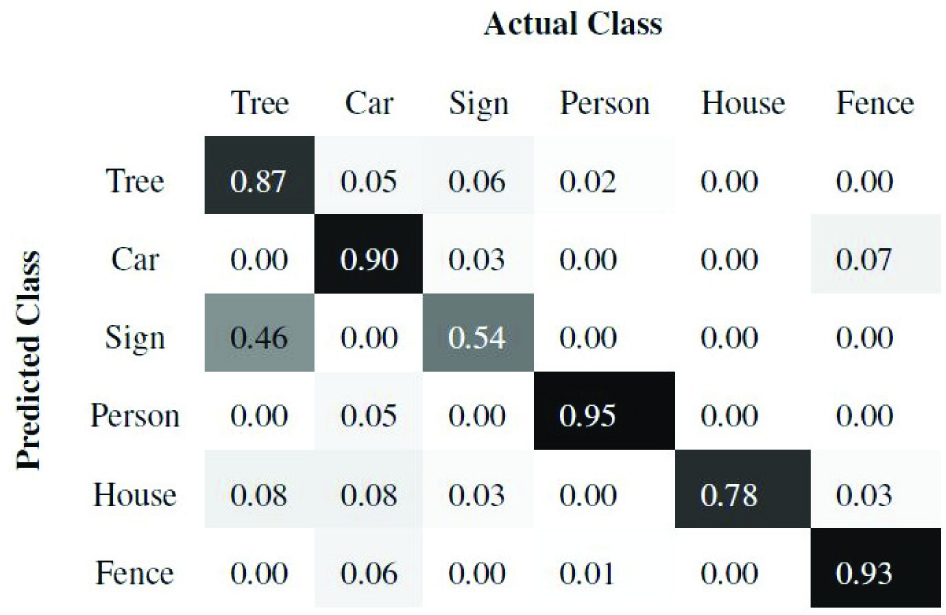
Row-normalized recall confusion matrices between the six object classes using the ANN
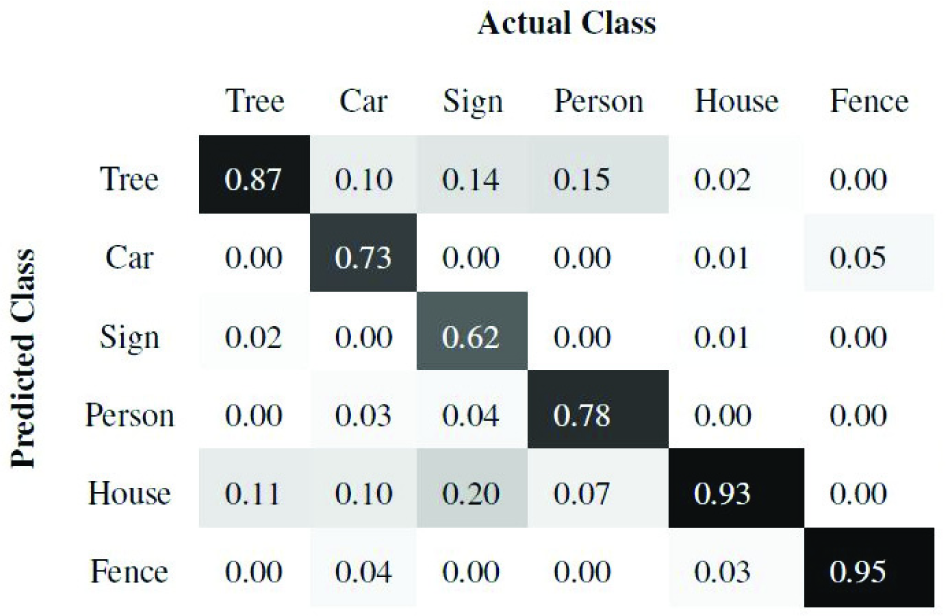
Column-normalized precision confusion matrices between the six object classes using Boosting
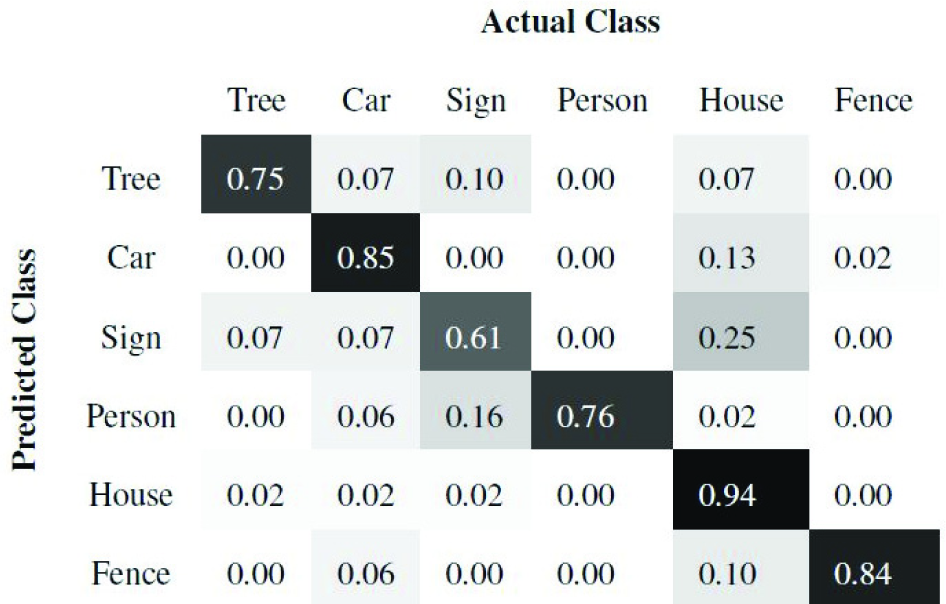
Row-normalized recall confusion matrices between the six object classes using Boosting
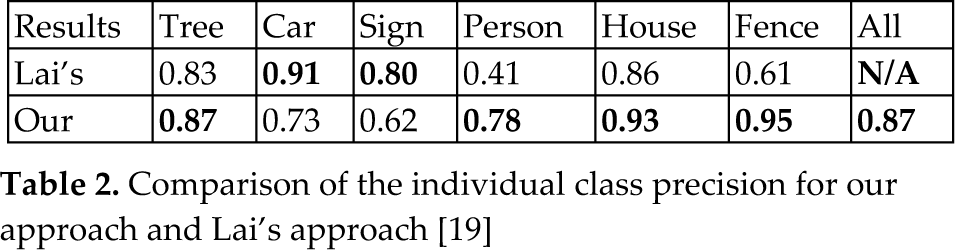
We also compare our approach to the method described by Lai in [19], which adopts a “soup of segments” segmentation of point clouds and the Grid Spin Image Signatures features. Lai's method achieved an average F-score of 0.67, which is lower than most individual class's F-scores for Boosting in Table 1. As far as the individual class precision is concerned, our super-segments based method yields better results for four classes, as Table 2 demonstrates. The overall accuracy is 87%. There are two categories (Car and Sign) for which our approach's performances are not as good as those in [19] due to a lack of detailed shape features, such as Spin Image Signatures. In particular, the signs and some small trees have similar dimension features and it can be difficult even for humans to distinguish them. Figures 11 and 12 show some of the qualitative results of the test scene, achieved by our approach using Boosting.
Comparison of the individual class precision for our approach and Lai's approach [19]
Hand-labelled ground truth of the test scene: black - ground, red - car, green - tree, yellow - sign, blue - house, cyan - fence, magenta - person
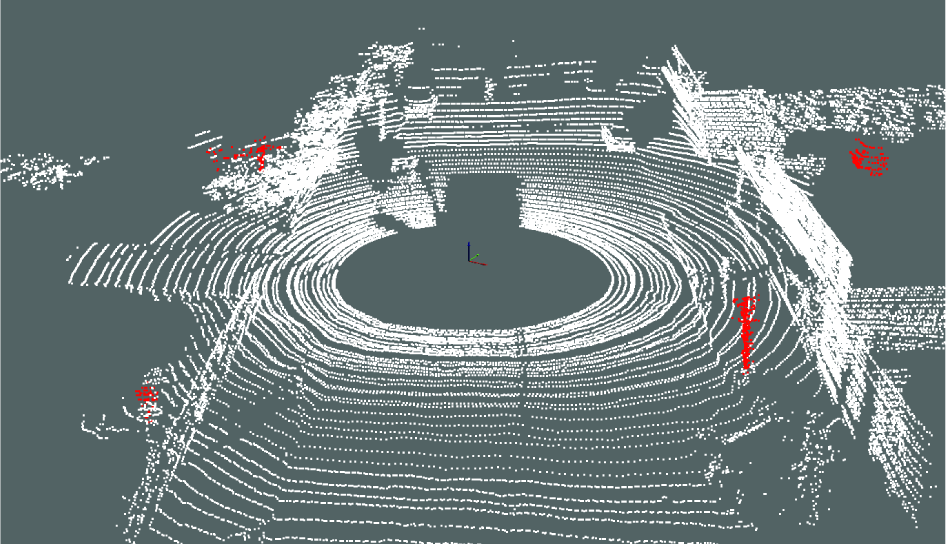
Classification result of the test scene: red -incorrectly classified points, white – correctly classified points
We implement our approach using C++ programming language on a computer with a 3GHz CPU and 4GB of memory without any parallel optimization. From a computational point of view, the total processing time is approximately 5 – 10 seconds per scene, including segmentation(80%), feature extraction(10%), and classification (10%).
6.2 Graph-Cut Based Optimization Test
After labelling each super-segment, we tried to adopt an MRF model and a graph-cut algorithm to optimize the classification results. We constructed a pairwise MRF by building a graph G =< V,E >, where each node vi ∈ V represents a super-segment and each edge eij ∈ E denotes the neighbouring relationship between super-segments. Each super-segment has four neighbours, which are the nearest segments to it. Consider the energy function E(g) = Esmooth(g) + Edata(g), where g is the label of super-segment, Esmooth is the smooth term and Edata is the data term. The data term is computed by class probability, as mentioned in Section 6.1, and Esmooth is derived from the Potts model. The experimental results show that this approach barely improved the accuracy of the classified result, for both the ANN and Boosting. Specifically, the improvement is less than 0.5%. The reason may be that the super-segments are sparse and that most of the distances between super-segments are large. In other words, the smooth term of the energy function does not work. As a result, the energy function depends on the data term and the graph cuts degenerate into our classified result.
7. Conclusion
In this paper, we presented a novel framework for the classification of 3D point clouds using super-segments. Our main contribution is a proposed segmentation algorithm to generate super-segments, which consist of planar surfaces of large-scale man-made objects and small-scale individual objects. Furthermore, we presented some effective normal and dimension features, which can be computed rapidly, to train the classifiers. The experimental results show that our approach has good classification precision and recall using only those normal and dimension features and that our approach outperforms some other approaches.
There are several interesting directions for future work. First, we can augment our approach with more cues, such as colour and texture, which can be obtained from another dataset gathered by the lidar and colour cameras. Because the colour and texture cues benefit not only segmentation but also classification, we believe the accuracy of our approach can be improved. Second, in our approach, we did not consider the Spin Image features due to their time-consuming nature, which led to a lower precision for the Car and Sign classes. Therefore, it is important to explore more effective 3D shape descriptors. Finally, our segmentation algorithm can be used to develop a fast hand-labelling tool, which can provide us with additional labelled data sets.
Footnotes
8. Acknowledgements
We thank the University of Washington for the hand-labelled data set. This work was partially supported by Grant No.BK2011563 from the Natural Science Foundation of Jiangsu Province and Grant No.61100111 from the Natural Science Foundation of China.