
Abstract
We studied the effect of family control on the characteristics of small- and medium-sized enterprises located in the Northern Italian province of Bergamo. The analysis included aspects such as demographic characteristics, cost and productivity of labour, financial ratios, and the performance of 745 SMEs. Family-controlled firms emerged as a predominant organizational type in almost all the industries and a number of relevant differences were found between family-controlled and non-family firms. In sum, family-controlled firms in our sample outperformed their non-family counterparts in terms of return on sales, return on equity and return on assets.
1. Introduction
Very many firms around the world are run by families [1]. In the U.S., research has shown that family businesses account for 90–98% of all businesses, employing over half of the workforce, creating over half of all new jobs and generating 12–49% of the national GDP, according to different definitions [2]. La Porta et al. [3] also proved that on average families control respectively one third and 45% of the large- and medium-sized publicly traded firms around the world. This evidence sheds light on the important role families play in organizations, as also demonstrated by the fast growth of the literature on family firms [4].
Family business researchers commonly believe that family firms are different [5,5,6],[48,48,49],[51] because of the intersection of two separate systems, i.e., the family and the business. Several studies report that family businesses have different characteristics from non-family firms in terms of goals (e.g., [8]), financing and investment decisions (e.g., [9,9,10]), sources of competitive advantage [12], innovation investments [13] and performance (e.g., [14,14,15]). However, most of the studies focus on big firms, mostly because this is where data are available and information about the family effect on small and medium enterprises' (SMEs) characteristics appears still to be underdeveloped [17].
This paper provides exploratory results from an ongoing research project developed at the Center for Young and Family Enterprise (CYFE) at the University of Bergamo, whose aim is to build a permanent observatory on small- and medium-sized family firms located in the province of Bergamo, in Northern Italy. Specifically, this study aims to define the relevance of family control in the firms situated in this important economic area, and also to identify the main differences and communalities emerging between family-controlled and non-family firms.
In our study, family-controlled firms are found to be predominant in almost all the industries included in the analysis. When compared to non-family firms, family-controlled firms display a lower organizational size although they are older on average, and the results also showed that family-controlled firms are disadvantaged in terms of workforce motivation and productivity. From a financial point of view, few differences are detected between family-controlled and non-family firms, but the former display on average a higher financial independence. Finally, our study shows that family-controlled firms outperform their non-family counterparts in a number of performance indicators, supporting the idea that the interaction between the family and the business systems leads to the creation and conservation of a unique bundle of resources that can be the source of a firm's competitive advantage [18,18].
The structure of the paper is as follows. Section 2 defines the concept of ‘family-controlled firm’. Section 3 describes the research method and the measures adopted in the study. Section 4 presents the regression analysis and the research findings. Section 5 discusses the empirical evidence found in light of the existing literature. Finally, in Section 6 some conclusions are drawn, the limitations of the study are discussed and directions for future research are outlined.
2. Definition of Family-Controlled Firm
One important issue in family business research concerns defining what is meant by the term ‘family business’ [20]. The family business literature provides a number of different definitions of family firm [21] and it is largely proved that the way in which family firms are defined has a big impact on the studies' conclusions [22]. According to [12], the family business can be modelled as a “metasystem” involving three subsystems: the controlling family, the business entity and the individual family members involved in ownership and/or management. We based our classification between family-controlled and non-family firms on ownership and management criteria [23,23].
Accordingly, we define a ‘family-controlled firm’ (FCF) as a firm that meets one of the two following criteria: (i) a firm where family ownership exceeds 50% of total equity and family members play active roles in the board of directors and/or top management; (ii) a firm where the ownership of a group of families exceeds 50% of total equity and where members of these families play active roles in the board of directors and/or top management.
On the other hand, we define as ‘non-family firms’ (NFFs) those companies that do not meet any of the above-mentioned criteria. For example, we consider non-family firms such firms owned by individuals, by a group of partners not linked by kinship relationships, or by other corporations not traced back to an owning family.
3. Research Method
We collected data on SMEs located in the area of Bergamo from the public database AIDA (Italian Digital Database of Companies). Out of the 7,337 companies registered within the AIDA database that are located in the province of Bergamo, we focused our study on the small and medium enterprises by adopting the European Commission's definition of SME, i.e., we selected firms ranging from 10 to 250 employees and with total revenues between 2 and 50 million Euros. Furthermore, we limited our sample to those firms operating in industries located between the 10 and the 51 two-digit US SIC codes (i.e., we excluded retail trading, financial, real estate and other services, and public administrations). This procedure led us to a final sample comprising 745 SMEs.
For each firm, we calculated family ownership as the sum of the equity shares held by people that belong to a single family or to a narrow group of families. AIDA database reports for each company the name and the family name of each shareholder, and the related ownership share, so that we were able to identify the kinship relations among shareholders on the basis of their family(-ies) name(s), and we identified an owning family when at least two shareholders had the same family name. This approach implies a narrow definition of ‘family’, because it does not take into consideration extended kinship relationships between people with different family names [25]. Nevertheless, we partially obviated this issue by also considering the case of shares held by a narrow group of families, i.e., we considered up to three different families as a single one when each family name was associated to more than one shareholder. In case a firm's equity is partially or totally owned by other companies, we went up to the owning companies' balance sheets, we calculated, if present, the indirect ownership of each family member, and added it to the total family ownership share. This procedure allowed us to measure the actual family ownership for each firm of our sample. Furthermore, the information available in the AIDA database allowed us to identify the presence of the owning family's members on the firm's board of directors and in top management.
By applying the abovementioned definition of family-controlled firm, we classified 412 out of the 745 SMEs in our sample as FCFs and the remaining 333 firms as NFFs.
Table 1 shows the distribution of the 745 SMEs in our sample by two-digit SIC industry code. Family-controlled firms appear in 26 out of the 30 industries represented in this study (87%), indicating that they operate in a broad array of industries. In addition, these firms are predominant in almost every industry: non-metallic minerals, heavy construction, food products, lumber and wood products, stone, clay and glass, primary metal industries, and transportation by air. On the other hand, family-controlled firms have lower representation in printing and publishing, chemical and allied products, textile mill products, industrial machinery and equipment, electronic and other electric, and electric, gas and sanitary.
Distribution of sample firms by two-digit SIC industry code

US SIC Codes, published by United Nations.
In order to explore the differences and communalities between family-controlled firms and non-family firms, we selected a pool of measurable indicators that can be grouped into four classes. The first class includes variables describing firms' demographic characteristics such as firm size and age; the second one comprises variables describing the workforce productivity and the cost of labour; the third category is made of variables describing financial indicators such as firms' liquidity, independence and capital structure; finally, the fourth class encompassed variables portraying firms' profitability in terms of return on sales, return on equity and return on assets. A brief description of each variable engaged in the study is reported hereinafter.
Firm's demographic characteristics are described by three variables. Firm size was studied in terms of revenues (expressed in million Euros) and number of employees, while firm age was measured as the difference between the year in which data were obtained (i.e., 2008) and the firm's foundation year.
Four variables describe the workforce productivity and the cost of labour. The revenues per capita were calculated by dividing a firm's total revenue, measured in Euros, by the number of employees. The added value per capita was calculated as the ratio between the economic added value, i.e., a firm's revenues less outside purchases (of materials and services), measured in Euros, and the number of employees. The cost of labour was calculated as the ratio between the total expenses for wages, measured in Euros, and the number of employees. The workforce productivity was measured as the ratio of a firm's total revenue, measured in Euros, and its total expenses for wages.
Five indicators have been constructed to measure the firms' financial characteristics. Firm financial independence index was defined as the ratio between the shareholders' equity and the firm's total assets, and it describes how much a firm relies on its own sources of financing as opposed to other sources. The accounting liquidity is a measure of the ability of a debtor to pay his debts as and when they fall due and is calculated using the following formula:

The debt/sales ratio measures the firm's financial leverage and is measured as the ratio between bank debts and net sales. The debt/equity ratio indicates the relative proportion of shareholders' equity and debt used to finance a company's assets, and is calculated by using the following formula:

Finally, the long-term debt ratio was calculated in order to describe the composition of the firm's debt, i.e., the proportion between the firm's long-term debt and the total financial debt.
Three indicators were adopted to measure the firm's profitability. Return on sales (ROS) was calculated as the ratio between the operating income and the total revenue. Return on equity (ROE) measures the rate of return on the ownership interest (shareholders' equity) of the common stock owners, and is measured as the ratio between the net income and the total equity. Return on assets (ROA) measures the success in employing assets to generate profits, independently of how it finances those assets, and is calculated as the ratio between net operating income and the total assets. Furthermore, in light of the fact that a firm's profitability can be strongly affected by the environment in which it operates, each of the performance ratios was adjusted in relation to the industry average value by applying the following formula:

where ROx′i is the adjusted value of the indicator ROx for the firm i, ROxi is the original value and
3. Analysis and Results
Two statistical methods were employed in order to test the differences between FCFs and NEFs: (i) difference of means test with analysis of variance (ANOVA), and (ii) nonparametric difference of means (Kruskal-Wallis test). Table 2 shows the difference of means tests for the FCF and NFF subsamples, and it presents the significance obtained by the ANOVA and the Kruskal-Wallis tests.
Difference of means tests (complete sample = 745)

p<0.1
p<0.05
p<0.01
FCFs appear to be smaller than NFFs both in terms of revenues and employees, although only the difference in revenues is statistically significant. FCFs are also demonstrated to be significantly older. Regarding the financial characteristics, FCFs and NFFs are quite similar in terms of liquidity and financial structure, but FCFs have slightly higher debt/sales and long-term debt ratios, and a significantly higher independence index. Family-controlled firms enjoy significantly lower revenues per capita, even if their cost of labour is similar to non-family firms. Indeed, the workforce productivity is significantly lower in FCFs than in NFFs. Finally, there is a noticeable difference in performance between FCFs and NFFs. FCFs display significantly higher returns on sales (ROS) and outperform NFFs both in terms of returns on equity and returns on assets, even if these two latter results are not statistically significant.
4. Discussion: Differences and Similarities Between Family-Controlled and Non-Family Firms
Our analysis pointed to several differences between family-controlled firms and non-family firms. We will focus our discussion only on the differences that have emerged to be statistically significant. For example, when we consider firm size we only refer to the revenues because, as shown in the previous section, the ANOVA analysis showed that the difference in the means calculated as number of employees (47,88 in NFF and 45,37 in FCF) is not significant (0.417 value in Figure 1). The first result is that, even if they are significantly older, FCFs tend to be smaller than NFFs. Consistently with that suggested by previous studies on family business, these findings (illustrated in Figure 1 in order to facilitate the discussion) suggest that family firm size can be retarded because family management tends to be reluctant to raise external funds in order to finance the firm's growth because of its fear of losing control of the business [26,26,16]. Previous research has provided analogous empirical evidence. For example, Daily and Dollinger [28] found family-owned firms significantly smaller in their sample of small and medium professionally managed manufacturing firms, and Donckels and Fröhlich [29] also found in eight European countries that the proportion of family firms is higher in the smallest firm categories. On the other hand, these results are in contrast to those found by Westhead and Cowling [16] and by Hay ward [30] in the UK.

Differences in firm size and firm age
As illustrated in Figure 2, family-controlled firms appear to be disadvantaged in all the indicators that describe the workforce conditions. In particular, FCFs show significantly lower revenues per capita and workforce productivity. This finding is consistent with the view that family employees are less likely to be evaluated on performance criteria in family firms [31], and that a high level of family influence negatively affects the fairness of human resource decision processes and outcomes [32,32]. Conversely, our results are in contrast with the belief that family firms' workers are motivated by the awareness that their managers are as dependent as they themselves are on the success of the firm [34].

Differences in workforce variables
As illustrated in Figure 3, our empirical results suggest that family-controlled firms have a significantly higher independence index than non-family firms, but the empirical findings also show that families do not control their firms with mountains of hoarded cash, as predicted by Miller and Le Breton-Miller [17], in order, for example, to avoid the risk of a loss of control. A number of authors, e.g., [24,24], have suggested that family involvement modifies a firm's financing decisions, and that FCFs are likely to display lower debt/equity ratios than non-family firms because of their risk aversion. However, other researchers argue that family firms are characterized by a higher ability to borrow (e.g., [36]) because family involvement enhances the firm's social capital [37]. Although differences in terms of the usage of debt have not emerged as statistically significant, our results suggest that family-controlled firms in our sample display a weak preference for equity rather than debt financing.

Differences in independence, liquidity and debt
Finally, we analysed the differences between FCFs and NFFs in terms of profitability. The empirical findings are illustrated in Figure 4. In accordance with other studies on SMEs (e.g., [38,38]), our results show that FCFs outperform NFFs in all the profitability ratios. This can be explained in light of two distinctive traits that typically characterize family-controlled firms, which are positive predictors of firm's performance, namely the concentrated ownership [40], and the overlap of ownership and management [41]. Still, the differences between FCFs and NFFs that emerged in our study on SMEs are lower than those acknowledged among publicly listed firms (e.g., [14,14]), adding to the insight that family firms are likely to reduce their management inefficiencies when exposed to the capital market scrutiny, and thus the positive effects of family involvement can lead to higher performance [42].
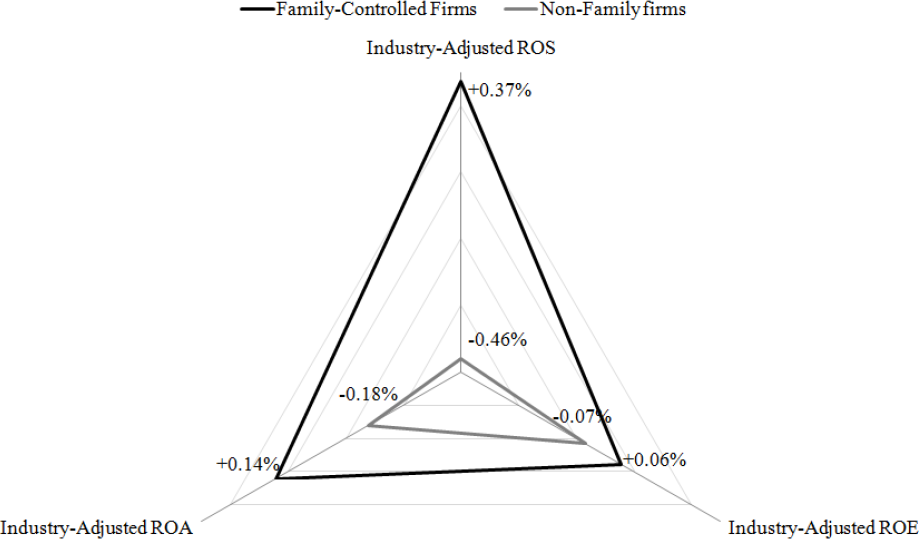
Differences in profitability
5. Conclusions, Limitations and Future Research Directions
Originally motivated by the diffused realization that families play a crucial role in understanding and predicting firm characteristics and behaviour, especially among small- and medium-sized enterprises, and that this topic has so far received scant attention in the business management research field, the permanent observatory on small and medium family firms in the Northern Italian province of Bergamo aims to build up knowledge about the characteristics and the challenges of these organizations in support of researchers, policy makers, management consultants and corporate practitioners.
In light of a number of firm limitations and capabilities typically associated with the family control in the family business scientific literature, in this study we present the exploratory results that emerged from the ongoing observatory project carried out at the Center for Young and Family Enterprise (CYFE) at the University of Bergamo, by comparing a sample of 745 family-controlled and nonfamily firms across a set of variables that describe their demographic characteristics, labour conditions, financial structure and profitability.
Statistic tests demonstrated a number of important differences between family-controlled firms and nonfamily firms. The former are found to be smaller even if older on average, and they appear disadvantaged in terms of workforce productivity, but pay lower wages. From the financial point of view, family-controlled firms are shown to be more independent and to use less debt than do non-family firms. These attributes are accompanied with significantly higher performance of family-controlled firms vis-à-vis non-family enterprises, especially in terms of their operating profit.
In summary, the results of our study provide sound evidence about the importance of family control in determining the characteristics and performance of SMEs. Nevertheless, our study suffers from a number of limitations. The empirical evidence provided in this paper is still preliminary and can be extended in terms of scope and methods, e.g., by including further intangible variables that describe both the nature of the family involvement in the businesses and its effects on the firm's characteristics, preferences and behaviours. The evidence provided here also suffers from a geographical bias, so it could be worth extending our analysis to other provinces across Italy and Europe in order to identify potential country-level factors that may affect firm behaviour and characteristics, such as the culture, and in particular, the ethnic group's inclination to organize the firm on the basis of family-based relationships, that is acknowledged to be a strong predictor of firm performance [43]. Furthermore, as several studies have acknowledged technological innovation as a determinant of sustained competitive performance [44,44,45],[47], it would be interesting to investigate the differences between family-controlled SMEs and non-family firms with respect to their innovation behaviour.