
Abstract
In this paper, we propose and develop a new real-time human respiration process analysis method using a high-time-sampling gas concentration sensor based on ultrasound. A unique point about our proposed gas concentration sensor is its 1 kHz gas concentration sampling speed. This figure could not have been attained by previously proposed gas concentration measurement methods such as InfraRed, semiconductor gas sensors, or GC-MS, because the gas analysis speeds were a maximum of a few hundred milliseconds. First, we describe the proposed new ultrasound sound speed measurement method and the signal processing, and present the measurement circuit diagram. Next, we analyse the human respiration gas variation patterns of five healthy subjects using a newly developed gas-mask-type respiration sensor. This reveals that the rapid gas exchange from H2O to CO2 contains air specific to the human being. In addition, we also measured medical symptoms in subjects suffering from asthma, hyperventilation and bronchial asthma. The millisecond level high-speed analysis of the human respiration process will be useful for the next generation of healthcare, rehabilitation and sports science technology.
Keywords
1. Introduction
In this paper, we present a newly developed high time resolution gas concentration sensing method. We use the proposed method to analyse several medical symptoms in subjects suffering from conditions such as asthma, hyperventilation and bronchial asthma. A main feature of our proposed gas sensing method is a time resolution of maximum 400 kHz. This time resolution is achieved through new mechanisms of the average molecular weight measurement method we have developed using ultrasound. The key problem was how to detect and amplify slight changes in target gas sound speed. We designed a new signal processing method and a new small chamber system to generate a continuous ultrasound stationary state for this purpose.
Changes in gas substances peculiar to the human body, such as carbon dioxide, oxygen and humidified air, play an important role in the analysis of the physical state of a human body and decreasing cerebral functions [1–8]. A typical time constant (= time resolution) for commonly used medical human respiration sensing devices, e.g., the capnograph, is about 200 msec (e.g., TG-920P Nihon Koden co.). Precise analysis of asthma patients using the capnograph was presented by You et al. [1]. They concluded that it was difficult to analyse asthma from the wave shape of the capnograph. They reported that there were slight second-order coefficient changes in the output CO2 pattern between healthy and asthma-suffering patients [1,5]. The typical gas sensing method of the capnograph adopts the measurement principle of InfraRed spectroscopy [7]. InfraRed spectroscopy cannot, however, realize high time resolution of gas sensing because of difficulties in achieving signal strength through the large background noise of the spectrum analysis of the target gas [8]. For example, it was not possible to detect a hyperventilation state [9] because of a lack of sensing capability (analysis speed) in the capnograph. Furthermore, in the field of sports training, information on oxygen uptake capability and carbon dioxide emissions is important. Because of the high speed of expiration and air intake in sports training, real-time sensing is not possible using the capnograph. In these cases, highly airtight polyester bags – called Douglas bags – are used to collect all components of exchange gases during the experiment [10]. This depends on the method of analysing the concentration of various internal gases after the end of the experiment.
In the above situation, we proposed a new gas sensing principle [2] and developed a new millisecond time resolution gas concentration sensing system (Fig. 1).
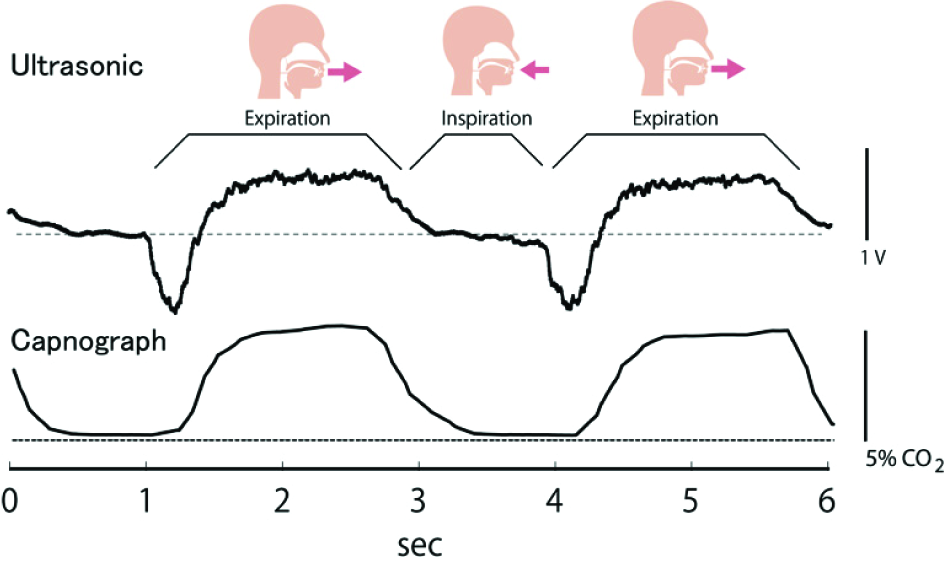
Proposed ultrasound respiration sensor (up) and medical usage respiration (capnograph) sensor output (down).
The main feature of the proposed gas sensor is the time resolution when the ultrasound frequency is 400 kHz. With this, we can achieve a 400 kHz gas concentration detection speed in the detection of ppm-level gas. In this research, we used a 1 kHz gas sampling speed for the analysis of the human respiration gas exchange process. The proposed gas sensing method can achieve a basic gas sensing speed of 400 kHz, even though with a 1 kHz sampling speed the noise level of the gas concentration sensing decreases to 1/400. This performance could not be analysed by previously proposed gas concentration measurement methods such as InfraRed, semiconductor gas sensors, or GC-MS because the gas analysis speeds were a maximum of a few hundred milliseconds [11–16]. Previously proposed gas sensor systems, such as semiconductor CO2 sensors, used a “chemical reaction” process; in contrast, our method detects the direct physical property of average molecular weight changes connected to real-time sound velocity.
In this research, we develop a new high-speed gas concentration measurement method using ultrasound and present the 1 kHz time-resolution respiratory process peculiar to human beings. This process has never been successfully examined using previously proposed gas sensing principles. Although the gas sensor uses ultrasound, the proposed method is a novel measurement principle.
2. Developed device
2.1 Sensor system
Fig. 2a shows the proposed high-speed gas concentration sensing system. Fig. 2b represents the expanded sensor assembly.

(a) Proposed signal processing unit. (b) Proposed gas sensing unit.
We made two holes diameter of 6 mm for gas flow and for ultrasound sensor. The 6 mm holes are made orthogonal. Gas flows from the upper part to the lower part. In order to make the gas flow, a small DC fan motor was installed in the sensor's lower end. The ultrasound unit used Murata manufacturing 400 kHz (MURATA MA400A1, Murata manufacturing Co.) piezo elements, and was arranged perpendicularly to the gas flow direction. The ultrasound transmitter and receiver were placed opposite each other on either side of the 6 mm gap. When a target gas was taken from the sensor's upper parts by the negative pressure of the DC fan motor (Microjet fan F1019AP-01YCV), the target gas passed through the centre of the sensor unit and was exposed to the ultrasonic wave generated by the ultrasound units. The gas was extracted via the small DC fan attached to the lower part of the sensor unit. In this respiratory measurement, 0.1 cfm gas flow velocity is used.
2.2 New ultrasound gas concentration measurement method
When ultrasound was used for measurement of acoustic velocity, viscosity, hardness, etc., the pulse wave of an ultrasound was generated in almost all cases. This method followed a principle of time of flight (TOF) [17–18]. TOF measures the differences in the time between pulse generation to detection by the receiver. Pulse attenuation presents a problem because its occurrence is influenced by external disturbances and medium. In a typical technique, when acquiring the TOF time of a pulse wave, the rising-up point of a receiving pulse wave is often used (Fig. 3a). In almost all cases, the TOF is calculated using the time where a specific voltage value of the receiving pulse is exceeded. For this reason, the attenuation of the pulse wave changes the TOF time. This phenomenon makes it difficult to measure gas concentration with sufficient accuracy using the TOF method. For example, when 1% (v/v) H2 is mixed into the air, in almost all cases the method cannot detect the difference. Regarding the time resolution, the TOF method firstly generates a pulse wave and then waits until the generated pulse wave reaches the receiver before calculating the arrival time. Another pulse wave is then generated. It is difficult to obtain a high time resolution, for example 100 msec, using this process. In addition, when measuring a small sound velocity change such as gas concentration, in order to get an average value to reduce noise in the measurement result, pulse generation must be repeated dozens of times. This means a measurement time of a second or more.
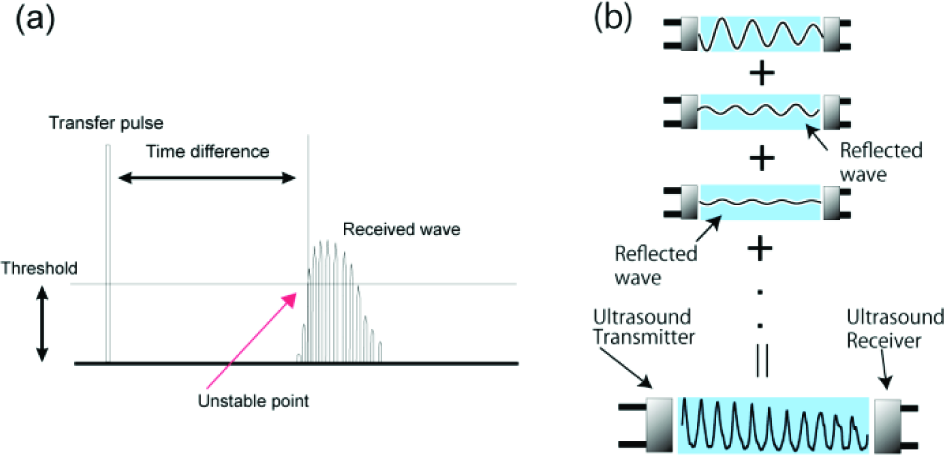
Typical gas sound velocity measurement method using ultrasound.
Another proposed method uses a continuous ultrasound as the measurement principle [19–20]. This is used mainly for investigating the acoustic velocity of substances such as metal. This measurement technique generates a stationary wave between an ultrasound transmitter and a receiver in, for example, the metal (Fig. 3b). Then, by changing the distance between the ultrasound transmitter and the receiver, the stationary wave is measured. Since peak positions according to the wavelength are observed in the stationary wave, by measuring the distance between peaks we can determine the acoustic velocity of substances. In many cases, the distance between the ultrasound transmitter and the receiver is controlled manually. The problem with this technique is that the measurement process takes time and effort. The required time resolution cannot be acquired using this principle.
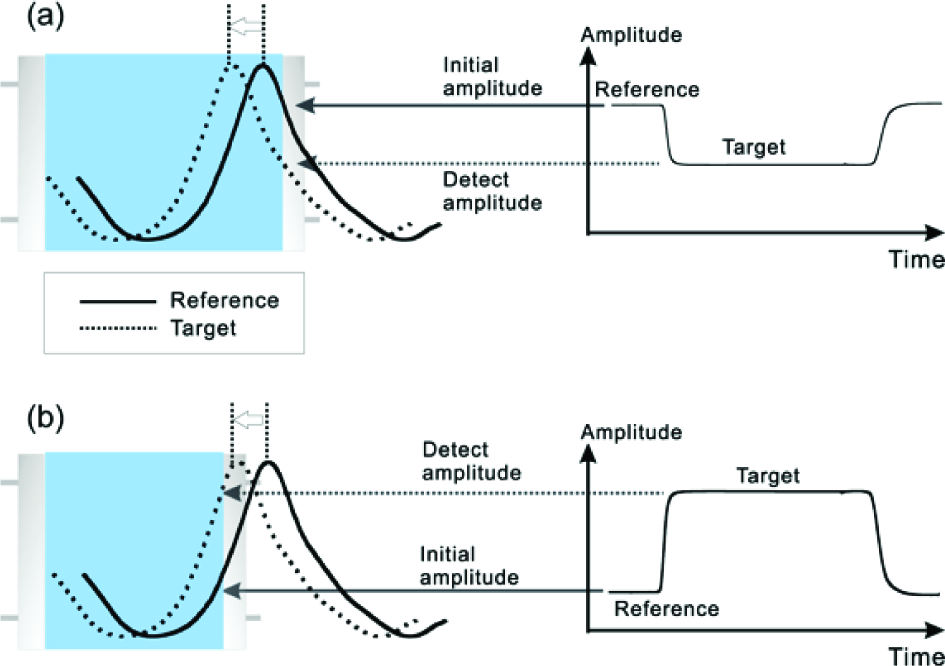
The technique proposed in this paper is a high-speed gas sensing method that shows far greater stability than the pulse method. As shown in Fig. 4, the distance between the ultrasound transmitter and the receiver is kept constant. By transmitting an ultrasonic wave from the transmitter, a stationary wave (called multiple beam interference) is generated, as shown in Fig. 3b. The peak position of this stationary wave is basically decided by acoustic velocity. If the kind of gas is changed between the ultrasound units, the acoustic velocity will be changed and the peak position of the stationary wave will also change. The graph shown in Fig. 4a shows an example of a stationary wave; the straight and dotted lines represent air and nitrogen, respectively. If the gas changes from air to nitrogen, the peak position shifts to the left. When the ultrasound unit position is fixed, the detected wave amplitude of the ultrasound receiver changes (Fig. 4a). Our proposed technique measures gas concentration using this principle.

Proposed ultrasound gas sensing method.
2.3 Device sensing mechanisms
In our proposed technique, the mechanism of reading the amplitude intensity (maximum of the absolute value of an amplitude waveform) of the stationary wave is adopted (Fig. 5). The advantage of this technique is that the time resolution of the gas concentration analysis is high compared with the technique of measuring acoustic velocity in metal. On the other hand, the disadvantage is that the amplitude intensity is dependent on the initial position of the ultrasound units. Fig. 4b shows the stationary wave generated between the relative position of the receiver unit and the detected ultrasound amplitude. Since the ultrasound is stationary, if the position of the receiver is changed the received wave amplitude at the “node” becomes small, and at the so-called “anti-node” it becomes large (Fig. 4b).

Proposed gas sensing signal processing method
In order to achieve a wave amplitude that repeats small amplitude and large amplitude over time, we have developed a new signal processing circuit, as shown in Fig. 5. The signal processing flow is as follows: (1) Amplification process of a received wave. (2) Half-wave rectification circuit. (3) To calculate the maximum value of the wave amplitude as a voltage, we adopted a “peak-hold” circuit in this process. Since the proposed circuit performs real-time sampling of the “maximum value of the wave amplitude”, if 400 kHz ultrasound is used, a 400 kHz time resolution gas sensing device will, in principle, be achieved. This is our original signal processing mechanism.
The phenomenon that occurs in the case of gas concentration changes is illustrated in Fig. 6. When an ultrasound receiver is positioned as in Fig. 6a, the output voltage decreases according to the shift of the stationary wave by gas concentration change (from the solid to the dotted line). On the other hand, when an ultrasound receiver is positioned as in Fig. 6b, the output voltage increases according to the shift of the stationary wave by the same gas concentration change. In order to solve this problem, we developed a new technique to determine the suitable position of the ultrasound receiver, and implemented it using a microcomputer.
Multiple beam interference gas sensing method.
2.4 Pseudo micrometre distance control by frequency change
The node and anti-node of the stationary wave depend on the wavelength of the ultrasound, which depends on the acoustic velocity and frequency. In the continuous ultrasound method, for example with sound velocity measurement in metal, the peak position of the stationary wave is measured by moving a sensor position manually. We therefore assumed that we could regulate and control a peak position of the stationary wave by small frequency changes. In order to confirm this hypothesis, we developed an experiment set-up shown in Fig. 7.

Artificial gas experiment set-up.
In the experiment, exchange of gases is controlled by electro-magnetic valves. In addition, we connected a micromanipulator to the ultrasound receiver, enabling the adjustment of the distance between the ultrasound units. We measured the peak position of the stationary wave by changing a small frequency shift around the centre frequency of the ultrasound unit (in this case, about 398 kHz). If regulation of a peak position is possible, it will be useful in terms of control accuracy and development cost, compared to the mechanism of adjusting the distance between ultrasound units at a micrometre level. We used a centre frequency of 398 kHz and adjusted the frequency between 396 and 400 kHz. Results are described in section 3.2.
2.5 Gas sensing system by microscopic frequency control
The previous section showed that the distance between ultrasound units can be adapted to the favoured position of a stationary wave by changing the frequency of the ultrasound. In this section, the mechanism for adjusting the centre frequency is proposed. In the example, an ultrasound unit is in the position shown in Fig. 6b, and is moved to the position shown in Fig. 6a by using the principle described. The circuit diagram is shown in Fig. 8. The proposed system reads the output voltage of Fig. 5 through the A/D converter of the microcomputer H8. The D/A port is connected so that the centre frequency of 400 kHz plus/minus 30 kHz is generated by one chip function generator, XR2206. The proposed circuit first automatically changes the centre frequency of the ultrasound transmitter from 400–30 = 370 kHz to 400+30 = 430 kHz. The microcomputer measures the output voltage transition at each frequency. Next, the frequencies with the maximum (fmax) and minimum (fmin) voltage points are recorded.

Automatic peak control method.
For the frequency, an average is taken:
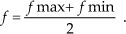
This is when the range of the output voltage is decreasing and the frequency is increasing. This calibration process – frequency control – is performed automatically before this device is used. The reason for using the place where the voltage decreases is that it is suitable for respiratory gas measurement. Section 3.3 gives a further explanation of this.
2.6 Human respiration measurement with the proposed gas-sensing device
The respiratory sensor connected to a gas mask, as proposed in this paper, is shown in Fig. 9. The direct output comparison with the capnograph used in medical equipment is shown in Fig. 1, and additional results are shown in section 3.3.

High-speed respiration gas sensor
3. Results
3.1 Result of measurement of peak position change of the stationary wave against gas concentration change
The waveform of the stationary wave when changing from 100% nitrogen gas to nitrogen gas containing 5% oxygen was measured whilst changing the distance in micrometres between ultrasound units (set-up as in Fig. 7). As shown in Fig. 10, when the concentration of gas was changed the peak position of the stationary wave observed the shift. The horizontal axis plots the distance between ultrasound units and the vertical axis plots the output voltage when the distance between the ultrasound units is changed from 3000 to 3800 micrometres. We can find there is a peak position shift of the waveform of Fig. 10 by the change of the gas concentration changes. This waveform peak shift phenomenon is the basis of our proposed gas concentration sensing mechanism. Gas concentration measurement process of the proposed gas sensor was illustrated in Fig. 6 and precise mechanism was described in section 2.3.

Distance dependency of the proposed gas sensor
3.2 Result of pseudo micrometre distance control by frequency change
For the experimental set-up shown in Fig. 7, Fig. 11 depicts the stationary wave patterns when changing the distance between the ultrasound units and, simultaneously, the centre frequency between 396, 398, and 400 kHz. The horizontal axis plots the change of the distance from the initial position (= 6 mm), adjusted by the micromanipulator, and the vertical axis plots the voltage change, i.e., the amplified output of the proposed signal-processing unit. Fig. 11 shows that the peak positions of the stationary wave change with the frequency changes. Three arrowheads represent the peak position of each frequency, respectively. In addition, the graph shows that the displacement of the arrowheads is linearly changed by the frequency changes. From this result, even if the position of the ultrasound unit cannot be physically adjusted, a peak position is controllable by adjusting the centre frequency.
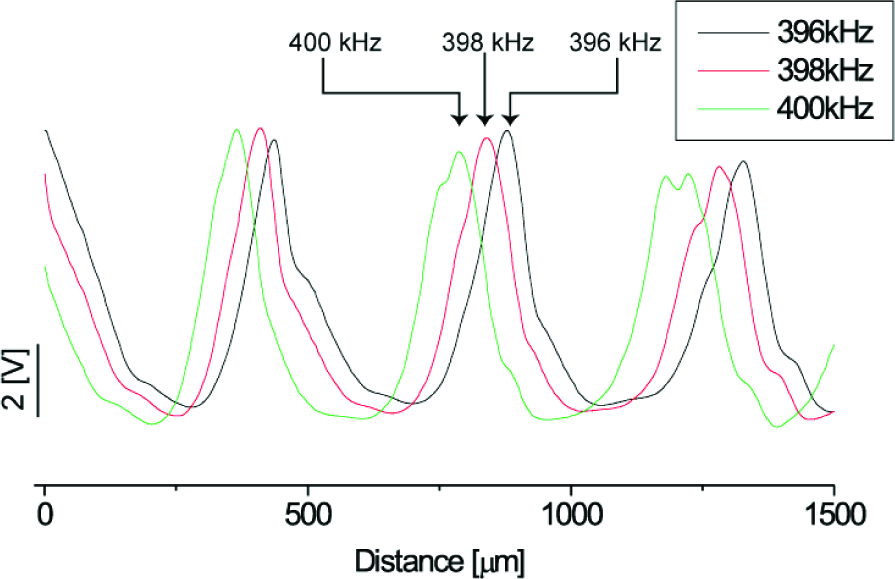
Frequency dependency of the proposed gas sensor.
3.3 Result of human respiration measurement
The results of the human respiration waveform measurements carried out on five subjects are shown in Fig. 12. The vertical axis shows the output of the proposed sensor and the horizontal axis shows the time. The dotted line shows the acoustic velocity of the air; if the voltage is decreasing it is plotted below from the dotted line, which means the target gas acoustic velocity is exceeded by the acoustic velocity of the air. In this case, the average molecular weight of the target gas is light compared that of the air. However, if the voltage is increasing it is plotted above the dotted line, which means the reverse. In this experiment, we set the voltage change to correspond to the average molecular weight change in the human respiration process.

Normal respiration patterns of five subjects
Typical male and female expiration waveform examples are shown in Fig. 12, although, when compared with the waveform of the medical respiratory sensor (see Fig. 1 above), the expiration waveform is measured with high time resolution. Since the dotted line shows the average molecular weight of the air, we find the voltage shifts down when the expiration phase is started, and then increases, moving away from the air line. The voltage decreasing shows that the average molecular weight of the gas is lighter than air. Another of our experiments investigated “humidified air” [21–23]. At 20 degrees Celsius, the average molecular weight of the humidified air was calculated thus: 18.0 (H2O) × 0.023 (mixed rate of humidified air) + 28.97 (Air) × (1-0.023) = 28.71. However, the average molecular weight of air at 20 degrees Celsius is 28.97, and the average molecular weight of humidified air is therefore smaller than that of air. Since it is assumed that there is no gas exchange function from the lung to mouth, when expiration gas is pushed out by the diaphragm, humidified air existing from the lung to the mouth firstly flows out; then, 5% carbon dioxide gas flows out. The average molecular weight of this air was calculated thus: 44.01 × 0.05 (5% CO2) + 28.97 (air) × 0.95 = 29.72. This is heavier than air (28.97).
Fig. 13 shows results from subjects with conditions such as asthma, hyperventilation, and bronchial asthma. We measured this waveform in experiment of aerobic exercise on bicycle (hyperventilation, Fig. 13a), the waveform of a student in our laboratory who is an asthmatic (asthma, Fig. 13b), and the waveform of a student in our lab who had caught a severe cold (bronchial asthma, Fig. 13c). Although a medical treatment guarantee is not yet possible, measuring these waveforms in a high time resolution is a good start.

Hyperventilation, asthma, and bronchial asthma patients
(a) Hyperventilation
The result shown in Fig. 13a was obtained in the aerobics experiment. The subject enters a state of hyperventilation. Almost no portion of the line falls below the dotted line that indicating air (the dotted line is the voltage of our proposed gas sensor when there is only air in the sensor unit). Since the output voltage takes above value compared with the dotted line, the respiration gas contain a lot of carbon dioxide even if it is the timing of pushing out the gas between the lung and the mouth. This results show that it cannot denote good breathing. Furthermore, the respiration rate is between two and three times faster. From Fig. 13a, 0.92 sec (standard deviation [S.D.] is 0.075 sec, N=18) was the calculated respiration rate. A normal respiration rate in the same subject is 1.89 sec (S.D. is 0.06 sec, N=20) in a healthy state (Fig. 13a). In this time resolution range, previously proposed respiration sensors such as the capnograph cannot detect real-time gas concentration changes.
(b) Asthma patient
Fig. 13b shows the respiration pattern of an asthma patient. The part of the line extending below the dotted line takes the lower voltage and the area is large compared with normal respiration process (the lower voltage compared with dotted line means only humidified air is existed), and there is significant time taken for the change to carbon dioxide. Although further, more detailed analysis is required, the waveform shows that enough carbon dioxide cannot be exhaled during expiration.
(c) Bronchial asthma
Fig. 13c shows the waveform of a bronchial asthma patient. Throat inflammations cause bronchus to narrow, and with a sharp voltage change it seems that the humidified air is pushed out rapidly. Furthermore, it the change in the concentration of carbon dioxide is not stabilized compared with a patient breathing normally.
More precise analysis will be needed for medical guarantees; however, it seems that the detailed waveform measurement with a 1 kHz sampling rate, which could not have been obtained by previously proposed respiration sensing devices, is useful as a starting point for more detailed analysis of the human respiration process.
4. Discussion
For precise gas concentration measurement, calibration of the output voltage is needed. Fig. 14 illustrates a sample of our proposed gas sensing control by microscopic frequency control, as delineated in section 2.5. If we use the centre frequency as average frequency f=(fmax+fmin)/2, basically the voltage dependency for the gas concentration is linearly changed, especially with small gas concentration changes when the ultrasound units are positioned as in f=(fmax+fmin)/2 (for example, the grey area in Fig. 14). The reason for adopting the average frequency is that the phenomenon of output voltage change against gas concentration change is close to a transistor amplifier process. Fig. 15 shows a class A amplifier mechanism using a transistor. In this case, since the input signal is biased by a static voltage (ex. 0.7V) and this bias shifts the operation point, amplified output voltage is changed almost linearly in this operation point. Our proposed calibration mechanism uses the same process by comparing the centre frequency shift with the bias voltage shift of the class A amplifier. In addition, if we use another frequency of the ultrasound, we can control how much voltage is changed against the peak shift of the stationary ultrasound wave. In this case, if we use the low frequency ultrasound, since the distance between the peak positions is large, the voltage change slope against the gas concentration change will decrease and the linearly detectable range of gas concentration will extend by the slope becoming less steep. At the same time, if we use the high frequency ultrasound, the detectable range of gas concentration will narrow, while gas concentration detectability or sensing performance will increase because of the change in the slope of the stationary wave (see Fig. 16).

Proposed gas sensing calibration process. The horizontal axis represents the centre frequency of the ultrasound; the vertical axis is the output voltage of the fixed position of the ultrasound units.

Class A amplification diagram of transistor. By shifting an input bias, the voltage amplitude process is close to linear since the operation point shifts by the bias voltage.

Detectable range and sensitivity control of proposed sensor. (a) High centre frequency. Grey area shows a linear region at an average frequency f. (b) Low centre frequency case. The grey area is larger than the high frequency case and the gas sensitivity is decreased by the frequency change.
5. Conclusion
In this paper, a new gas concentration measurement principle using ultrasound was proposed and new hardware was presented to successfully monitor gas concentration in milliseconds. By the proposed method, the transmitter and the receiver of ultrasound are arranged opposite each other and a stationary wave is generated between them using continuous ultrasound. Gas concentration is measured using the shift of the peak position of the stationary wave according to the change in gas concentration. A mechanism to adjust the centre frequency by using a microcomputer was presented, which can regulate the peak position of the stationary wave. The peak position of the ultrasound stationary wave can be controlled in order to increase the output voltage where the velocity of sound decreases (i.e., the average molecular weight of the gas increases) and decrease the output voltage where the velocity of sound increases (i.e., the average molecular weight decreases). This control means we can obtain a large molecular weight as a high voltage value and a small molecular weight as a low voltage value, as compared to air. Using the proposed device, subjects' hyperventilation, asthma, and bronchial asthma were successfully detected through the real-time gas analysis that would not have been possible with standard respiration gas sensors. More precise analysis will be needed to provide medical guarantees; however, our 1 kHz sampling rate waveform will be useful for the analysis of reduced expiration because of medical problems, which previously could not be measured.
Footnotes
6. Acknowledgments
This research was partially supported by the Ministry of Education, Science, Sports and Culture, Grant-in-Aid for Young Scientists (B), 2010, 22700166.