
Abstract
On the basis of the increased emphasis placed on the protection of privacy, biometric recognition systems using physical or behavioural characteristics such as fingerprints, facial characteristics, iris and finger-vein patterns or the voice have been introduced in applications including door access control, personal certification, Internet banking and ATM machines. Among these, finger-vein recognition is advantageous in that it involves the use of inexpensive and small devices that are difficult to counterfeit. In general, finger-vein recognition systems capture images by using near infrared (NIR) illumination in conjunction with a camera. However, such systems can face operational difficulties, since the scattering of light from the skin can make capturing a clear image difficult. To solve this problem, we proposed new image quality enhancement method that measures the direction and thickness of vein lines.
This effort represents novel research in four respects. First, since vein lines are detected in input images based on eight directional profiles of a grey image instead of binarized images, the detection error owing to the non-uniform illumination of the finger area can be reduced. Second, our method adaptively determines a Gabor filter for the optimal direction and width on the basis of the estimated direction and thickness of a detected vein line. Third, by applying this optimized Gabor filter, a clear vein image can be obtained. Finally, the further processing of the morphological operation is applied in the Gabor filtered image and the resulting image is combined with the original one, through which finger-vein image of a higher quality is obtained.
Experimental results from application of our proposed image enhancement method show that the equal error rate (EER) of finger-vein recognition decreases to approximately 0.4% in the case of a local binary pattern-based recognition and to approximately 0.3% in the case of a wavelet transform-based recognition.
1. Introduction
With the arrival of an information-oriented society, the importance of information security has increased significantly. Traditional technologies for user authentication depend upon personal identification numbers, passwords or tokens; however, these face certain disadvantages in that passwords can be divulged and tokens can be stolen. Biometric recognition has, therefore, become an alternative means of solving security problems. Biometrics is the technology of recognizing individuals by using human physiological and/or behavioural characteristics, including facial features, fingerprints, iris patterns, voice prints, vein patterns and gait. Biometric solutions need to satisfy the conditions of universality, distinctiveness, permanence and collectability. Other factors to be considered include performance, acceptability and circumvention [1].
Biometric finger-vein recognition involves the scanning of vein patterns within a finger, a method that is advantageous in that it utilizes a small and inexpensive capturing device, is robust to differences in finger skin condition (e.g., dry, wet or scarred skin) and is difficult to falsify [2-8]. However, recognition performance can be affected by variations in vein thickness owing to temperature and physical conditions [4] as well as by the quality of the captured finger-vein image. The quality of this image can be degraded by variations in illumination and camera sensor conditions, optical blurring and other blurring caused by light scattering on the skin. To address these limitations, studies on image enhancement have been previously conducted.
These previous studies can be classified as research into software algorithm-based methods [6-11, 17] and hardware-based methods [12]. In turn, the software algorithm-based methods can be classified as non-restoration-based methods [6, 7, 10, 11, 17] and restoration-based methods [8, 9].
As a non-restoration-based method, Zhang et al. proposed a finger-vein image enhancement method combining grey-level grouping and the use of a circular Gabor filter [6]. However, in applying the filter, they did not consider blood vessel direction, which limited the image enhancement they were able to obtain. In addition, although they produced enhanced image samples, they did not document the degree to which their enhancement method improved finger-vein recognition. Yang et al. proposed an enhancement method using a multi-channel Gabor filter [7] and an orientation field [10]. In their study [7] the multi-channel Gabor filter, which used various directions and frequencies, enhanced the finger-vein image without determining the specific direction and width of the vein upon which it was applied. Although image enhancement was carried out using an orientation field based on vein line characteristics determined by previous research [10], they did not document how well performance was enhanced in their study. Yu et al. proposed a finger-vein enhancement method based on a multi-threshold fuzzy algorithm [11]. Pi et al. proposed a finger-vein imaging quality enhancement method using an edge-preserving filter, an elliptical high-pass filter and histogram equalization [17]. Most of these non-restoration based methods [6, 7, 10, 11, 17] do not consider the characteristics of vein lines, such as the direction and width of the imaged vein lines, and none of them measured performance enhancements in terms of the accuracy of finger-vein recognition, even though this is an important final goal in developing an enhancement algorithm.
As a restoration-based method, Yang et al. proposed the restoration method of a finger-vein image based on the skin layer structure [8] in which scattering blur was removed [9]. In their studies, blurred finger-vein images were efficiently restored using a model of estimated blurring; however, and as with some of the non-restoration-based studies above, vein line direction and width were not determined during restoration and image enhancement was limited. Additionally, they also did not document any enhancement of accuracy achieved through their method.
As a hardware-based method, Crisan et al. proposed image enhancement using a polarizing filter [12]. Again, the direction and width of the vein lines were not analysed and recognition accuracy enhancement was not documented. Nguyen et al. proposed a quality assessment method of finger-vein imaging; however, this did not involve the use of an image enhancement method [18]. To improve upon and augment the previous work, therefore, we propose a novel image quality enhancement method that determines both the vein line direction and its thickness. Since vein lines are detected in an input image based on eight directional profiles of a grey image (as opposed to a binarized image), the detection error caused by the non-uniform illumination of the finger area can be reduced. The optimal Gabor filter direction is adaptively determined on the basis of the estimated direction of the detected vein line, and the optimal Gabor filter width is adaptively determined on the basis of the vein line thickness. By applying a Gabor filter with direction and width optimized in terms of the detected vein line, a clear vein image can be obtained. Additional processing through a morphological operation is applied to the Gabor filtered image and the resulting image is combined with the original one to obtain a higher quality finger-vein image. We were able to use our proposed image enhancement method experimentally to reduce the equal error rate (EER) in finger-vein recognition. Table 1 summarizes the comparison between the previously studied methods and our proposed quality enhancement method.
Summary of comparisons between the previous works and the proposed method

2. Proposed finger-vein image enhancement method
2.1 Overall procedure
An overview of our proposed finger-vein image enhancement method is shown in Figure 1. Figure 2 shows a flow diagram of the method. Our proposed method can be divided into five steps. First, an input image is processed using four of directional Gabor filters. Second, vein lines are detected on the basis of eight directional grey profiles of the image. Third, the image is enhanced using an optimal Gabor filter, with width and direction determined using the detected vein line. Fourth, the additional processing of a grey morphological operation is executed to reduce noise. Finally, the original and processed images are combined using a weighted SUM rule to obtain an enhanced final image.

Overview of the proposed finger-vein image enhancement method.

Flow chart of the proposed finger-vein image enhancement method.
2.2 Finger-vein image enhancement method
2.2.1 Image enhancement using four of directional Gabor filters
A finger-vein image is composed of vein lines of various widths. In the study described in this paper, grey profile analysis was used to determine the vein line direction. This is in contrast with the previous research, in which binarization-based methods for detecting vein lines were used [19]; however, the binarization performance is affected by the selection of an optimal threshold, a process that is made difficult by illumination variation over the finger area. Prior to the detection of the vein lines in our method, four of directional Gabor filters are applied in order to enhance the finger-vein image, as shown in Figure 2. A Gabor filter is a two-dimensional filter that can be represented using [7, 13]:
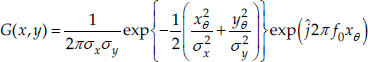
where:
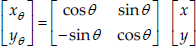
and ĵ = √–1, θ is the orientation of the Gabor filter, f0 is the centre frequency of the filter and σx and σy are the sigma values of the Gaussian envelopes along the x- and y-axes, respectively [7]. In order to reduce the processing time, an even-symmetric Gabor filter – which used only the real part of the Gabor filter output – was used in this study [7]:
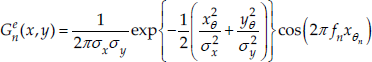
where n (=1, 2, 3, 4) is the channel index, θn(=nπ/4) is the orientation and fn denotes the centre frequency of an even-symmetric Gabor filter in the nth channel. By using the convolution of the input image I(x, y) with the even-symmetric Gabor filter Gne(x,y), an output image On(x, y) was obtained as follows [7]:

where * denotes the convolution operator. In this study, four Gabor filters with directions of −45°, 0°, 45° and 90° were used. At each point, the minimum value of the obtained amplitude was selected as the best matching result of Gabor filtering. This was done because vein lines have a lower grey value than the neighbouring skin; therefore, the grey profile of a vein line represents a reflection of the Gabor filter profile around the vertical axis. The final output image was obtained on the basis of this filtering. Figure 3 shows the results of processing the image through the four of directional Gabor filters.

Results from the four of directional Gabor filters: (a) input image, (b) image result using a −45° Gabor filter, (c) image result using a 0° Gabor filter, (d) image result using a 45° Gabor filter, (e) image result using a 90° Gabor filter, and (f) final output image from the four of directional Gabor filters.
2.2.2 Image enhancement using one optimal Gabor filter and a grey morphological operation
In the next step, an optimal Gabor filter with direction and width determined by the detected vein line was applied and the further processing of a grey morphological operation was executed, as shown in Figure 2. This step was divided into six sub-steps:
(Step 1) Extracting eight grey profiles which are orthogonal to the vein lines of eight directions (-67.5°, −45°, −22.5°, 0°, 22.5°, 45°, 67.5° and 90°), respectively, at each position while scanning in the horizontal direction.
(Step 2) An average filter was used to smooth the extracted profiles.
(Step 3) Each profile was checked to see whether it corresponded to a specific vein line.
(Step 4) Determining the direction of the vein line whose depth of profile is deepest and selecting the corresponding direction of the Gabor filter.
(Step 5) Selecting one optimal Gabor filter whose filtered value is minimized (best matching) among the Gabor filters of various widths and obtaining the result image based on the minimum filtered value at each position.
(Step 6) Applying a grey morphological operation to the result image and combining it with an input image as the final enhanced image.
First, grey profiles orthogonal to the vein lines in eight directions were extracted by scanning each image point in a horizontal direction. Because the grey level of the vein line is lower than that of the non-vein area, such as skin, a “vein section” of an image will form valleys in the grey level function; this is illustrated in Figure 4. The grey profile closest to being orthogonal to the direction of the vein will produce the deepest valley, as shown in Figure 4 (d). On the basis of this comparison, the direction of the vein can be estimated. Figure 4 shows an example of the profiles extracted at a point within a finger-vein image.

Examples of grey profiles orthogonal to the vein lines in eight directions. In each figure, the horizontal and vertical axes represent the pixel position and the grey value, respectively. The dotted lines show the direction of the measured grey profiles and the solid lines represent the vein line directions orthogonal to the grey profiles. (a) is the original finger-vein image from which the direction of the vein line is to be measured (red-coloured box). The vein directions are (b) −67.5°, (c) −45°, (d) −22.5°, (e) 0°, (f) 22.5°, (g) 45°, (h) 67.5° and (i) 90°.
As shown in Figure 4, the profiles produced some noise, making analysis difficult. To remove the profile noise, an average filter was applied, as shown in Figure 5.

Example of the smoothing of profiles from Figure 4 using an average filter. In each figure, the horizontal and vertical axes denote the pixel position and the grey value, respectively. The vein directions are (a) −67.5°, (b) −45°, (c) −22.5°, (d) 0°, (e) 22.5°, (f) 45°, (g) 67.5° and (h) 90°.
Each smoothed profile was then checked to see if it belonged to a vein line on the basis of the following conditions:


where Lmax denotes the maximum grey value on the left-hand side of the profile, Rmax is the maximum grey value on the right-hand side of the profile, Vmin denotes the minimum grey value of the entire profile and Vavg = (Lmax +Rmax)/2. In both Figs. 4 and 5, the “left side” of the profile is the horizontal position from 0 to C and the “right side” extends from C to the end position. C denotes the central horizontal position of the profile. If more than two grey profiles satisfy the conditions of Eqs. (5) and (6), then only the profile for which Vavg – Vmin is the largest is selected. On the basis of this, the vein line is determined as lying in the direction orthogonal to that of the profile. Figure 6 shows a vein line that was detected using this method.

Vein line detected using a grey profile (a) finger-vein image, (b) detected vein lines by orientation.
If, in checking whether the profile belonged to a vein line all of the conditions of Eqs. (5) and (6) were not satisfied, the current pixel was skipped and the same procedure was applied at the next pixel in the horizontal direction. If all of the conditions of Eqs. (5) and (6) were satisfied, Step 3 – in which the corresponding direction of the Gabor filter was selected – was then carried out. In general, finger-vein images consist of bright regions (skin) and dark regions (veins). As such, the profile with the deepest grey profile valley will be the one closest to orthogonal to the direction of vein. Therefore, the direction (θ in Eq. (3)) of the appropriate Gabor filter can be assumed to be orthogonal to the detected vein. Typically, enhancement performance will be degraded if the vein width is not determined. Therefore, vein line widths were extracted. As the direction of the Gabor filters had already been determined, an optimal Gabor filter with a “best matching” (optimized) width value (σx in Eq. (3)) among the various filters could be found. This was possible because vein lines have lower grey values than the neighbouring skin; thus, the grey profile of a vein line is a reflection around the vertical axis of the corresponding Gabor filter profile. Assuming that the width of this Gabor filter is the same as that of the vein in the direction of the vein, the calculated value of the Gabor filter at the vein position will be minimized. From these values, the result images were obtained at each point. Next, grey morphological operations (e.g., opening or closing) were applied to the filtered image in order to reduce the error in the filtered image. Finally, in Step 6, the result image was combined with the original input image based on a weighted SUM rule applied at each pixel position, as in Eq. (7):

where Imorph(x, y), Iinput(x, y) and Ifinal(x, y) are the result images from the morphological operation, the input image and the final enhanced image, respectively. The optimal weights w1 and w2 were experimentally determined.
3. Finger-vein recognition
With the enhanced image, finger-vein recognition was performed [14, 18]. Because the size and shape of each finger is different, size normalization was performed on segmented finger regions within the input image using boundary detection masks by stretching the regions into rectangular shapes originating at the X- and Y-axes. This size-normalization was used to form a 150×60 pixel rectangular image [14, 18]. Next, sub-sampling was executed in order to reduce the size of the normalized image to 50×20 pixels [14, 18]. This was done to improve the processing time and to make feature extraction more efficient. From the resulting sub-sampled image, feature codes for finger-vein recognition were extracted using a local binary pattern (LBP) [14, 18]. As the LBP used the extracted local features, the method was robust in relation to illumination variation. The operator used is defined in Eq. (8) and demonstrated in Figure 7 [14, 18]:
Extracting finger-vein codes using an LBP operator.

The LBP operator extracts the features of finger-veins as binary codes by comparing the centre pixel value (ic in Eq. (8)) with its neighbouring pixel values (in in Eq. (8)). For this study, an LBP operator with a 3 × 3 pixel block was used; (xc, yc) in Eq. (8) represent the centre position of the 3 × 3 pixel block. As shown in Figure 7, an 8-bit code was extracted from each block, resulting in a total binary code size of 6,912 (48 × 18 × 8) bits used for each sub-sampled image of 50 × 20 pixels.
A modified census transform (MCT) originating from the census transform has been widely used in image texture analysis. The main difference between the LBP and the census transform (MCT) is as follows. In the case of the MCT, the comparisons between the neighbouring pixels and the average value of all the pixels inside the mask are performed [20] whereas the comparisons between the neighbouring pixels and the centre pixel are performed in the case of the LBP. As such, in each 3 × 3 mask, the code of 9 bits is obtained in the case of the MCT whereas the code of 8 bits is acquired in the case of the LBP. For example, with Figure 7, the average value of all the pixels inside the 3 × 3 mask is 101 ((95+98+89+104+100+101+110+94+120)/9). Since the grey value of the left uppermost position is 95 and it is smaller than the average value (101), the code of the left uppermost position becomes 0. Since the grey value of the right lowermost position is 120 and it is greater than the average value (101), the code of the right lowermost position becomes 1. Since the grey value of the centre position is 100 and it is smaller than the average value (101), the code of the centre position becomes 0. Using these finger-vein codes, a hamming distance (HD) was calculated to characterize the dissimilarity between two finger-vein images [14, 18]:

where Code A and Code B are the finger-vein codes of the input and enrolled images, respectively; N is the size of the finger-vein code; and ⊗ is the Boolean exclusive OR operator. A low HD implies a high correlation between two images; conversely, a high HD implies a low correlation [14, 18]. To confirm that the proposed image enhancement method could be implemented with various recognition algorithms, a wavelet transform was used as a second method to extract global finger-vein features [14-16]. For this, a Daubechies wavelet was chosen from among the various types of wavelet transforms. Through first-level decomposition, 4 sub-regions were obtained from the original image, characterized by low-frequency components in both the horizontal and the vertical directions (LL); high- and low-frequency components in the horizontal and vertical directions, respectively (HL); low- and high-frequency components in the horizontal and vertical directions, respectively (LH); high-frequency components in both the horizontal and vertical directions (HH) [14-16]. Through third-level decomposition, 64 sub-regions were obtained. Each pixel value was normalized based on min-max scaling. Two features (the measured mean and standard deviation) were obtained from each sub-region, resulting in a total of 128 features (64 sub-regions × 2 features per sub-region). These features were used to calculate the Euclidean distance between the input and the enrolled images.
4. Experimental Results
For the experimental part of this study, we collected a database consisting of 3,300 finger-vein images [14, 18]. These consist of 10 finger-vein images per finger for ten fingers each from 33 individuals. All of the images were captured with a lab-made device using a timed interval control and the resolution of each image was 640 × 480 8-bit grey level pixels [14, 18]. On the basis of a cross-validation scheme, the database was divided into two sub-databases: “learning” and “testing”. The learning database was composed of 1,700 finger-vein images from 17 individuals and the testing database consisted of 1,600 finger-vein images from the remaining individuals. In order to enhance the confidence level of the experiments, these division procedures were iterated four times by altering the sub-databases randomly and the average value of four recognition accuracies was obtained. The reason why the vein images of learning (training) individuals were used is as follows. As shown in Eq. (7), the optimal weights (w1 and w2) should be determined in this research and the learning database was used for determining the optimal weights. With the test vein images of the remaining individuals (the testing database), the accuracies of finger-vein recognitions were measured based on a verification mode, with the results shown in Figure 9. Figure 8 shows the results of finger-vein image enhancement using the proposed method. As can be seen, the resulting images generated by the proposed method are clearer than the original images.

Results of the proposed enhancement method: (a) the original image, (b) the result image.

Comparisons of the average ROC curves of four testing sub-databases.
Figure 9 shows the average receiver operational characteristic (ROC) curves for the finger-vein recognition assessment performed here using both the original and the enhanced finger-vein images. By using the proposed method, the EER of the LBP algorithm was reduced from approximately 3.3% to approximately 2.9%, while the wavelet transform EER was reduced from approximately 17.8% to approximately 17.5%. The EER represents the error rate when the false acceptance rate (FAR) is the same as the minimum value of the false rejection rate (FRR) [14, 18]. The FAR gives the rate of the false acceptance of unregistered finger-vein images as registered, while the FRR gives the rate of the false rejection of registered finger-vein images [14, 18]. The genuine acceptance rate (GAR) is then calculated as 100 – FRR (%) [14, 18]. From Figure 9, we can confirm that the performance of finger-vein recognition was improved by using the proposed enhancement method, irrespective of the recognition algorithm.
In addition, we performed additional experiments to compare our algorithm to the previous method. The previous method used multi-channel Gabor filters in order to enhance the finger-vein image [7]. When we measured the accuracies of the previous method [7], the centre frequency and bandwidth for the Gabor filter were determined as 0.125 and 2.5, respectively. As shown in Figure 9, the experimental results showed that the accuracy of the proposed method was better than that of the previous method.
In the last experiment, we measured the processing time of the proposed method on a desktop computer (CPU of 3.3 GHz and 8 GB RAM) and the results are shown in Table 2.
Processing time of the proposed method (unit: ms)

5. Conclusion
In this paper, we proposed a novel blood vessel image enhancement method using the prediction of vein line direction and width. Our experimental results showed that this proposed method could produce clear vessel images through the prediction of the direction and the width of a blood vessel, thereby improving the performance of finger-vein recognition. In future work, we plan to study means of combining quality assessment and quality enhancement in order to enhance the speed and accuracy of finger-vein recognition.
Footnotes
6. Acknowledgments
This research was supported by Basic Science Research Program through the National Research Foundation of Korea (NRF) funded by the Ministry of Education, Science and Technology (No. 2012R1A1A2038666), and in part by the Public welfare & Safety research program through the National Research Foundation of Korea (NRF) funded by the Ministry of Education, Science and Technology (No. 2012-0006554).