
Abstract
This paper aims to assess the environmental efficiency of refineries in the public sector with emphasis on generated effluents and water consumption in the production process. In order to conduct this research, the addressed method was quantitative with a qualitative approach to the environmental aspects of controllable and uncontrollable variables implemented in two classical models of Data Envelopment Analysis (DEA), considering only desirable outputs and two DEA models which include undesirable outputs. The sample consists of ten refineries considering the following as input variables: idleness percentage of the operating plant, the amount of water consumed; and the following as outputs: refinery production volume and generated effluents, desirable and undesirable, respectively, besides the uncontrollable variable, the refinery age. With the comparison result between the models, we observed the clear importance of the environmental variable for a more realistic analysis of the production process.
1. Introduction
Environmental issues, such as the conscious use of water and pollutant emissions reduction during the production processes, have been increasingly emphasized in the literature due to the possible exhaustion of the planet's natural source of freshwater supply and the signs that have been presented by the biosphere of the capacity exhaustion of indiscriminate absorption of residues and pollutants. Reconciling economic growth with social and environmental preservation, so-called sustainable development, is the main problem of a developing country.
The oil industry is recognized for its importance due to generated products, large participation in each country's economy sector, which generates income and jobs, and especially as one of the more environmentally impacting. The oil refineries use a large amount of water in their processes, which causes an increase in the amount of generated effluents. Reducing water consumption through the adoption of new technologies leads to economic, social and environmental benefits. Technological changes have been driven both by increasingly restrictive legislation and the industry's environmental awareness [1]. But a question mark hangs over how to achieve an increase in production, while maintaining market competitiveness and environmental compliance. In order to answer this question, the need for obtaining indicators covering all actions and consequences involved in the process arises.
From this perspective, mathematical tools are used to control production processes through the efficiency analysis used in the identification of comparative scores so that companies can diagnose their performance against competitors. To comply with the competitive market nowadays, there is a demand for reports in which the environmental variable is highlighted as well as economic variables. On the basis of [2], the undesirable outputs impact on the efficiency frontier. [3] claims that the lack of pollution control negatively affects the company valuation, which confirms [2].
Because of the diversity and complexity of the variables involved in the organizational processes, especially in the environmental dimension, [4] the use of Data Envelopment Analysis (DEA), a non-parametric approach, is recommended for environmental efficiency assessment. Based on these guidelines, we observed the evolution of DEA models to measure the environmental impacts aligned to the organization economic performance in different approaches, as noted in [5]–[9], among others. In the face of this evolution, a research problem arises: do the main environmental efficiency models help in management's decision making process?
When mapping the environmental performance context, we are faced with several studies applying DEA which consider undesirable outputs in several areas, such as logistics [10]–[12], fishing [13], agriculture [14], finance [15]–[16], industry [17]–[20], but specifically on the oil industry there are few studies on the subject [21]–[22].
The literature is lacking on studies that address the environmental efficiency of the oil industry, relating water consumption and effluent emissions. To partially fill this gap, this research has the objective to measure the environmental efficiency of Brazilian refineries, taking as input variables: the refinery idleness percentage and water consumption, desired output variable, oil production and undesirable output, the generated effluents and as an uncontrollable variable, the refinery age.
This paper is organized as follows: Section 2 systematizes the literature evolution on the undesirable outputs subject and uncontrollable variables to calculate the environmental efficiency; Section 3 presents the research method, with the DEA models, and describes the variables to be used; Section 4 summarizes the results of the analysis and interpretation and Section 5 shows the diagnoses on the environmental efficiency analysis and future work proposals.
2. Literature Review
The technological development of oil refineries is motivated by the environmental restrictions of quality increase of petroleum products. Theregulations seekto control the sector's operational activities and management strategies. Contaminant reduction requires greater inputs expenditure (e.g. energy, water, work) and consequently anincreased generation of contaminants (e.g. effluents, emission of global warming gases) in the production processes. At first glance, the goals are contradictory, promoting a technological change towards a raw material reduction order to increase production both in environmental quality and the volume produced, and a reduction in emissions, thus ensuring a better environmental efficiency.
DEA is an approach widely used in academia in order to comparatively measure the productivity efficiency among similar companies and set goals for those which are inefficient to reach productivity efficiency.
The two classic DEA models, CCR, developed by Charnes, Cooper and Rhodes [23], consider constant scale returns and BCC, developed by Banker, Charnes and Cooper [24], consider variable scale returns. In the context of representing the petrochemical segment, using the classical models [25] present a study at a benchmarking stage and propose an action plan to achieve maximum efficiency refineries, using ten Brazilian refineries as a sample, the idle ability of refineries was the input variable and three output variables were represented by the percentage of light derivatives, revenues and gas A production.
Aimed at measuring the technical efficiency, without considering the environmental dimension of the oil sector with the use of DEA, we found in the literature [26] which, among others, uses DEA techniques to analyse the operating efficiency of 78 oil companies from different countries. A decade of performance evaluation of a Chinese oil company undertaken by [27] and a study on the efficiency and profitability of 14 oil companies from North America was presented by [28]. An investment analysis model for oil and gas production was developed by [29] that, in association with DEA, resorts to metaheuristics to find the optimal solution. Studies on the influence of state control in the petroleum sector in Norway and the UK were approached by [30]–[31], respectively.
The classical models ignore any undesirable production due to the global economic scenario of the period in which they were developed. The organizations' growing environmental concern led to changes and adaptations in classic models towards models which take into account the environmental dimension in the business efficiency evaluation. In the next section, the evolution of these models is better detailed.
2.1 DEA evolution with undesirable outputs
By marking the timeline of research on environmental efficiency, it begins in the early 50s, with the researcher [2] who warned that companies produce not only good products but, in association with them, also undesirable waste (solid, liquid or gaseous). Analytical tools for environmental performance indicators for the comparison of several companies were defined by [4] that directs to the use of efficiency non-parametric measures, such as DEA, to ascertain these indicators. From the mid-80s, studies began to appear in order to incorporate the undesirable production in the DEA models and, based on some assumptions, some adjustments have been proposed. It is noteworthy that undesirable outputs which are not necessarily associated with environmental issues can be inserted in different contexts such as: the crime rate in a city, the number in diagnosis or surgery medical errors, surcharges in some specific products, fines, i.e., an undesirable production to which we aim to reduce the problem analysed. This work will focus on the generation of undesirable effluents as an output to measure the environmental efficiency.
In classical models of DEA, the intrinsic goal is to reduce the inputs and to increase the outputs so that the units become efficient and therefore, in principle, undesirable outputs have been incorporated into models directly as inputs, aiming to minimize them by increasing the desired output [32]–[33]. Several criticisms were made about this technique due to the positioning of the variable in the model, since it modifies the DEA technology propositions. Since in these models the variables are multiplied by the same factor, the inputs and undesirable outputs are contracted in an equiproportional manner, which does not reflect the actual production models.
In order to properly portray the scenario, the undesirable outputs have been properly incorporated, keeping a greater accuracy to the original problem. Indirect ways have been proposed which consist of transforming the set of undesirable outputs, either by the multiplicative inverse [34], or by the translated additive inverse so that the values remain positive in the linear programming model [6]; subsequently included in the models as “normal” outputs, these changes have no effect on environmental efficiency values, however, the inconvenience is the attention that the user must pay to the result analysis.
The models were adapted according to the objectives, which can be broken down into different scenarios: i) keeping the inputs, increasing desirable outputs and reducing undesirable outputs; ii) increasing desirable outputs and reducing undesirable inputs and outputs; iii) maintaining the desired outputs and reducing undesirable inputs and outputs.
New approaches were developed to include undesirable inputs by [35]–[36], in which it is desirable to increase the level of these variables (e.g. waste to be used as production materials). Complementing this analysis, [37] shows a new model that uses a directional distance function, based on [38] the objectives of which can easily be modelled and measured in different scenarios.
The first linear models proposed considering undesirable outputs [6]–[38] diverged on the definition of undesirable outputs technology, between strong and weak disposability, which evaluates whether the reduction in these variables occur with or without cost, respectively. [9] presents that the models use the same limiting factor for all Decision Making Units (DMUs) and proposes a model with different factors of non-uniform rebates, and relaxes the disposability adoption between the DMUs in order to better represent the reality of companies. In order to compare three DEA models to radial measures, considering the undesirable outputs in different technologies [21], the technical efficiency of 113 refineries in the USA have been evaluated between 2006 and 2007.
In short, the DEA models differ on the definition of technology, considering the undesirable outputs as with a strong or a weak disposability and its direct or indirect incorporation into the model beyond the used measure.
The models presented use the radial extent, meaning equiproportionally reducing or expanding the variables which may possibly overestimate the efficiencies considering nonzero slacks in the constraints. Authors such as [19, 22], [39]–[41] defend the use of non-radial measures to avoid equiproportional variations of the variables, because in real cases, undesirable inputs and outputs cannot always be proportionately reduced. In [42], ten DEA models with different technologies and measures have been used to evaluate the environmental efficiency focusing on the CO2 emissions of 22 developed countries which belong to OECD. In order to compare the environmental performance of 19 public and private global oil companies in the years 2005 to 2009, in [22] a non-radial model has been used, considering the emissions of global warming gases in the atmosphere as an undesirable output.
Another important issue highlighted by [43] is the importance of uncontrollable variables and their analysis because, according to the authors, only the controlled variables are mostly analysed, which result in an underestimated assessment. The companies operate in harsh environments and managers have the control over production decisions, while the impacts of these activities are out of managerial control. When taking only the undesirable variables into account, the inefficiency is caused by the “inadequate” management and the inclusion of uncontrollable variables provide a better detailing in inefficiency cause(s). The study details the different incorporation possibilities of uncontrollable variables in DEA models [43].
Table 1 provides and presents the historical evolution of DEA models, including undesirable outputs, so as to calculate environmental efficiency, listing the main models, their references and applications. The models are structured as radial and non-radial measures. The radial measures were subdivided according to the environmental technology as strong (S) or weak (W) disposability of undesirable outputs.
Evolution of DEA models with undesirable outputs

Note: R: radial measure; NR: non-radial measure; W: weak disposability, S: strong disposability; I: input; II: undesirable input; O: desirable output; U: undesirable output, UN: uncontrollable variable, BOD: biological oxygen demand, COD: chemical oxygen demand, TSS: total suspended solids, SOx: sulphur oxide, SO2: sulphur dioxide, NOx: nitric oxide and nitrogen dioxide, CO2: carbon dioxide, CO: carbon monoxide, GDP: gross domestic product.
3. Search method
In the DEA literature, several models can be used to measure the environmental efficiency in different scenarios. In this section, we will present the models selected for this research: the classic CCR and BCC for production efficiency evaluation, two models to assess the environmental efficiency, differentiating in environmental technology, and the last one, which incorporates the uncontrollable variable in order to calculate the environmental efficiency. Therefore, we consider as n the DMUs to be analysed, m the inputs, p the desirable outputs, q the undesirable outputs, u the uncontrollable variables of positive impact and w uncontrollable variables of negative impact in the system, all positive variables. The models are oriented to minimize the inputs.
3.1 Classic models
DEA classical models have a radial measure for a DMU's inefficient projection on the frontier and ignore the existence of undesirable outputs and uncontrollable variables in their mathematical models.
3.1.1 Constant returns to scale
The first DEA mathematical model is with constant returns to scale, proposed by Charnes, Cooper and Rhodes [23], known as CCR, in reference to the name of the authors (also known as CRS). Its main feature is to calculate the analysed DMU total production and efficiency in a comparative way to others. The production function belongs to the border, being generated by positive linear combinations.

Subject to

3.1.2 Variable returns to scale
Based on the CCR model [24] has proposed an oriented model to minimize the inputs taking into consideration the variable returns to scale, known as BCC, named after the authors - Banker, Charnes and Cooper, or VRS. The model distinguishes between technical and scale efficiencies, and the production function belonging to the boundary is generated by convex combinations, using a radial measure to project inefficient DMUs on the frontier.

Subject to

3.2 Incorporating undesirable outputs
The models incorporate undesirable outputs in their formulation in two ways, either directly or indirectly. Directly they are considered as inputs in their original values, aiming at its minimization, which is criticized for not adequately representing the actual model production. Another option is to use an indirect way, with a pre-processing on data to insert it into the model, which can be accomplished by the use of the inverse additive or multiplicative inverse. When treated by the additive inverse, because the values become negative, which makes the linear programming model impracticable, the data set can be transformed, adding it to a previously chosen translation vector, turning all the elements into positive [6].
3.2.1 Indirect form
By incorporating undesirable outputs through a linear transformation on the BCC model, so as to maintain the convexity, [6] proposed a monotonic decreasing linear transformation, by the inverse use of additive: ȳsj = –ysj + βs > 0, where βs and ysj are the translation and undesirable output vectors, respectively. The model is output-oriented and aims to maintain the input level, reduce undesirable outputs (increasing the level of translated undesirable outputs) and increase desirable outputs:

Subject to

3.2.2 Direct form
The model proposed by [7] allows the assessment of environmental performance in terms of a rise in the desirable output and reduction of undesirable output through the adoption of a directional distance vector
The original model [7] was presented with constant returns to scale, being adapted to variable returns to scale in this work. The DMU is considered efficient when η = 0 and inefficient for positive values.

Subject to

3.3 Incorporating uncontrollable variables - one phase model
The one phase traditional model includes uncontrollable variables in their linear restrictions, along with the traditional inputs and outputs, and assumes that uncontrollable variables can be radially changed. To solve this problem, [43] there has been an increase in changes to the traditional model, where the uncontrollable variables are kept constant, thus preventing radial uncontrollable variables (expansion or contraction) changes. An additional problem is the need for prior knowledge of the problem and its uncontrollable variables regarding the influence on the efficiency scores. With the inclusion of more variables to the model, it is expected that the number of efficient DMUs increases, which will be avoided in this study, aiming at a choice of a total of five variables at ten DMUs. This approach was used by [43,43] for uncontrollable variables.
In this model, the undesirable outputs are used in the direct way, as inputs, aiming at their contraction and taking the constant return to scale into account. The uncontrollable variables denoted by z can positively or negatively influence, requiring a prior knowledge of this influence. The model differs from these influences in the constraints and, in this case, it is denoted by u the amount of uncontrollable variables positively influencing the model and w is the amount of uncontrollable variables which negatively influence the model. Considering as u + w the total amount of uncontrollable variables of a DMU.

Subject to

3.4 Data and variables
The quantity and quality of fresh water available to the population on the planet has increasingly been concerning governments, researchers and society in general. Oil refineries are recognized as major water consumers in their processes and consequently as major polluters due to their production of effluents. New technologies have been developed for wastewater treatment and reuse in the processes, thus reducing the use of clean water and the amount of effluents' disposal. Driven by this concern, the conceptual model presents originality when considering an input as the amount of water (m3/day) consumed in the refinery processes and as an undesirable output the amount of generated waste (m3/day) not present in papers with refining oil sector applications.
Refinery plants are designed for a particular volume of daily processing for several reasons such as due to operational factors, production tends to be lower than initially projected. The production capacity usage rate was defined by [52] as the ratio between the found and the capacity of production of the plant, assuming values in the range between 0 and 1. In this work will be considered as a variable input the indice of rate of the idle capacity of the refineries, represented by the inverse ratio the use capacity used by [25]. Due to the specificity of each refinery concerning their production, which may vary due to the production of a variety of products, the total oil processed will be used as a desirable output variable.
The sample is limited to ten Brazilian refineries, considering the 2004 operation obtained in [53,53]. A total of five variables have been considered in separate inputs: water consumed in the production (m3/day), plant idleness percentage, obtained by the ratio between the amount of oil processed (m3/day) and the refining capacity (m3/day). As a desired output, the amount of processed oil (m3/day), undesirable output, the amount of generated effluents (m3/day) and as uncontrollable variable, the age of the oil refinery (given the base year of 2004). For analysing these results, this present research validation some hypotheses: H1: The age of the refinery has a negative influence on the environmental efficiency;H2: There are same significant differences between DEA mathematical models. A statistical summary of the variables is presented in Table 2.
Descriptive statistics of variables

4. Analysis of results
The environmental efficiencies were measured in different DEA models and presented with a summary of the results in Table 3, where the first two columns display the results obtained by input-oriented classical models, CCR (1) and BCC (2), respectively. With the inclusion of environmental considerations, represented by the inclusion of undesirable outputs, we obtain the environmental efficiency scores presented in the other columns.
Summary of scores of environmental efficiency
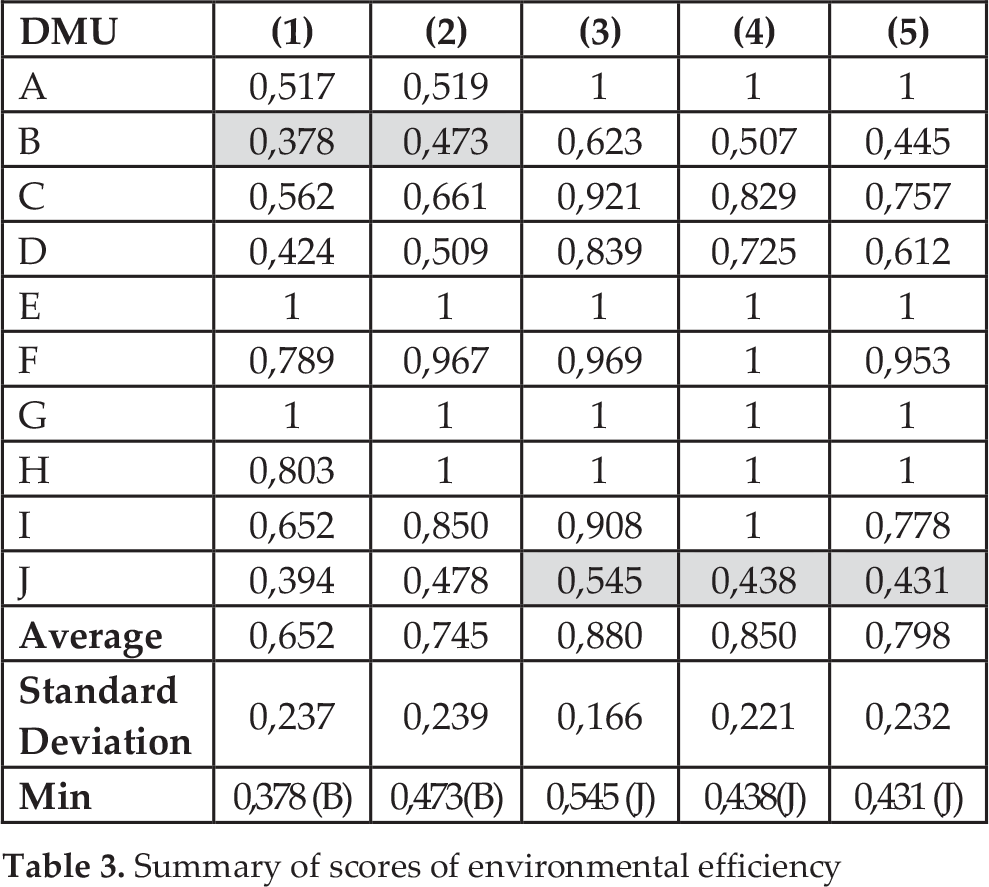
The values obtained by the model [7] presented in the fourth column (4) result in a distance from the analysed DMU to the optimal production frontier displaying values equal to zero for efficient DMUs. For comparison of efficiency scores, we performed the transformation η′=1-η, following [42]. The directional distance vector g=(ygood,-ybad) was used in the model, as well as [17,17] in their works, aiming at maximizing the expansion of the desirable output and maximizing the contraction of undesirableoutput.
In the assessment of environmental efficiency considering the influence of an uncontrollable variable, the age of the refinery, with the use of model proposed by [43], where the undesirable outputs directly are incorporated as inputs, is presented in the last column (5).
The third column (3) shows the results of the model proposed by [6], where the undesirable outputs were translated: Ybad =-Ybad +25286 and incorporated into the model as outputs. The model is output-oriented and aims at a comparison between the results, the score was transformed by δ′= 1/δ.
The efficiency scores of each refiner were evaluated based on radial technique effectiveness, namely increasing the outputs maintaining the desirable level of inputs. The efficient frontier obtained by the CCR model differs from the BCC model, because the former generates the efficient frontier by positive linear combinations, while the second per positive convex combinations. Consequently, the CCR model is more restrictive than the BCC easily observed in Figure 1, where DMU H is classified as inefficient in the first model, becoming efficient in a further analysis. These results confirm the efficient DMUs in CCR are also in the BCC model.

Technical efficiency scores of Brazilian refineries
In Table 2 a similar result as that obtained by [42] can be seen, where the BCC model displays lower efficiency scores than the models [6,6] with undesirable outputs.
In the state of the art for technical efficiency measurement of with the use of DEA in Brazilian refineries, the work of [25] presents an average efficiency for the BCC model of 0.896, with two efficient refineries and a third with a score of 0.9976 tending to become effective. These results corroborate with this analysis of 30% (three refineries) of efficient DMUs and an average score of efficiency equal to 0.74. This means that refineries can still increase its production by around 25% while maintaining the level of inputs, regardless of the undesirable side effects of production (effluent generation). Alower increase is suggested by [25], approximately 10%, and the difference found between the studies may be due to the adoption of different periods and model variables. A restriction on the output weight was inserted by [25] in the BCC model in order to avoid the occurrence of null weights.
When the environmental dimension is included in analyses, the DMU A becomes efficient which differs from classical models, where it was technically inefficient to have as a benchmarking DMU E. A diagnostic between units is possible from the perspective of controlling environmental resources through its variables. It was observed that the DMU consumes nearly twice (1,96) the water and DMU to similar productions (1% difference), but conversely has the smallest ratio between generated effluents and consumed water, which safely ensures its environmental efficiency. The E and G DMUs have lower rates of idleness and given the relationship between the input and output variables, alloweda gain in scale making them efficient in all analyses.
The requirements and adjustments for environmental considerations and safety, according to [1], require substantial investment by refineries in process improvements to reduce emissions and change the composition of final products. The results show that for this sample, hypothesis 1 was rejected. A fact that justifies the uncontrollable variable, age of the refinery, not negatively influencing the evaluation of environmental efficiency because the latest DMUs feature an efficiency score lower than older ones. The model of [43] is now less restrictive than the models of directional distance function, but does not influence the efficiency score ranking.
The Figure 2 shows the scores of environmental efficiency and highlights the similarity between the analyses of environmental inefficiency of B and J DMUs, regardless of the model and is linked to ratio of the undesirable output and desired output (effluent and processed oil) with 0, 73 for DMUs B and 0.89 for DMUs J. A comparison with the average of 0.35 for the others DMUs suggests that best practice for the treatment and reuse of effluent should be adopted to increase environmental efficiency.

Scores of Brazilian refineries' environmental efficiency
Using the Mann-Whitney statistical test to validate the similarity between the models, hypothesis 2 demonstrated that inefficiency scores did not show a significant difference. In disagreement with [21], this study did not find differences in the estimates of efficiency with change in the translation vector using the linear transformation model values of around 104 and 106 having been tested, as identified by [6].
5. Conclusion
This paper presented the development of DEA models to calculate environmental efficiency, considering the generation of undesirable output associated with production processes. As an example, three different DEA models were used for environmental efficiency with different environmental technologies, a sample of ten Brazilian refineries, considering as inputs the volume of water consumed and the idleness of the refinery operating plant, as the desired output the amount of processed oil, as the undesirable output the amount of effluent generated and an analysis was performed with the uncontrollable variable - the age of the refinery.
The results prove to be very sensitive when comparing the scores of technical efficiency and environmental efficiency, as stated by [5], which suggests that the results obtained without the consideration of undesirable output can be misleading. In addition the results obtained by [21] were observed in this work, i.e., that environmental regulations are likely to have less effect on efficient refineries, for the efficient ones in the BCC model were also in models with an environmental dimension.
The Mann-Whitney statistical test was applied to validate the hypothesis of similarity between the models of environmental efficiency, which was confirmed for a significance level of 99%, echoing [42], which states that any model is good, making it impossible to classify a universally best model. There was no significant influence of the variable age uncontrollable environmental efficiency in refinery, which was credited to the constant technological upgrades which are required of the refineries in order to meet the strict legislationspertaining to the sector.
Future work can be developed with time series analysis, analysing the influence of technical implementations carried out in refineries for processing and the reuse of effluents, making a more complete analysis of the efficiencies of projects implemented possible, including the identification of point sources of inefficiency with NDEA use. However, due to a lack of current and available data, it was not possible to conduct a more effective and comparative analysis as desired.