
Abstract
Face recognition in uncontrolled environments remains an open problem that has not been satisfactorily solved by existing recognition techniques. In this paper, we tackle this problem using a variant of the recently proposed Probabilistic Linear Discriminant Analysis (PLDA). We show that simplified versions of the PLDA model, which are regularly used in the field of speaker recognition, rely on certain assumptions that not only result in a simpler PLDA model, but also reduce the computational load of the technique and – as indicated by our experimental assessments – improve recognition performance. Moreover, we show that, contrary to the general belief that PLDA-based methods produce well calibrated verification scores, score normalization techniques can still deliver significant performance gains, but only if non-parametric score normalization techniques are employed. Last but not least, we demonstrate the competitiveness of the simplified PLDA model for face recognition by comparing our results with the state-of-the-art results from the literature obtained on the second version of the large-scale Face Recognition Grand Challenge (FRGC) database.
Keywords
1. Introduction
Face recognition represents a highly active research area attracting the interest of an increasing number of R&D groups from around the world each year. This interest is fuelled by the vast number of deployment domains where face recognition technology is applicable as well as the potential commercial value of the technology [1].
Early research on face recognition focused mainly on simple recognition problems, where all the facial images to be recognized were captured in more or less identical conditions, under controlled pose and illumination. This early area was dominated by so-called appearance based methods, such as the Principal Component Analysis (PCA) [2], the Linear Discriminant Analysis (LDA) [3] and other holistic methods (e.g., [4], [5] and [6]) that represent facial images in various subspaces, where the final recognition step is performed.
With progress made in the areas of computer vision, machine learning and pattern recognition, researchers started moving away from simple face recognition problems and began to tackle more realistic recognition scenarios where facial images were captured in different illumination conditions, under varying pose, etc. Research during this period was directed more towards local techniques, which try to describe spatially local facial areas independently of one another and, hence, are less susceptible to appearance variations caused, for example, by illumination, pose or expression changes. Examples of such techniques are presented in [7], [8] and [9].
Contemporary face recognition techniques rely on both local feature as well as holistic approaches. Thus, they try to mitigate the effects of appearance variations caused by various influential factors by describing the face with local feature vectors (or descriptors) and combining these vectors on a higher level using holistic approaches ([10], [11], [12]). While such hybrid methods are among the most effective approaches to face recognition, as evidenced by various comparative assessments (e.g., [13]), there is still plenty of room for improvement.
In this paper we focus on probabilistic approaches to face recognition, which have proven successful in the past and are particularly suited for building hybrid methods (see, for example, [14] and [15]). Specifically, we study the recently proposed Probabilistic Linear Discriminant Analysis (PLDA) [16] on a large-scale face recognition problem using the Face Recognition Grand Challenge database [17]. We show that if large amounts of training data are available for each subject, the PLDA model as introduced in [16] quickly becomes computationally intractable and other solutions for computing the PLDA model parameters have to be sought.
Since the PLDA model is not exclusive to the domain of face recognition, we look for solutions to the presented problem in the field of speaker recognition, where a similar model was independently developed and where many modifications of the model exist [18], [19] and [20]. In our experiments, we demonstrate that the simplified version of PLDA – also known as the two-covariance model – presents a viable solution for our large-scale face recognition problem and that the model results in state-of-the-art recognition performance. Furthermore, we show that in contrast to the general belief that PLDA produces well calibrated verification scores (and that, therefore, no score normalization techniques are needed), certain types of score normalization techniques still produce significant and – most of all – consistent improvements in recognition performance.
The rest of the paper is structured as follows. In Section 2, we briefly review the existing work and introduce the main ideas relating to the PLDA model proposed in [16]. In Section 3 we describe the simplified version of PLDA, providing details pertaining to the feature extraction technique used prior to PLDA and introduce the procedure for computing the verification scores for our experiments. We assess the simplified version of PLDA and state our main findings in Section 4 and conclude the paper with some final remarks and directions for future work in Section 5.
2. Theoretical background and prior work
2.1 Introduction
Probabilistic Linear Discriminant Analysis (PLDA) represents a probabilistic version of LDA [2] and was originally developed for the task of robust face recognition [15]. The technique was applied on grey-scale images as well as on feature representations derived from facial images using local descriptors, and was shown to ensure state-of-the-art recognition performance in both cases [16].
A similar model, known as Joint Factor Analysis (JFA), was developed independently by Kenny et al. [18], [19], [20] for the problem of speaker recognition 1 (SR) and demonstrated even more success for the SR problem than PLDA did for the problem of face recognition. In fact, the JFA model quickly became one of the cornerstones of the speaker recognition machinery and, due to its efficiency demonstrated at various NIST Speaker Recognition Evaluations, received wide adoption from the speaker recognition community. The most recent techniques from the SR field apply a special form of the JFA (often referred to as PLDA by the SR community as well) model to so-called i-vectors, which represent low-dimensional feature vectors extracted from speech signals of arbitrary length [21], [22], [23].
2.2 Mathematical Formulation
Both the PLDA model proposed in [16] and the JFA model used by the SR community [21], [22], [23] for classifying i-vectors share a common mathematical formulation, which can be described as follows. Let {e˜
r
: r = 1,…,R} denote a collection of feature vectors extracted from a set of biometric samples (i.e., face images or speech signals) of a particular individual. Next, the assumption behind the PLDA model asserts that each feature vector e˜r can be decomposed as:

where m denotes a global offset representing the average feature vector; the columns of φ provide a basis for the identity subspace (i.e., the eigenspace); β denotes a latent identity vector having a standard normal distribution; the columns of Γ (the eigenchannels) provide a basis for the channel subspace; αr represents a latent vector distributed according to a standard normal distribution; and εr is a residual or noise term assumed to be normal with zero mean and a diagonal covariance matrix Σ. Moreover, all latent variables are assumed to be statistically independent.
The Maximum Likelihood (ML) point estimates of the model parameters {m,Φ,Γ,Σ} are typically learned from a large collection of development (or training) data via an EM algorithm [16].
2.3 Generalization of the PLDA model
The feature vector e˜r described by Eq. (1) comprises two parts: i) an identity-specific part f = m + Φβ, which describes the between-identity variability and depends only on the identity of the subject, but not on the particular input sample, and ii) the channel component cr = Γαr + εr, which is sample-dependent and describes the within-identity variability. In case the biometric samples represent facial images, the channel variability is commonly attributed to the differences in image backgrounds and/or lighting conditions, although some other more subtle sources of variability like pose, facial expression or ageing have an effect on it as well.
To summarize, the goal of PLDA is to decompose the given input data d into an identity-dependent part f and a channel-dependent part c:

When tackling the above problem, the PLDA model makes two basic assumptions: i) the identity vector f and the channel vector c are statistically independent, and ii) the identity vector f and the channel vector c are normally distributed. Since both assumptions are questionable, a generalization of the PLDA model was proposed [19] in which the Gaussian distributions are replaced by heavy-tailed Student distributions that exhibit greater robustness to outliers, while at the same time allow for larger deviations of the feature vectors from the mean. However, this relaxed modelling assumption comes at a price. Both the implementation and run-time performance of the algorithm become more complex.
A different approach was, therefore, suggested in [24] where a non-linear transformation of the feature vectors was proposed prior to modelling. This transformation is supposed to reduce the non-Gaussian behaviour of the channel effects and, consequently, keep the computational complexity of the technique low. It turns out that the simple length normalization applied to the feature vectors suffices to achieve the desired effect. The results reported in [24], [25] show that length normalization alleviates the need for a more complex heavy-tailed PLDA model.
From the presented discussion, it is easy to see that the PLDA model has received far more attention from the SR community than it has from the face recognition community. Consequently, several modifications have been proposed for the task of speaker recognition, which have not yet found their way into the field of face recognition. In fact, our experience with the PLDA model proposed in [16] suggests that the technique quickly becomes computationally intractable if the number of training images per subject is large. In this case, either some potentially valuable training data needs to be discarded or else modifications of the PLDA model introduced by the SR community have to be adopted.
In the next section we present a modification of the PLDA model – referred to as simplified PLDA or the two-covariance model – which we propose to apply on low-dimensional feature vectors extracted from facial images. By using the simplified version of PLDA, we effectively alleviate the problem of large amounts of training data per subject and make the PLDA model more generally applicable for the task of face recognition.
3. Simplified Probabilistic Linear Discriminant Analysis
3.1 Overview
Since the original PLDA model proposed for face recognition in [16] quickly becomes prohibitively computationally expensive when the number of training samples per subjects is increased, we present in this section a simplified version of the PLDA model (hereafter sPLDA), commonly referred to as the two-covariance model in the speaker recognition literature.
Note that – similar to i-vector based SR systems – we first extract low-dimensional feature vectors from the facial images and use these feature vectors as an input to sPLDA. In this paper, we adopt the Fisherfaces approach (PCA+LDA) [3] coupled with within-class covariance normalization (WCCN) for this purpose, even though any other feature extraction technique producing feature vectors of a low enough dimension could be employed for this purpose as well. Here, the PCA+LDA subspace projection step is needed to reduce the dimensionality of the input images and to ensure the feasibility of the training procedure of the sPLDA model.
The training stage, which is required before the sPLDA model can be used in verification experiments, is typically conducted on some training or development data and, in our case results, in PCA, LDA and sPLDA model parameters. In the remainder of this section we first present the simplified PLDA model. Next, we briefly review the procedures used in this paper for computing feature vectors from facial images. Last, but not least, we introduce the procedure for matching score calculations.
3.2 The simplified PLDA model
If the dimensionality of the feature vectors {e˜r: r = 1,‥,R} to be modelled is of a sufficiently low dimension, the diagonality constraint imposed on the covariance matrix Σ of the residual term εr in Eq. (2) is superfluous. Thus, we are able to work with a full covariance matrix instead.
This change eliminates the need for a separate eigenchannel matrix Γ since it can be effectively absorbed into the covariance Σ. Consequently, the PLDA model simplifies to the sPLDA model:

It can be easily shown that this simplified PLDA model is equivalent to the two-covariance model proposed in [6]. Note that the meaning of all variables in Eq. (3) is identical to the meaning presented in Section 2.2. Thus, m again denotes a global offset, representing the average feature vector; the columns of Φ still provide a basis for the identity subspace (i.e., the eigenspace); β again denotes a latent identity vector having a standard normal distribution and ε r is still a residual term, which, however, is now assumed to be normally distributed with a zero mean and a full covariance matrix Σ.
As we have seen, there are several important differences between the PLDA and sPLDA models, which affect the amount of training data the models are able to handle. Most notably, the sPLDA operates in a low-dimensional feature space, which allows it to use full covariance matrices instead of diagonal ones, while the PLDA makes no assumptions regarding the dimensionality of the feature space, but instead presumes diagonal covariance matrices for the residual term as well as an additional channel term. The presented assumptions severely affect the training procedures of the two models and restrict the use of the original PLDA model to application scenarios with a limited amount of training data per subject. The interested reader is referred to [16] and [23] for more details on the training procedures of both techniques.
3.3 Building the feature space
In the previous section, we indicated that it is necessary to apply the sPLDA model in a low-dimensional feature space. To this end, we employ the popular Fisherface approach [3] coupled with within-class covariance normalization (WCCN) in this paper.
The Fisherface approach
The Fisherface approach is based on linear discriminant analysis (LDA), which tries to achieve maximum class-separation in a low-dimensional feature space by maximizing Fishers' separability criterion. Consider a set of n d-dimensional input samples (e.g., facial images) arranged into a d × n data matrix X = [X1,x2,…,xn] and let us assume that each of these samples stems from one of N classes, i.e., subjects labelled ω1,ω2,ωN. LDA seeks the projection basis W that maximizes the ratio of the between-class to the within-class scatter matrix [26], i.e.:

Here, the between-class and within-class scatter matrices Σ
B
and Σ
W
are defined as:
The result of the LDA training procedure is the transformation matrix W, which can be shown to consist of the first d'<N-1 eigenvectors wi (i = 1,2,…,d') of the following equation:

By using the calculated subspace basis W = [w1, w2,…, w
d
,] and an arbitrary input sample x centred around the grand mean, μ can be projected into the LDA subspace with the help of the following equation:

thus reducing the vector's dimensionality from d to d' [26]. Note that the Fisherface approach applies the presented LDA technique in a PCA reduced space to avoid singularity issues when inverting the within-class scatter matrix in Eq. (5).
Within-class covariance normalization (WCCN)
The Within-Class Covariance Normalization (WCCN) technique is a normalization method, originally introduced in the context of Support Vector Machine (SVM) modelling [27]. The WCCN tries to minimize the expected classification error on the training data. To achieve this, the authors define a set of upper bounds on the classification error metric. Mnimizing these bounds also minimizes the classification error. The optimal solution of the minimization problem is given in a form of a generalized linear kernel obtained by inverting the within-class covariance matrix Σ
WLDA
(in our case defined in the LDA subspace) computed as follows:

where yj is the j-th feature vector from the i-th class in the LDA subspace and
In order to apply WCCN normalization, each vector y should be pre-multiplied by an upper triangular matrix U, obtained through Cholesky decomposition of the matrix Σ
WLDA
−1:

where e˜ is an example of the low-dimensional feature vectors that serve as the input to the sPLDA model.
3.4 Verification score
Given two face images, the basic task that needs to be addressed in face recognition is to decide whether they come from a single person or from two different people. In the language of the sPLDA model, this translates as: given two low-dimensional feature vectors, e˜1 and e˜2, decide which hypothesis is more likely: Hs (both e˜1 and e˜2 share the same identity variable β), or Hd (the low-dimensional feature vectors were generated by two different identity variables β1 and β2). To test these hypotheses, we need to evaluate the log-likelihood ratio (s1r) given by:

For the sPLDA model, given by Eq. (3), the log-likelihood ratio is easily computed in a closed-form:

where Σtot = ΦΦT + Σ and Σac = ΦΦT By setting m = 0 (since it is a global offset that can be precomputed and removed from all low-dimensional feature vectors) and expanding the equation, we get slr = e˜
T
1Qe˜1 + e˜T2Qe˜2 + 2e˜T1Pe˜2+ const, where:
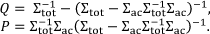
The calculation can be further sped up by diagonalizing the matrix P (see [22], [24] for details).
4. Experiments
This section presents the experimental assessment of the sPLDA model. It commences by introducing the database and experimental protocol used for experimentation and continues by presenting the most important results and findings.
4.1 Database and experimental protocol
All of our experiments were conducted on the second version of the Face Recognition Grand Challenge (FRGCv2) database [16]. The database contains more than 40,000 facial images that correspond to 466 distinct subjects. The images were captured in various environments (e.g., out-doors, indoors, under artificial lighting, etc.) over a period of several years and, hence, exhibit different characteristics that are known to affect the performance of the existing face recognition technology. Some examples of the images from the FRGCv2 database are shown in Figure 1.

Sample images from two subjects from the FRGCv2 database (images from the target set – left, images from the query set – right)
For our assessments, we selected the most challenging of the experimental configurations defined for the FRGCv2 database, namely, FRGC experiment 4. This configuration defines three separate image sets that are used for experimentation: i) the training set, which contains 12,776 images of 222 subjects captured in controlled as well as uncontrolled conditions, ii) the target set, which contains 16,026 images of 466 subjects captured in controlled conditions, and iii) the query set, which contains 8,014 images of 466 subjects acquired in uncontrolled conditions. The training set is used to train potential background models (e.g., PCA or LDA transformation matrices, universal background models – UBMs, etc.) needed by the recognition system, while the target and query sets serve as the basis for matching score calculation. As we can see from Figure 1, there is a clear mismatch between the external conditions in which the target set (Figure 1 – left pair of images) and the query set (Figure 1 – right group of images) were acquired. This setting makes the FRGC experiment 4 particularly difficult and represents a major challenge for the existing face recognition technologies. The characteristics of experiment 4 are summarized in Table 1.
Characteristics of experiment 4 defined within the experimental protocol of the FRGCv2 database

To quantify our results, we provide verification rates at the false accept rate of 0.1% for all of our experiments as defined in the FRGC experimental protocol. Additionally, we provide values for other characteristic operating points on the Receiver Operating Characteristic (ROC) curve, as well as the ROC curve itself, for all experiments.
Prior to our experiments, we subject all of the images from the FRGCv2 database to a pre-processing procedure that, based on manually annotated eye coordinates, aligns the face to a predefined position and crops the facial region to a fixed size of 128×128 pixels. All the images are also converted to grey-scale intensity images. Some examples of the facial images from the database after pre-processing are shown in Figure 2. Note here that no photometric normalization or histogram manipulation was performed on the images, leaving much space for further improvement.

Sample images from the FRGCv2 database after the pre-processing procedure
4.2 Results
In our first series of experiments we assess the performance of the simplified PLDA (sPLDA) model presented in Section 3 and compare it to the original PLDA model proposed in [16]. We also present results with respect to the performance (of our own implementation) of Principal Component Analysis (PCA) [2], which represents the baseline technique defined by the experimental protocol of the FRGCv2 database.
As emphasized several times in the paper, the original PLDA technique is not applicable if large amounts of images are available for each subject, which is exactly the case with the FRGCv2 database. 2 To make the original PLDA model feasible, we reduce the number of training images per subject to 20 (through random selection). This number is sufficiently small to allow for the original PLDA method to run on our test equipment, comprised by an Intel i5 3.2GHz dual core desktop PC with 8GB of RAM. We managed to conduct an additional test on a computer with 12GB of RAM, where the number of training images per subject was increased to 50. These two configurations are denoted as PLDA (20) and PLDA (50) in the remainder, with the numbers in the brackets indicating the number of training images per subject used.
When training the sPLDA model, we first train the PCA, LDA and WCCN transformation matrices (see Section 3.3) that are needed to perform the first feature extraction step required for the sPLDA model. Here, we use a 600-dimensional eigenspace and apply LDA in this reduced space. We adopt LDA to further reduce the dimensionality of our feature space to 200 and to increase the separability of our feature vectors. Finally, we subject the extracted PCA+LDA feature vectors to the WCCN normalization procedure. No special effort is made to optimize the hyper-parameters of the techniques – such as the number of PCA eigenvectors or LDA discriminant functions – towards the best possible performance. When training the PLDA and sPLDA techniques, the dimensionality of the final feature space is selected to be 200. Finally, the last technique assessed in this series of experiments – namely PCA – is implemented using 600 eigenfaces.
The results of this series of experiments are presented in Figure 3 in the form of ROC curves, which plot the verification rate against the false accept rate, and Table 2, where several characteristic error rates are tabulated. Here, EER denotes the so-called equal error rate, which represents a characteristic operating point on the ROC curve. More precisely, the EER stands for the operating point, where the false rejection rate and false accept rate are equal. VER@0.1%FAR denotes the verification rate at the false accept rate of 0.1% and represents the most common performance metric used when presenting recognition results on the FRGCv2 database. VER@1%FAR stands for a similar performance measure as VER@0.1%FAR and denotes the verification rate of the assessed technique at the false accept rate of 1%.
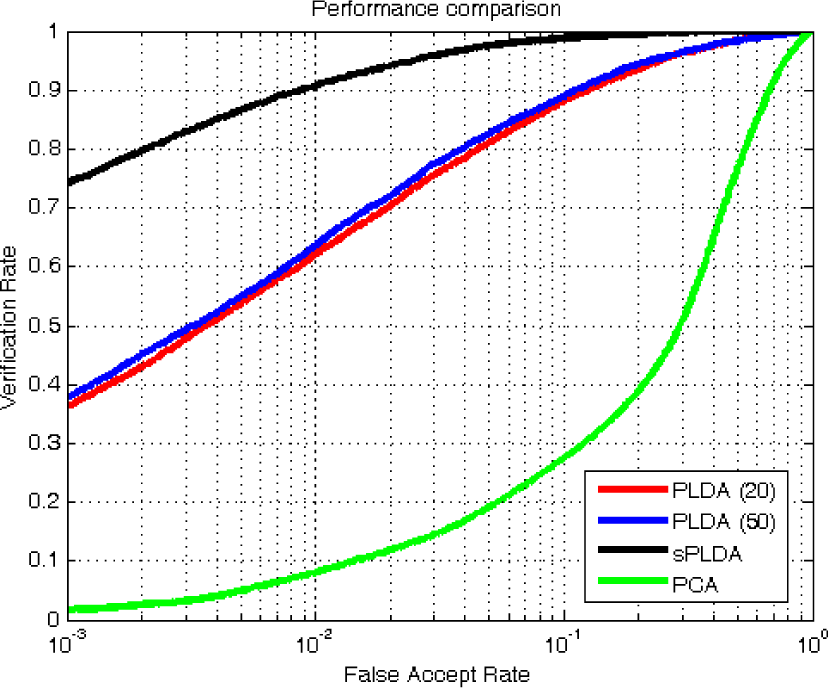
ROC curves generated during the first series of recognition experiments
Characteristic error rates for the first series of experiments (in %).
The first thing to notice is that both the original PLDA model as well as the sPLDA model significantly improved upon the baseline performance of the PCA technique. In general, the simplified PLDA model performed best with a verification rate of 74.1% at the false accept rate of 0.1%, followed in order by the original PLDA technique trained with 50, the original PLDA technique trained with 20 images per subject and finally PCA. These last three techniques achieved verification rates of 37.8%, 36.0% and 1.7% at the FAR of 0.1%, respectively.
It is interesting to see that the increase in training images from 20 to 50 did not deliver any major performance gains for the original PLDA model, suggesting that only a little additional information was added to the model with the increased number of training images per subject. Another focal point of the experiments is the performance difference between the sPLDA and the original PLDA model. As we can see, the sPLDA model outperformed the original PLDA model by a large margin. This can mainly be attributed to the characteristics pertaining to both types of models (such as diagonal vs. full covariance of the residual term, low-dimensional vs. arbitrary-sized feature vector, etc.).
To get an impression of the generalization capabilities of the sPLDA model, we conduct a more detailed analysis of the results obtained in the first series of recognition experiments. To this end, we partition the query set defined by Experiment 4 of the FRGCv2 experimental protocol into images that belong to subjects that are also present in the training set, and images that belong to subjects that have no images in the training set of the FRGCv2 database. The former group features a total of 3,494 images (belonging to 153 subjects), while the latter features a total of 4,520 images (belonging to 313 subjects). We compute performance metrics for each group and observe the results, which are shown in the form of bar graphs in Figure 4. Note that the sPLDA model ensures the lowest equal error rate (see the left graph of Figure 4) on both groups of images. Similarly, the model results in the highest verification rate at the false accept rate of 0.1% and the highest verification rate at the false accept rate of 1% for both groups of images. As expected, all the techniques perform better on the images that belong to subjects whose images are also in the training set. While the sPLDA model achieves the highest recognition rates among all the tested techniques on the images of subjects that were not included in the training set, there is still room for further improvement. To summarize, the first series of recognition experiments has proven that the sPLDA model is a viable solution to the problem of robust face recognition and that it exhibits the best generalization capabilities among all the tested methods.

Recognition performance for the assessed methods on the two image sets. Here, the first images set (i.e., red bars) comprises images of subjects that are present in the training and query sets and the second images set (i.e., blue bars) comprises images of subjects that are unique to the query image set. The graphs are shown for different performance metrics (from left to right): EER,
In our second series of experiments, we study the effect of score normalization on the face recognition performance of the assessed techniques, i.e., sPLDA, PLDA (20) and PCA. It is generally believed (see, e.g., [2], [4], [5]) that the commonly used score normalization techniques – such as z-, t-, zt- or tz-norm [12], [13], [14] – are less efficient with and, hence, less important for PLDA-like methods than other techniques. In this series of experiments, we evaluate this claim and apply four normalization techniques (i.e., z-, t-, zt- and tz-norms) to the similarity matrix generated during our experiments. Here, we do not rely on separate cohort data to normalize the scores but produce the first and second statistical moments needed by the normalization techniques by examining the query-set to target-set similarity matrix. This procedure is equivalent to score normalization in a closed set scenario.
In addition to the four commonly used normalization techniques, we also evaluate the impact of non-parametric score normalization techniques on the performance of our methods. Thus, we evaluate the impact of non-parametric versions of the z-, t-, zt- and tz- norms (denoted as NZ-, NT-, NZT- and NTZ-norm in the following figures and tables) on the recognition performance of the assessed techniques. Here, we follow the suggestion of [28] where non-parametric versions of score normalization techniques were introduced to the field of face recognition, and select a log-normal distribution with a mean of zero and a standard deviation of 0.5 as our target score distribution.
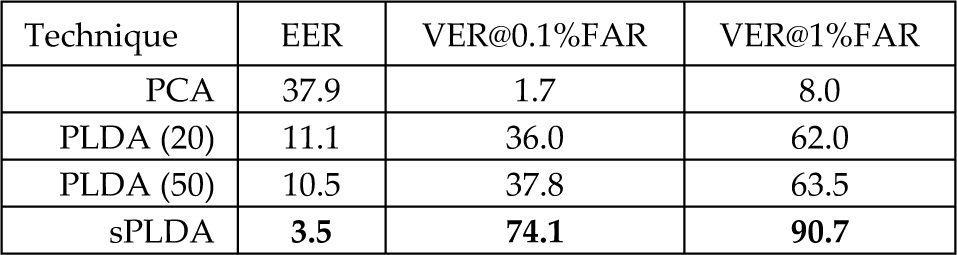
The results of this series of experiments are presented in Figure 5 and Tables 3 and 4. We can see that for the PCA technique both types of score normalization techniques (parametric as well as non-parametric) significantly improve the recognition performance. Similarly, both types of normalization techniques also improve the results of the original PLDA model, even though they do so to a lesser extent than was the case with PCA. However, with the sPLDA model, the common parametric score normalization techniques do not deliver consistent performance improvements or even worse, result in small degradations in the recognition performance. Non-parametric normalization techniques, however, significantly improve the performance of sPLDA. The most successful of the non-parametric normalization techniques (i.e., the non-parametric t-norm) improves the verification rate at the false accept rate of 0.1% from 74.1% to 82.0%. Large improvements are also observed for the non-parametric zt-and tz-norms, which achieve verification rates of 79.3% and 79.8% at the false accept rate of 0.1%, respectively.
Characteristic error rates (in %) achieved using standard normalization techniques.
Characteristic error rates (in %) achieved using non-parametric normalization techniques.


ROC curves generated during the second series of recognition experiments
Last, but not least, we compare the best performance achieved in our experiments with the sPLDA model to the state-of-the-art results from the literature. Specifically, we compare the performance of the sPLDA model to the performance of: i) a technique relying on Gabor filters and Kernel Fisher Analysis (denoted by GaborKFA) [11], ii) a Gabor wavelet based method (denoted by Gabor) [29], iii) a local binary pattern (LBP) based method (denoted as LBP) [29], iv) a combined method using Gabor features and LBPs (denoted by Gabor+LBP) [29], and v) the baseline PCA technique, for which results are provided by NIST (denoted by the BEE baseline). The comparison is shown in Table 5.
Comparison of the verification rate at the false accept rate of 0.1% for various methods from the literature.

Note that the sPLDA model results in competitive recognition performance. The only method from our comparison performing better than the sPLDA model is the Gabor+LBP technique which, however, relies on two face representations and a sophisticated pre-processing procedure. The results obtained with the sPLDA model, on the other hand, rely on a single face representation and no pre-processing whatsoever. In fact, the performance of the sPLDA model could very likely be further improved by incorporating a pre-processing procedure and, possibly, using other face representations.
5. Conclusion and future work
We have shown in the paper that simplified versions of the PLDA model that are commonly used in the speaker recognition community are also applicable to the problem of face recognition. We have demonstrated in large-scale face recognition experiments on the FRGC database that the simplified PLDA model applied on feature vectors extracted from facial images by means of LDA (coupled with WCCN normalization) results in state-of-the-art recognition performance. Our future work in conjunction to PLDA will be focused on incorporating a pre-processing procedure into the simplified PLDA model, testing other face representations such as Gabor features, LBPs or other local descriptors and using colour information in the context of PLDA.
Footnotes
2
Note that the authors of the PLDA technique made the source code publicly available and this source code was also employed in our experiments.
6. Acknowledgments
The work presented in this paper was supported in part by the national research programme P2–0250(C) Metrology and Biometric Systems, the postdoctoral project BAMBI (ARRS ID Z2–4214) and by the European Union, European Regional Fund, within the scope of the framework of the Operational Programme for Strengthening Regional Development Potentials for the Period 2007–2013, contracts No. 3211-10-000467 (KC Class) and 3211-10-000468 (KC OpComm).