
Abstract
Mobile and wireless (M&W) technologies have great potential to improve process efficiency and effectiveness within retail stores, but their application is still very limited. One of the main reasons explaining this situation is considered to be the lack of confidence in the actual benefits and, therefore, in the return on investment. As a matter of facts, activities in this context are characterised by great variety and non-standardised execution and as such the assessment of the costs and benefits of M&W solutions is more difficult than for the upstream tiers of the fast moving consumer goods supply chain (e.g., distribution centres). This paper attempts to provide a contribution for researchers and practitioners by presenting an analytical model to assess the profitability related to investments in multiple M&W solutions for retail stores, thus supporting the decision-making process.
1. Introduction
Companies operating in the fast moving consumer goods (FMCG) supply chain are generally attracted by the use of information and communication technologies (ICTs) so as to improve the efficiency and effectiveness of their processes and the way by which they communicate with their supply chain partners and customers. B2B e-marketplaces, e-commerce, radio frequency identification (RFID), wireless sensor networks, mobile payment, intelligent transportation systems and, more recently, social applications, all facilitate interaction and communication among users and are just some of the trends emerging in the industry [1]–[8].
In this scenario, the emergence of new mobile & wireless (M&W) technologies is deemed to have great potential. In quite standardized contexts, like upstream warehouses and distribution centres, some of these technologies are already commonly adopted [9]: handheld barcode readers provided with wireless (WiFi) connectivity and voice picking solutions are examples of common applications in the warehouse context [10]. On the other hand, the manual component still prevails in the processes and activities carried out in retail stores. The great variety and non-standardized execution which characterize the last supply chain tier make the implementation of technology-based process reengineering more difficult. Moreover, the availability of just a few quantitative contributions in the academic literature and the resistance to change of some IT managers are additional factors which explain the current limited diffusion of M&W technologies within the retail store [8].
Consistent with this premise, this paper presents an activity-based model to assess the costs and benefits related to the implementation of M&W solutions within the retail store. The focus is limited to the FMCG industry, since the adoption and assimilation of ICT can hardly be generalized between different industries [11]. The presented model allows us to evaluate the introduction of not only a single M&W solution, but also “integrated applications”, i.e., the adoption of a combination of M&W technologies. In fact, some M&W technologies actually share part of the required infrastructure. It is therefore clear that the “integrated application” of multiple M&W technologies can improve investment profitability, in some cases even making a profit from applications that, implemented by themselves, would not have a positive return on investment.
The remainder of the paper is organized as follows. Section 2 provides an overview of the main scientific contributions towards the evaluation of M&W applications. After the presentation of the objectives and the methodology in Sections 3, Section 4 describes our original model. Section 5 describes the results obtained when applying the model to a test-bed retail store and discusses the main business implications. Finally, Section 6 draws some conclusions and suggests future research paths.
2. Literature Review
The retailer plays a critical role in the FMCG supply chain since it has a direct relation with the final customers. As stated in the introduction, there are several ICTs which can help retailers to improve their key performances. In this regard, Keh [12] provides an interesting overview of ICT applications for retailers. Table 1 summarizes the main results and includes (in italics) additional solutions which have emerged in the years following.
The classification of the main ICT technologies for the retail store

The availability of academic literature on M&W applications for retail stores varies according to the specific technology considered. The line of research on solutions involving manufacturers and retailers (especially RFID technologies) is rich in terms of the number of contributions, but most of the literature provides only a qualitative evaluation of the achievable benefits, quantitative analysis based on empirical evidence (e.g., the Metro Future Store - i.e., the innovative supermarket opened in 2003 in Rheinberg Germany, where all the main technological innovations which were supposed to revolutionize the retail world were tested) or else expert evaluations [13]. Among them, Alexander et al. analyse the activities and the processes typical of a retail store, highlighting the benefits arising from the adoption of auto-id technologies - such as RFID - in the reduction of shrinkage and out-of-stock phenomena [14]–[15]. Angeles describes some successful case studies (e.g., Unilever, United Biscuits, Gillette, Procter & Gamble, Wal-Mart) in the implementation of RFID solutions in the FMCG supply chain [16]. Loebbecke describes the solutions implemented by Metro Group, which include the testing of RFID on pallet loads and cases, and a pilot project involving item-level tagging (smart shelf) [17]. Tags on items can provide store personnel with information on current stock and expiration dates, enabling stock-out reduction and dynamic pricing [18]. The literature also includes some quantitative models, mainly aiming to assess the benefits stemming from item-level tagging e.g., [19]–[20].
The line of research that studies M&W technologies involving both the retailer and the customer includes some contributions that qualitatively analyse the reasons both for using and avoiding self-scanning checkout procedures from the consumer perspective [21]–[23]. A few quantitative assessment models have been developed as well. For illustrative purposes, the Italian Observatory on Mobile & Wireless Business, in collaboration with an Italian retailer, developed a model to assess the benefits stemming from a self-scanning solution applied to a hypermarket [9].
The academic literature on M&W technologies involving just the retailer is poorer compared with that of the fields just considered; most of the available contributions deal with the application of M&W technologies in the upstream tiers of the FMCG supply chain [24]–[25]. Few articles relating to the retail store context can be found, and they mainly belong to the generalist press. The trend that can be outlined is the growing diffusion of batch and WiFi portable devices and the increasing number of retail companies choosing to adopt them in order to support retail store activities (e.g., receiving, put-away, replenishment, ordering inventory controls). Solutions which enable item monitoring in order to improve the availability of products on the shelf are receiving growing attention [9].
3. Objectives and methodology
The research project presented in this paper aims to develop an assessment model to evaluate the costs and benefits related to the introduction of M&W technologies within the retail store and - potentially - to inspire the decision-making process of managers belonging to this industry. In this sense, the paper attempts to combine various types of innovation with operational excellence in a fruitful manner, which is considered extremely important by researchers and practitioners [26]. The model considers all of the most common M&W technologies and allows the evaluation of both “individual” and “integrated” implementations, i.e. the adoption of one or multiple M&W technologies respectively. This feature is of fundamental importance, since different solutions can share a non-negligible portion of the required infrastructure. The model supports the evaluation of operational benefits and capital and operational expenditures (CapEx and OpEx). On the basis of the estimated costs and benefits, the model allows us to assess the investment profitability in terms of net present value (NPV) and pay-back time.
The research project intended to develop the assessment model in three phases, each characterized by ad hoc methodologies. In the first phase, the current processes performed in retail stores were analysed and mapped through direct interviews with selected multi-national and Italian retailers (Bennet, Carrefour, Conad, Despar, E. Leclerc, LD Market, Sisa). Some of these actors (Bennet and Carrefour) also supported the process re-design related to the adoption of M&W technologies. In this phase, semi-formalized questionnaires were preferred so as to discuss more freely the proposed questions and topics. A draft of the questionnaire was prepared and validated with a test company in order to check its completeness and clarity. The final questionnaire was sent to the interviewees before the meetings. The main objective was to get a broad understanding of the retail store activities in the companies so as to generalize these activities into a flexible, parametric model. Such a model should ideally be flexible enough to reproduce all of the observed processes, together with any other sensible configuration that might have been overlooked during the empirical observation [27].
In the second phase, the analytical model was developed, using the well-established activity-based costing approach [28]. More specifically, in order to quantify the impact of the adoption of M&W technologies on business processes, each activity was first split into a hierarchy of elementary activities. Next, the impact of the M&W solutions in terms of reduced resource requirements and costs was evaluated. Other authors (e.g., [13, 29]) have already used the adopted methodology in order to assess the investment profitability of RFID solutions for the upstream supply chain tiers. In order to improve its usability, the model has been coded into an MS-Excel-based tool. The framework of the model is illustrated in detail below.
Finally, the last phase includes the validation of the model through face-to-face interviews and visits to retail stores belonging to the previously mentioned Italian retailers. Specifically, the cost of the activities obtained by applying the assessment model in the baseline (‘as is’) scenario was compared with the real cost provided by the retailers in order to check the model's reliability. The observed errors were considered to be unbiased and acceptable.
4. The model
4.1 The reference retail store
The structure of the reference retail store considered in the model is represented in Fig. 1. The model has been structured to represent retail stores characterized by different physical dimensions (e.g., supermarkets vs. hypermarkets), simply modifying the value of some of the input data set by the user.

The structure of the reference retail store
Three main areas can be distinguished:
The sales floor, where goods are displayed on the shelves so that customers can pick them up - it also includes the checkout area;
The receiving area, where the goods are received from upstream supply chain tiers;
The backroom, where some categories of goods are temporarily stored - the presence of this area depends on the type of retail store (e.g., it can be absent or very small in supermarkets).
The reference store also includes two offices (one in the checkout area and the other in the backroom) where administrative activities are carried out.
Some of the main input parameters characterizing the physical dimensions of the three areas just described are included in Table 2.
Input parameters characterizing the physical dimensions of the reference retail store

Table 3 illustrates the macro-activities considered in the assessment model. All the activities executed in the retail store are included and not only those affected by M&W applications; this feature allows us to understand the impact of M&W technologies on the total cost sustained by the retail store and to easily validate the results of the model. All these activities have been studied in depth and the associated consumption of resources has been modelled using an activity-based approach. The results were extensively reviewed and validated by the managers of the retailers who joined the research project (cf. Objectives and Methodology).
Macro-activities included in the model.

4.2 The baseline scenarios
In order to evaluate the benefits offered by M&W technologies, a baseline scenario representing the initial technological situation should be considered. Two different procedures are modelled:
Paper-based: the retail store activities are carried out resorting only to paper documents; pallet loads and cases are identified using a numerical code printed on a label. Information collected during the activity execution is manually written down and then inputted in the information system;
Batch devices: the store personnel are provided with handheld barcode readers which are used to automatically identify the products (pallet loads, cases and items), thus supporting most of the activities. The required information is downloaded from a PC station placed in one of the store offices (cf. Figure 1). The handheld readers are also used to input data collected on the sales floor or in the backroom; at the end of the performed activity, the employee is supposed to return to the office and synchronize the handheld device with the information system.
If necessary, these two procedures can be combined in order to best represent the real as-is situation; paper-based management and the use of batch barcode handheld devices, in fact, often coexist in the same retail store. For instance, batch devices can be used for truck acceptance, the inspection of inbound goods and error management and counting, whereas all other activities remain paper-based.
The baseline scenario assumes that in the checkout activity the scanning and the payment process are carried out with interaction between the customer and the store personnel, who scan all of the picked items. The store personnel are also involved in monitoring on-shelf availability: out-of-stocks are detected by wandering about the aisles.
4.3 The mobile & wireless scenarios
The model considers three categories of M&W technologies, specifically:
solutions affecting the current processes carried out by the retail store workforce, thus representing an alternative to the baseline scenarios. They include:
WiFi devices: handheld barcode readers provided with wireless (WiFi) connectivity; the main difference between wireless and batch devices is that WiFi connectivity allows real-time synchronization with the information system. Therefore, the retail workforce can download and upload information without going back to the office; RFID on pallet loads and cases: the implementation of this solution requires the use of WiFi portable devices; in fact, it is assumed that a store adopting an RFID solution is unlikely to manage its retail activities using a paper-based procedure or batch handheld devices, although it is not inconceivable. It is also assumed that the retail store does not bear the cost of the RFID tags because goods arrive already tagged from the upstream supply chain tiers (i.e., manufacturers);
solutions affecting the checkout process. The peculiarity of the checkout is that – as distinct from the previously described activities – the customer begins to play an active role. Two technological solutions have been considered:
self-scanning: customers scan the items through a portable device, just after picking them from the shelf; the payment process is carried out in the traditional way, so the customer interacts with the store personnel; self-scanning and payment: similar to the previous solution, but in addition the payment process is carried out without interacting with any employees; a machine reads the total amount due for the purchases and the customer uses cash or credit/debit cards for the payment;
solutions providing additional functionalities - i.e., the monitoring of the items on the shelf. The basic assumption is that the costs of the technology are still too high for performing the continuous control of all the products on the shelves. Therefore, only selected categories (e.g., promotional items) are affected by the introduction of the new technology. Two main solutions have been considered for monitoring products on the shelves:
weight sensors: these are integrated into the shelf and they are able to estimate the amount of products on the shelf, since the unit weight has been previously set in the system. However, this solution does not allow it to detect those situations in which an item is placed on the wrong shelf; sensors, in fact, measure the total weight, but they cannot distinguish between different products, especially if they have similar weights; RFID on items: individual items are tagged by the store personnel before being moved to the sales floor; employees take the items out of the cases, apply the RFID tags and initialize them with the product code. The tagged items are then positioned on smart shelves, which identify the articles on them and are able to detect positioning errors as well. It is assumed that the cost of the tags is sustained by the retail store.
For the purpose of clarity, it is important to notice that in this paper the term “technological scenario” refers to a combination of M&W technologies concurrently applied. Applications affecting the checkout process and providing additional functionalities can be associated with each of the solutions used to support the retail store activities (i.e., paper-based, batch devices, WiFi devices, RFID on pallet loads and cases).
The combination between the baseline procedures and the solutions that involve M&W applications generates 61 alternatives, which are summed up in Table 4. For illustrative purposes, the scenario which considers the evolution from a paper-based procedure to the use of WiFi devices is identified by number 18. Moreover, additional M&W applications can be implemented together with the WiFi portable devices: e.g., RFID tags on items (No. 20), self-scanning (No. 21) or both (No. 25).
The 61 combinations analysed in the paper.

4.4 The assessment of the operational benefits
Each macro-activity shown in Table 3 was first split into a hierarchy of elementary activities. Then, the impact of M&W technologies in terms of reduced resource requirements based on the relevant operational resource consumption drivers was evaluated. More specifically, the assessment of the operational costs characterizing all the considered technological scenarios requires the following steps:
the identification of resource drivers: for each elementary activity, the resource driver(s) is (are) identified;
the identification of the value of the resource drivers (inputs): the model requires about 350 items of input data, which can be divided into the following categories:
data related to the physical structure of the retail store (around 20) - e.g., the area of each receiving dock, the shelf depth in the sales floor and the number of storage levels in the backroom; data about the workforce (around 10) - e.g., speed (with or without the forklift), the unit cost of labour and labour efficiency; time to carry out the elementary activities (around 200) - e.g., the average time required to write a note about the inconsistency between the order and the incoming goods, the average time to position an item on the shelf, the average time to scan the barcode placed on an item during the checkout process; context data (around 40) - e.g., the number of areas within the store, the number of working days in a year and the frequency of inventory controls; data about nonconformities (around 60) - e.g., the percentage of inbound expired items, the percentage of trucks which arrive at the retail store with a broken seal, the percentage of items with a barcode that cannot be scanned correctly; data about the flows of goods (around 20) - e.g., the annual flow of inbound cases, the percentage of cases coming from the distribution centre and the percentage of promotional products.
An analysis of the inputs which most affect the results was carried out in order to support companies interested in the evaluation and speeding up of the use of the model;
time assessment: on the basis of the selected resource drivers, the time needed to perform each activity is therefore assessed through a specific evaluating formula;
cost assessment: the quantification of the cost of the activities resorts to the ABC (activity-based costing) approach - i.e., the cost for each resource is calculated starting from the time required to carry out the elementary activities quantified in the previous step and from the unit cost of labour. It is important to stress that costs have been assumed to be avoidable and variable with the volumes (i.e., the annual flow of cases entering into the retail store).
comparison of the scenarios: operational benefits are calculated by comparing the costs sustained to carry out the activities before and after the implementation of the M&W technologies considered.
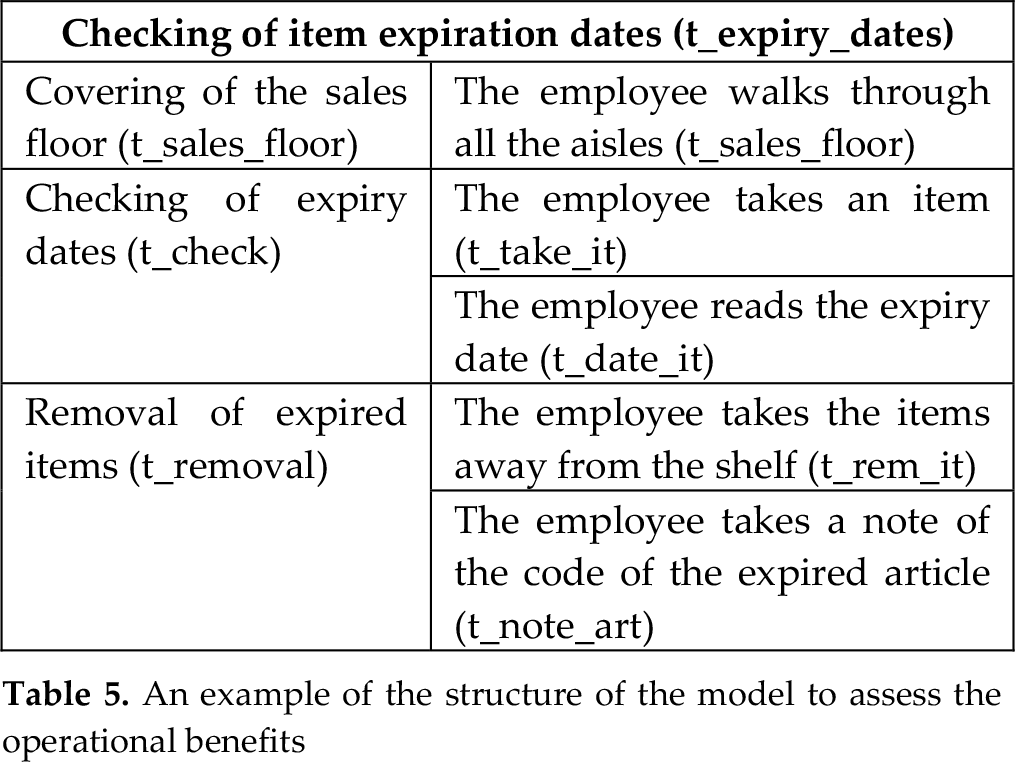
As an example, the sales floor management macro-activity is used to illustrate the structure of the assessment model. This macro-activity can be split into the following activities: product re-ordering, counting, checking of item's expiration dates, the re-positioning of misplaced items and price updating. Each of these activities can be split again into a hierarchy of sub-activities and elementary activities in order to assess the time required to carry them out. Table 5 and the subsequent equations illustrate an example of this process for the checking of item expiration dates.
An example of the structure of the model to assess the operational benefits


where:
dist = distance to cover all the sales floor;
w_speed = walking speed;
η = workforce usage factor;
t_take = time to take an item;
N_art = number of checked articles;
t_date = time to check the date;
t_rem = time to remove the item;
t_note = time to take a note;
4.5 The assessment of the capital and operational expenditures
The model allows us to quantify both the investments (capital expenditures - CapEx) and the recurrent annual costs (operational expenditures - OpEx).
The CapEx includes hardware and software infrastructure, the installation cost and change management. For each cost category, the assessment is carried out identifying the resource drivers (see Table 6) and then, on the basis of these parameters and the unit cost of the resources, calculating the total investment cost. The model accounts for cost synergies stemming from the application of different technologies that share a portion of the required infrastructure, thus counting shared costs only once.
CapEx: an overview

The OpEx includes maintenance, which is evaluated as a percentage of the investment costs sustained for the hardware infrastructure and the cost for RFID tags. In fact, in the scenarios where RFID labels are applied on items, the cost is borne by the retail store and depends upon the number of monitored items.
5. The application of the model
5.1 The inputs
Even though the results presented in this paper refer to a hypermarket, the model can be used for both hypermarkets and supermarkets, simply by changing the input parameters accordingly. Table 7 reports the main input parameters that characterize the retail store considered in the analysis.
Input parameters characterizing the test-bed retail store

5.2 Results and discussion
The model was applied to all the 61 combinations of M&W technologies, assessing the NPV and the non-discounted PBT. The NPV was evaluated within a 5–year time horizon and considered a cost of capital of 10%. Table 8 summarizes the results: for purpose of clarity, the green boxes indicate more positive outcomes (i.e., NPV>0; PBT<5 years).
The results – overview of all 61 comparisons (NPV: k€; PBT: years)

The average NPV of these scenarios (evaluated over a 5–year period and considering a cost of capital of 10%) is about €265,000 and the average PBT amounts to 5.5 years; 45 of the 61 scenarios have a positive NPV and 43 are characterized by a PBT that is shorter than 3 years. 35 of the analysed combinations use a paper-based management of the retail store in the baseline situation; their average profitability is higher than that calculated, including all 61 scenarios: in fact, the average NPV is about €390,000 and the PBT amounts to 2.45 years. On the contrary, the 26 scenarios characterized by the use of batch devices in the baseline situation show a worse profitability compared with the average (NPV: €95,000, PBT: 9.5 years). The baseline situations where batch devices are adopted, in fact, are characterized by higher efficiency and effectiveness than those that use the paper-based procedure; therefore, the potential benefits obtainable through M&W technologies are, on average, lower for the former than for the latter.
The technological combinations which present the best profitability are those that include self-scanning, with or without self-payment procedures for the checkout activity: these scenarios are characterized on average by an NPV of about €340,000 and by a PBT of less than 3.5 years, resulting in more profit than the average of all 61 scenarios. Checkout, characterized by a predominant manual component, is the only activity modified by the adoption of self-scanning (with or without self-payment); these M&W applications reduce the interaction between the customer and the employees for the scanning of the items and the payment process and, thus, decrease the total cost of labour borne by the store.
The monitoring of the items on the shelf is the category of analysed M&W technologies characterized by the worst average profitability: all four of the scenarios including the adoption of RFID on items or the adoption of weight sensors without any other change in the baseline situation have a negative NPV. The CapEx and OpEx, in fact, are too high to make these solutions profitable if adopted by themselves. The OpEx are particularly high for solutions that include RFID technologies on items, because the retail store has to bear the cost of tags. The profitability of the solutions for the monitoring of the items on the shelf improves when different technologies are jointly adopted; 18 out of the 20 scenarios characterized by a combination of the three M&W technologies, including those for monitoring on-shelf availability, in fact, have a positive NPV. This result demonstrates the value of the combination of different M&W technologies to improve the profitability of applications that have a positive impact on efficiency and effectiveness in the execution of retail store activities, although they are characterized by high implementation costs.
For the sake of illustration, the evaluation relating to two technological scenarios (marked no. 3 and no. 23 in Table 4) is detailed in the paper. These scenarios have been selected in order to show the value of the “integrated application” of multiple technologies simultaneously. In both cases, none of the retail store activities are supported by handheld devices in the baseline scenario, which is the most commonly represented in the Italian FMCG industry. More specifically “scenario 3” evaluates the introduction of just one M&W technology - i.e., the self-scanning procedure for the checkout activity. Scenario 23, instead, includes WiFi devices, weight sensors and self-scanning. The features of the detailed scenarios are summed up in Table 9.
The illustrated scenarios

The operational costs for the execution of retail store activities in the baseline and in the two M&W scenarios are represented in Figure 2. The activities that have a major weight on the total operational cost are (in decreasing order): checkout, the positioning of the items on the shelf, the inspection of inbound goods and error management and, finally, re-ordering.
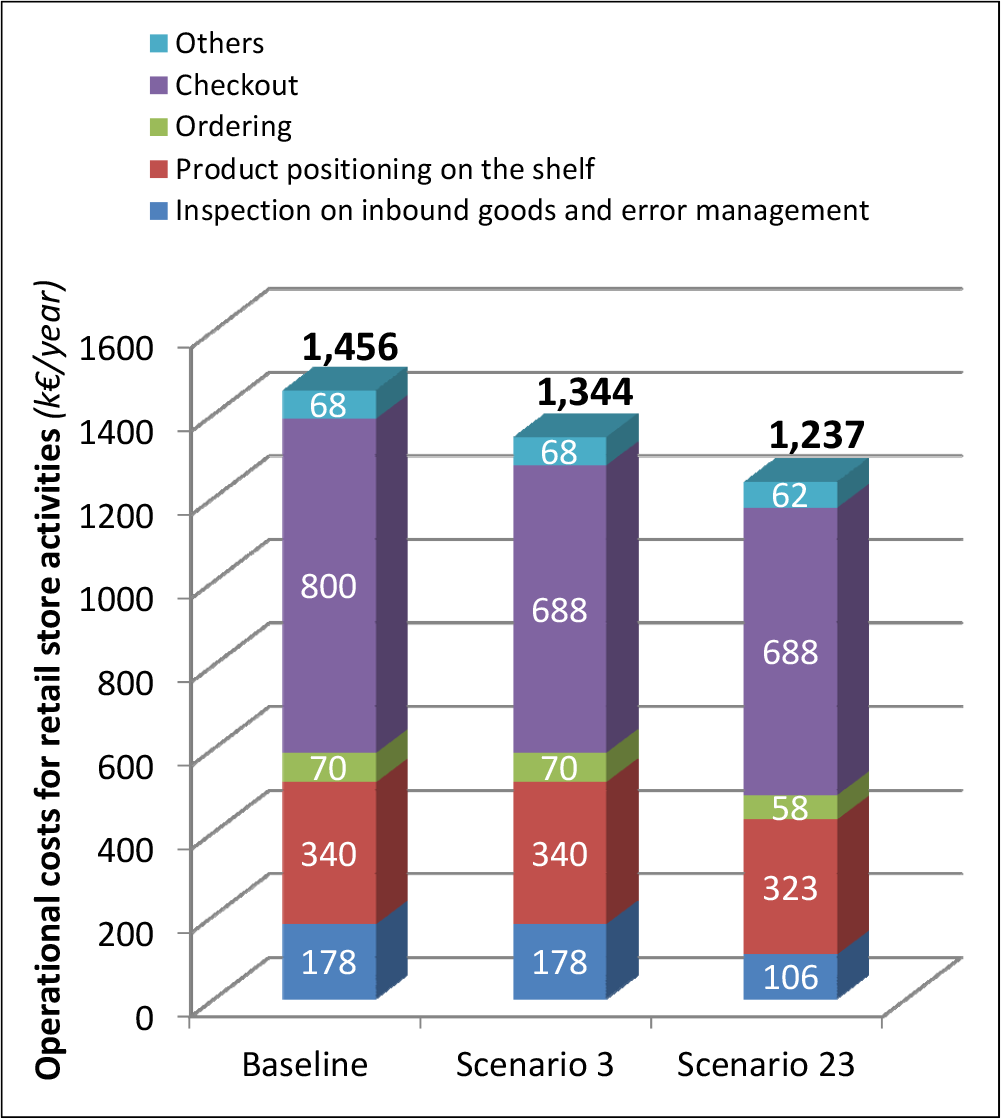
Operational costs for the baseline, Scenario 3 (self-scanning) and Scenario 23 (WiFi devices, self-scanning and weight sensors)
The only retail store activity influenced by the introduction of the self-scanning procedure is the checkout. The basic assumption is that - as emerged from empirical evidence - only a subset of customers (about 10%) will use the self-scanning devices, whereas the rest will continue with the traditional checkout. The cost of checkout activity is, therefore, reduced by €112,000/year (about 8%), which corresponds to the total decrease in operational costs. The CapEx required for the implementation of self-scanning is about €184,000, whereas the OpEx amounts to €17,000/year. The NPV of this solution (evaluated over a ***5-year period and considering a 10% annual cost of capital) is more than €215,000 and the PBT is about 23 months.
The operational costs in Scenario 23 are also represented in Figure 2. The reduction of the operational costs from the baseline to the M&W solution for Scenario 23 is about €220,000/year, or 15% of the initial costs. The most affected item is the cost of the checkouts which, thanks to the self-scanning procedure, is reduced by €112,000/year. In percentage terms - instead - the highest reduction regards the cost of the inspection on inbound goods and error management, which is reduced by 40% (€72,000/year). The CapEx required for Scenario 23 is higher than that for Scenario 3 and is about €245,000; the OpEx amounts to €21,000/year. It is important to underline that the M&W solution presented in Scenario 23 includes three technologies - i.e., self-scanning devices, WiFi devices and weight sensors - which require a WiFi connection. Therefore, the cost of this infrastructure can be shared among the three applications. The NPV of Scenario 23 (evaluated over a 5–year period and considering a cost of capital of 10%) is more than €580,000 and the PBT is less than 15 months.
Comparing the two solutions presented, Scenario 23 has both higher operative benefits and a higher CapEx than Scenario 3: in fact, the operative benefits in Scenario 23 exceed those in Scenario 3 by about 96%, whereas the CapEx exceeds them by 33%. This leads to a more than proportional increase of operational benefits compared to the rise of investment costs when adopting a combination of M&W technologies in the retail store.
6. Conclusions and future developments
The model developed in this study aims to assess the costs and operational benefits stemming from the implementation of different combinations of M&W applications within retail stores. This is one of the first attempts in this direction. The scenarios described in the details highlight the value of the “integrated” approach, since the operational benefits increase more than proportionally as compared with the investment costs. This model can also represent useful support in decision-making for practitioners who need an analytic tool to evaluate the profitability of M&W solutions. According to this perspective, the proposed model can actually help to overcome some of the barriers which still limit the diffusion of M&W applications within retail stores. In fact, by highlighting the quantitative benefits and the investment profitability related to M&W applications, the model can help convince reluctant IT managers to invest in these solutions.
The research project presented in the paper has some limitations, which should be overcome in future research stages. A possible future development of this study would be to consider a wider range of technologies dedicated to the retail store (e.g., self-checkout counters, where the customer scans their items and pays without interaction with store personnel, or electronic shelf labels – ESL – that update information about articles automatically). Furthermore, this model considers only efficiency benefits, but there are other interesting impacts to analyse (e.g., effectiveness benefits, such as any sales increase due to stock-out reduction, any increase in the average spending of customers who use self-scanning etc.).