
Abstract
India is one of the fastest emerging global manufacturing hub with a large number of firms shifting their manufacturing base to the country due to cheap labor and good supplier(s) base. Over the years, India has the largest number of companies, outside of Japan, that have been recognized for excellence in quality. As many as 21 companies have received the Deming Excellence awards; 153 companies have achieved Total Productive Maintenance (TPM) Excellence Award for their total productivity management practices by the Japan Institute of Plant Maintenance (JIPM) committee (Source: IBEF, 2010). Here in this research article author(s) conducted an empirical survey among Indian manufacturing firms to understand how manufacturing competency effect the firm performance. It has been observed that manufacturing competency has negative impact on firm performance which is contradicting with the so far empirical studies conducted in European, Japanese and American countries. Here in this study authors provides in depth analysis to explain this negative impact and how this can lead to positive impact.
1. Introduction
India is ranked second in terms of manufacturing competence, according to report ‘2010 Global Manufacturing Competitiveness Index’, by Deloitte Touche Tohmatsu and the US Council on Competitiveness. The report highlights that the country's talent pool of scientists, researchers, and engineers, together with its English-speaking workforce and democratic regime make it an attractive destination for manufacturers. According to the Industrial Outlook Survey conducted by the Reserve Bank of India (RBI) for October-December 2010 quarter the Indian manufacturing sector showed positive overall business sentiment in the quarter. The business expectation index (BEI), which acts as a barometer of the overall health of the manufacturing sector, has gone up to 126.5 for the assessment quarter, its highest reading since the April-June 2007 quarter. As India's economic growth accelerates, it is gaining interest from U.S. manufacturers as a production location and for its considerable sales potential. In spite of domestic economic challenges, the remarkable growth of Indian exports, of which 65 percent are manufactured goods, has catalyzed an impressive performance in Indian manufacturing, according to the latest MAPI/Manufacturers Alliance Issues in Brief. While growth decelerated during 2008, however it remained positive during the early stages of a global downturn that sent manufacturing output in more than a few major countries into a double-digit decline. Capital goods output growth has been especially strong, reflecting the growing share of gross investment in GDP from about 25 percent in 2000 to nearly 38 percent in 2008. Output in the capital goods sector registered annual growth of 9 percent during 2008, although this is significantly slower than the nearly 16 percent average for the 2003–2007 period. Consumer goods output, which enjoyed double-digit annual gains between 2004 and 2006, slowed modestly from 7 percent during 2007 to 6 percent during 2008. Between 2004 and 2008, the most recent five-year period, most sectors posted moderate to strong growth. The weak link has been metal products and parts, excluding machinery and transport, whose growth since 2003 has been weak and sporadic. The industry sectors with strong growth have been textiles, machinery and equipment, and basic metals. A study showed dependence on infrastructure, on bank and capital market financing, and high labor intensity in production characterize the industries that perform relatively worse, a pattern likely to persist until these policy issues are addressed. But questions remain about the sustainability of Indian manufacturing growth. The strength and breadth of the global economic recovery will dictate the outlook for manufacturing in both advanced and emerging markets. But Indian policy makers must think beyond the next cycle of global growth. Responding to above issues author(s) in this particular study formulated two key objectives to understand how manufacturing competency in particular can help to sustain healthy double digit growth in Indian manufacturing sector in next decade.
The objective of this study is:
To study the impact of manufacturing competency on firm performance.
2. Literature review
The main purpose of this chapter is to understand how competencies of firm can be the source of competitive advantage for firm and how in the past various researcher(s) have carried out study to understand how manufacturing competency has helped the firm and what are the studies has been carried out in this direction so far.
The Figure 1. shows the framework which is underlying the literature research. The key points of this framework are highlighted as follow:

Conceptual framework underlying the literature review
The distinctive competencies of any firm arises from two sources, that are its resources(man, machine, materials, land, state of art, methods) and capabilities. A differentiating competency is ability that allows one firm to achieve superior efficiency, quality, innovation or customer responsiveness and thereby to attain a competitive advantage (Nguyen, 2008). The primary objective of any firm is sustain competitive advantage by maintaining strong growth rate and high profitability.
The concept of resources was introduced into the management field in the 1970s when Ansoff (1965) categorized skills and resources according to the major functional area, i.e. research & development (R&D), operations, marketing, general management and finance. But until the mid 1980s did the concept of resources as a source of sustainable competitive advantage become dominant in the strategic field. There has been resurgence of interest in the role of the firm's resources as the foundation for firm strategy. The firm's resources can be defined as stocks of available factors that are owned or controlled by the firm. The final products or services are produced by using a wide range of other firm assets and bonding mechanisms such as technology, management information systems, incentive system, trust between management and labour, and more (Amit and Schoemaker, 1993). Grant (1991) defined resources as the inputs into the production process, which are the basis of analysis. To identify resources, financial balance sheets are notoriously inadequate because they disregard intangible resources and people-based skills – probably the most strategically important resources of the firm (Grant, 1991). Barney (1986, 1991) also suggested that not all aspects of a firm's physical capital, human capital, and organizational capital are strategically relevant resources. However Christopher (2003) in his text book titled “Logistics & Supply Chain Management: Strategies for reducing cost and Improving service” has clearly reflected that how logistics competency can really help firm by reducing distribution cost and by improving customer satisfaction by providing product at right place in right condition in right time.
It has been long debated issue that how to measure firm performance and over the years but in traditional economic theory major emphasis on market power and industry structure as determinants of firm performance (Chadwick 1999; Chandler, 1994; Knight, 1997; Wiklund, 1999). For measuring a firm's performance, Financial and non-financial measures have been used. The financial measures include such as return on assets (ROA), market share, Return on Investment(ROI), Operating Profit of Firm (EBIDTA), growth rates in domestic and export sales growth. Similar measures are used by previous researcher (e.g. Hitt et al., 1982, 1985). Similarly, the non-financial measures of performance include management's perceptions of productivity, profitability, market share, and customer satisfaction relative to competitors. The possibility of using non-financial performance measures was suggested by Dess and Robinson (1984) if the accurate objective measures are unavailable. Subjective measures of performance have been used by several researchers (e.g. Li, 2000, Akimova, 2000).
Performance measures used in empirical competitive advantage research

(Source: Authors own compilation based on available literature)
3. Conceptual framework, measurement instrument development and data collection
Earlier researchers have attempted to study the impact of one functional area competence on a firm's overall performance (Capon et al., 1990; Drucker, 1973; Ettlie, 1997; Hayes and Wheelwright, 1984; Tunaly, 1992). Recent studies show that only when a firm can concert its functional area competencies can be more competitive on the market place (Evans and Lindsay, 1996; Hill and Jones, 2001; Porter, 1990; Droge and Vickery, 1994; Li, 2000). Many re-searchers have concluded that desired level of performance cannot be achieved in organizations which fail to respond effectively to relevant environmental demand (e.g., Lawrence and Lorsch, 1967; Dill, 1976; Pfeffer and Salancik, 1978; Ansoff, 1979; Porter, 1980; Hitt et. al., 1982). There has been a study conducted by Hayes & Wheelwright (1984) where he has shown how manufacturing competency can help a firm to improve the firm performance. The discussions which we had so far clearly motivate us to conduct research in this direction where we hardly found any study to our knowledge available in EBSCO database, Emerald and Elsevier, author(s) proposes conceptual framework for the present research is designed as shown in Figure 2.

A conceptual model of the relationship between functional competencies and firm performance (modified version of Nguyen, 2008 research model)
Hypothesis 1: There is a positive relationship between the manufacturing competency and firm performance.
Note: Here authors in this paper present only one hypothesis though questionnaire prepared to study the affect of all four competencies on firm performance however this present paper focuses on how manufacturing competency affect Indian manufacturing firm(s) performance.
To conduct survey research, an instrument for this study scientifically developed. To begin with, a review of the extensive literature on the four main concepts – including manufacturing, marketing, logistics, human resource and firm performance were done to identify the key items of each variable which has been used to design questionnaire.
Independent variables were identified in the conceptual framework presented in the previous section. They include the manufacturing, marketing, logistics and human resource competencies. The items used to operationalize these four functional competencies in this study were adopted from several studies of Clark, 1982; Conant et al., 1990; Craig and Douglas, 1982; Droge et al., 1994; Evans and Lindsay, 1996; Ha, 2002; Hayes and Wheelwright, 1984; Hitt and Ireland, 1985; Li, 2000. Porter, 1980, 1985; Simerly, 1997; Tunaly, 1992; Christopher, 2003; Nguyen, 2008.
Earlier studies reflect that there is no standard measure of the firm's performance (Droge et al, 1994; Hitt and Ireland, 1985; Li, 2000); Sharma and Fisher, 1997; Snow and Hrebiniak, 1980). Commonly used approaches include: market based indicators and financial based indicators. Asian companies hesitate to disclose their financial data (Bae and Lawler, 2000). In this context we also adopted some of the variables used by Nguyen, 2008 in his Ph.D thesis based on study on manufacturing firms in Vietnam
In order to refine the questionnaire developed by the researcher(s) expert opinion has been very useful. Total twelve experts were invited to refine and validate measures for each concept. They are four academic faculties from economics and management department of NIT, IIT, IIM and UPES who specialize in the four functional areas and 8 general manager of manufacturing companies. The 8 companies are from four different sector(s) including steel, cement, chemical, and automobiles. The expert's opinion has helped to further refine the questionnaire.
The respondents were asked to response on questionnaire provided to them. The first part was related to the functional competencies. In this section, a total of twenty-two statements were used to measure the four functional competencies and in second part there are five statements on firm performance divided into two category i.e. financial and non-financial performance. The respondents were asked to indicate the degree to which their firms would employ the practices commonly seen in the four functional areas.
There is no collected data source from previous research conducted on the same content and context as those of this study. Primary data is therefore imperative for the study. Primary data for this study was gathered from manufacturing companies located in India.
This study focused on the manufacturing companies in Durgapur in West-Bengal, Rudrapur in Uttarakhand and Ahmedabad in Gujrat. The manufacturing companies in India were identified through database of CII (Confederation of Indian Industries). It provides the list of companies operating in India, their contact address, their type of business, and their type of ownership. Here 450 manufacturing companies were randomly chosen to send the questionnaires.
A mail survey was conducted during May and July 2009. Data collection proceeded by calling randomly the targeted respondents in order to confirm their mail-address, inform them about the study and to encourage them to respond. A total of 450 questionnaires were then sent by mail to the 450 manufacturing companies. Each mail includes a letter of introduction, a questionnaire and a mailed back written address envelop with a stamp for respondent to mail back when they complete the questionnaire. Consequently 125 questionnaires were mailed back at gross response rate of 27.78%. Total number of used questionnaire is 110 achieving respondent rate of 24.44%.
Data entry started with the development of a coding plan for the question items in the questionnaire. This plan was used to define variables in SPSS 16. The next step was the key-in of questionnaire responses in the defined SPSS 16 data spreadsheet. The database was examined and had indicated that the missing values were distributed at random. According to Hair et al., (1999), this situation of missing data was acceptable for multivariate data analysis.
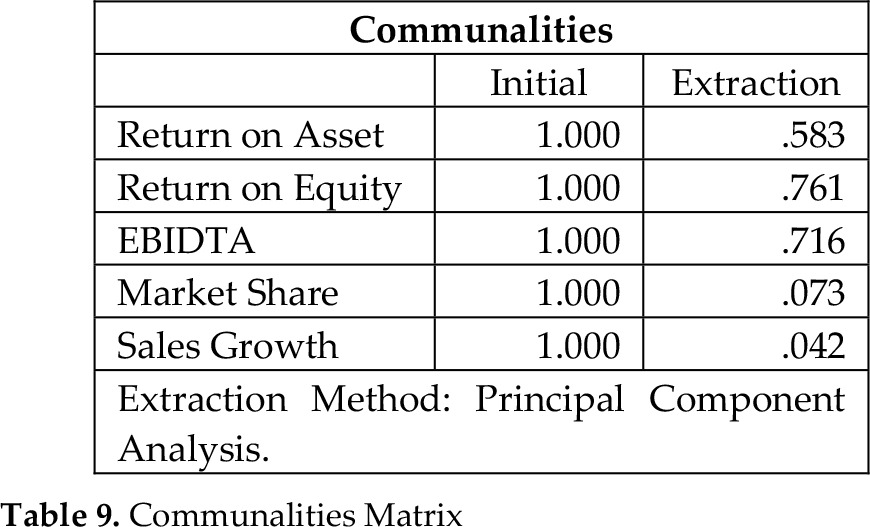
The KMO and Bartlett's test results shown in Table 2. indicate the suitability of the data for factor analysis. Kaiser-Meyer-Olkin Measure of Sampling Adequacy is 0.545 for functional competencies and 0.68 for organizational performance which is greater than 0.5. This indicates that a factor analysis will be useful with the data. The value of significance level is 0.000, which is less than 0.05. So there is a significant relationship among the variables. The Table 3. shows initial extraction indicates that the communalities are very high, which indicate that the extracted components represent the variables well.
KMO and Barltlett's test for functional competencies and performance

Communalities

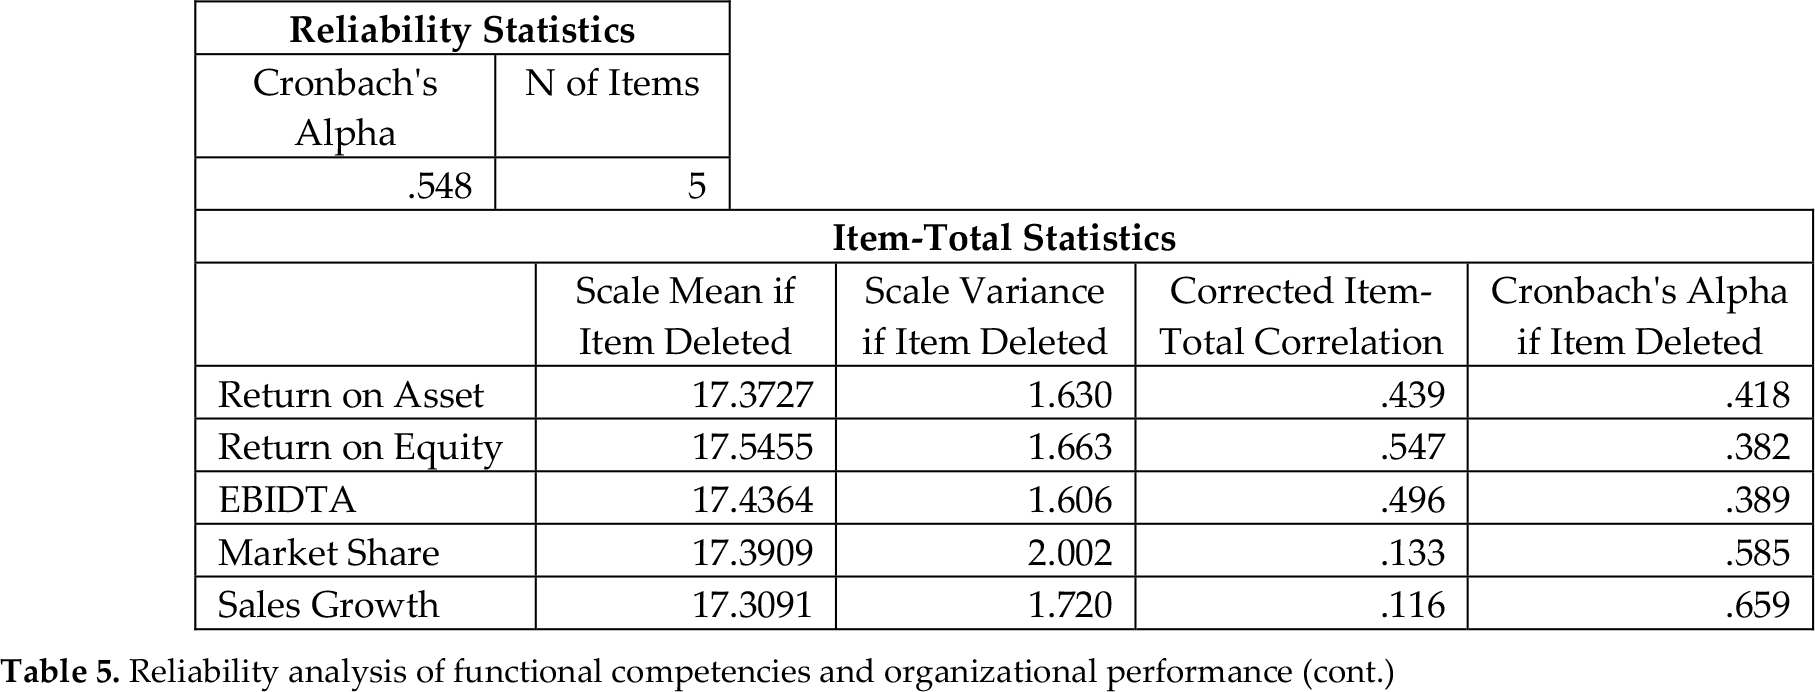
The Cronbach's Alpha was calculated for each functional and performance construct and shown in Tab.3.2. All the items in these functional constructs exceeded the item-to-total correlation criteria of 0.35. At the same time, the Cronbach's Alpha for these constructs was 0.709 (manufacturing); 0.716 (marketing); 0.757 (Logistics) and 0.735 (human resource) respectively, which indicates that they highly met the requirement by Nunnally (1978).
The Cronbach's Alpha value for the performance is 0.548 which is lower than 0.7 however this cannot be ignored in the present context. In summary, the values of item-to-total correlation and Cronbach's Alpha found for each construct indicated that each construct was strongly reliable measure.
4. Data analysis and hypothesis testing
In this research, a total twenty-two variables of functional competencies and five variables of organizational performance were identified from the literature. As suggested by Hair et. al., (1999) factor analysis should be used to analyze and create a new set of variables.
In interpreting the factor analysis solution, a decision must be made regarding which factor loadings are worth considering. Factor loading are the correlations between original variables and the factors. The magnitude at which the factor loadings are significant depends on the sample size and the tolerance of two types of errors. It is represented in Table 6. for the beneficial of the readers.
Reliability analysis of functional competencies and organizational performance

Reliability analysis of functional competencies and organizational performance (cont.)
Guidelines for identifying significant factor loadings based on sample size
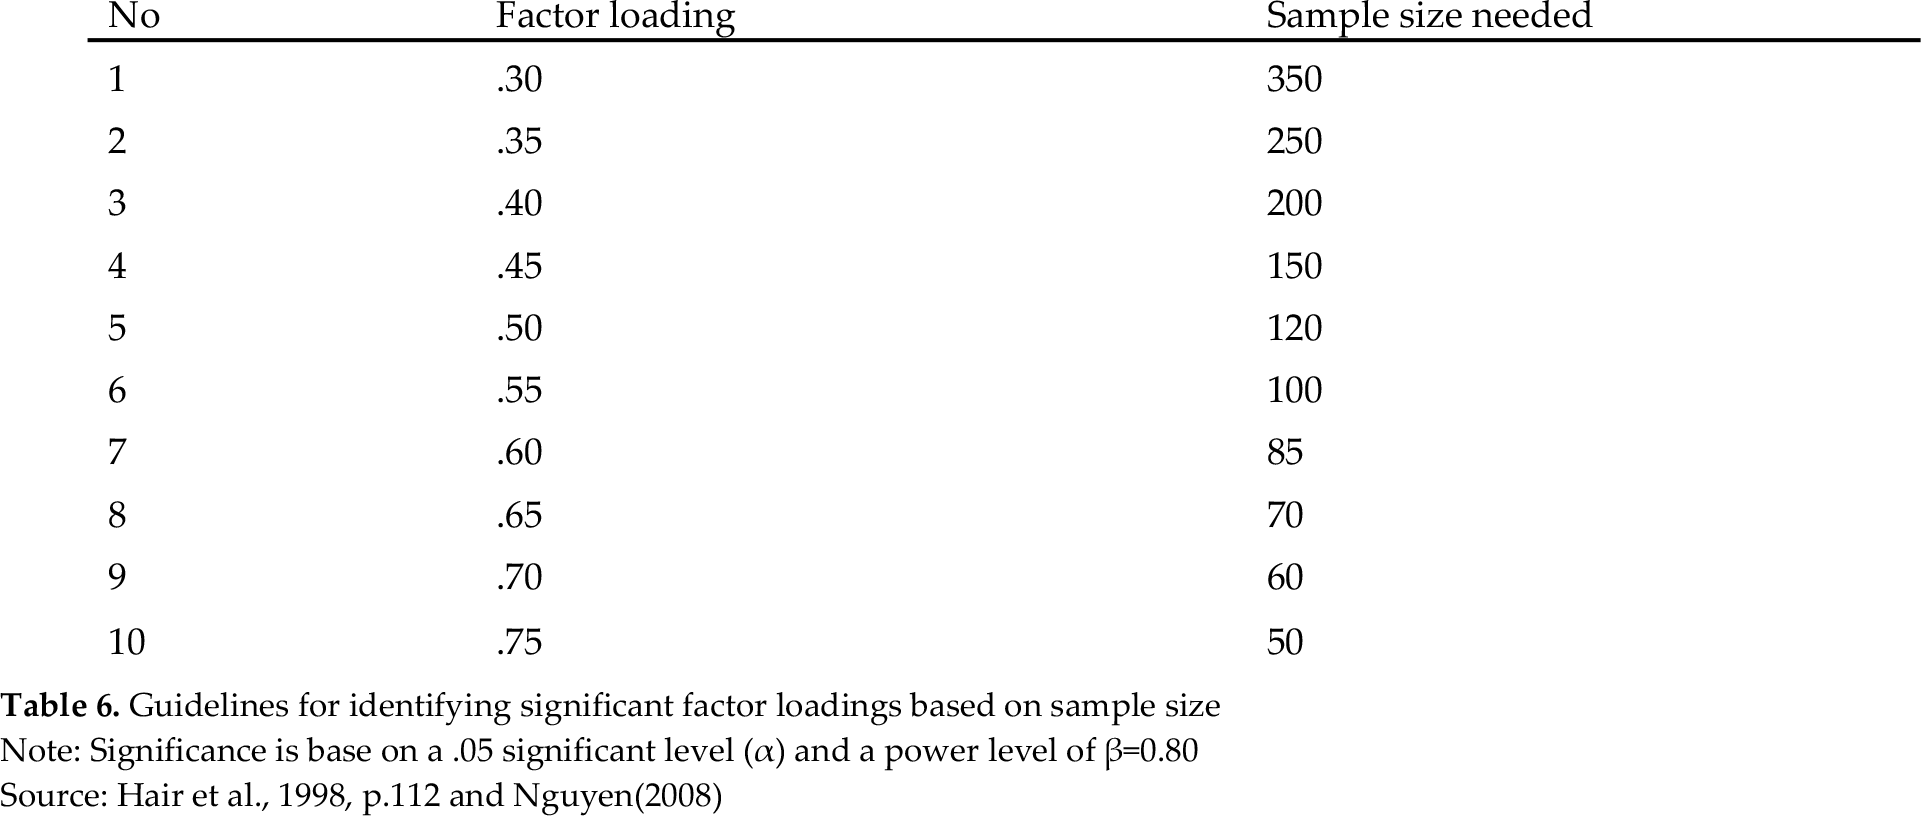
Note: Significance is base on a .05 significant level (α) and a power level of β=0.80
Source: Hair et al., 1998, p.112 and Nguyen (2008)
As shown in Table 6, for significance, a sample size of 100 requires a loading value of at least 0.55. Similarly, a loading of 0.50 demands a larger sample size of 120. Obviously, no entry is available for the sample size of 110. Hence based on researcher decision that any value between 0.5 and 0.55 will be considered.
4.1 Factor Analysis of Functional Competencies
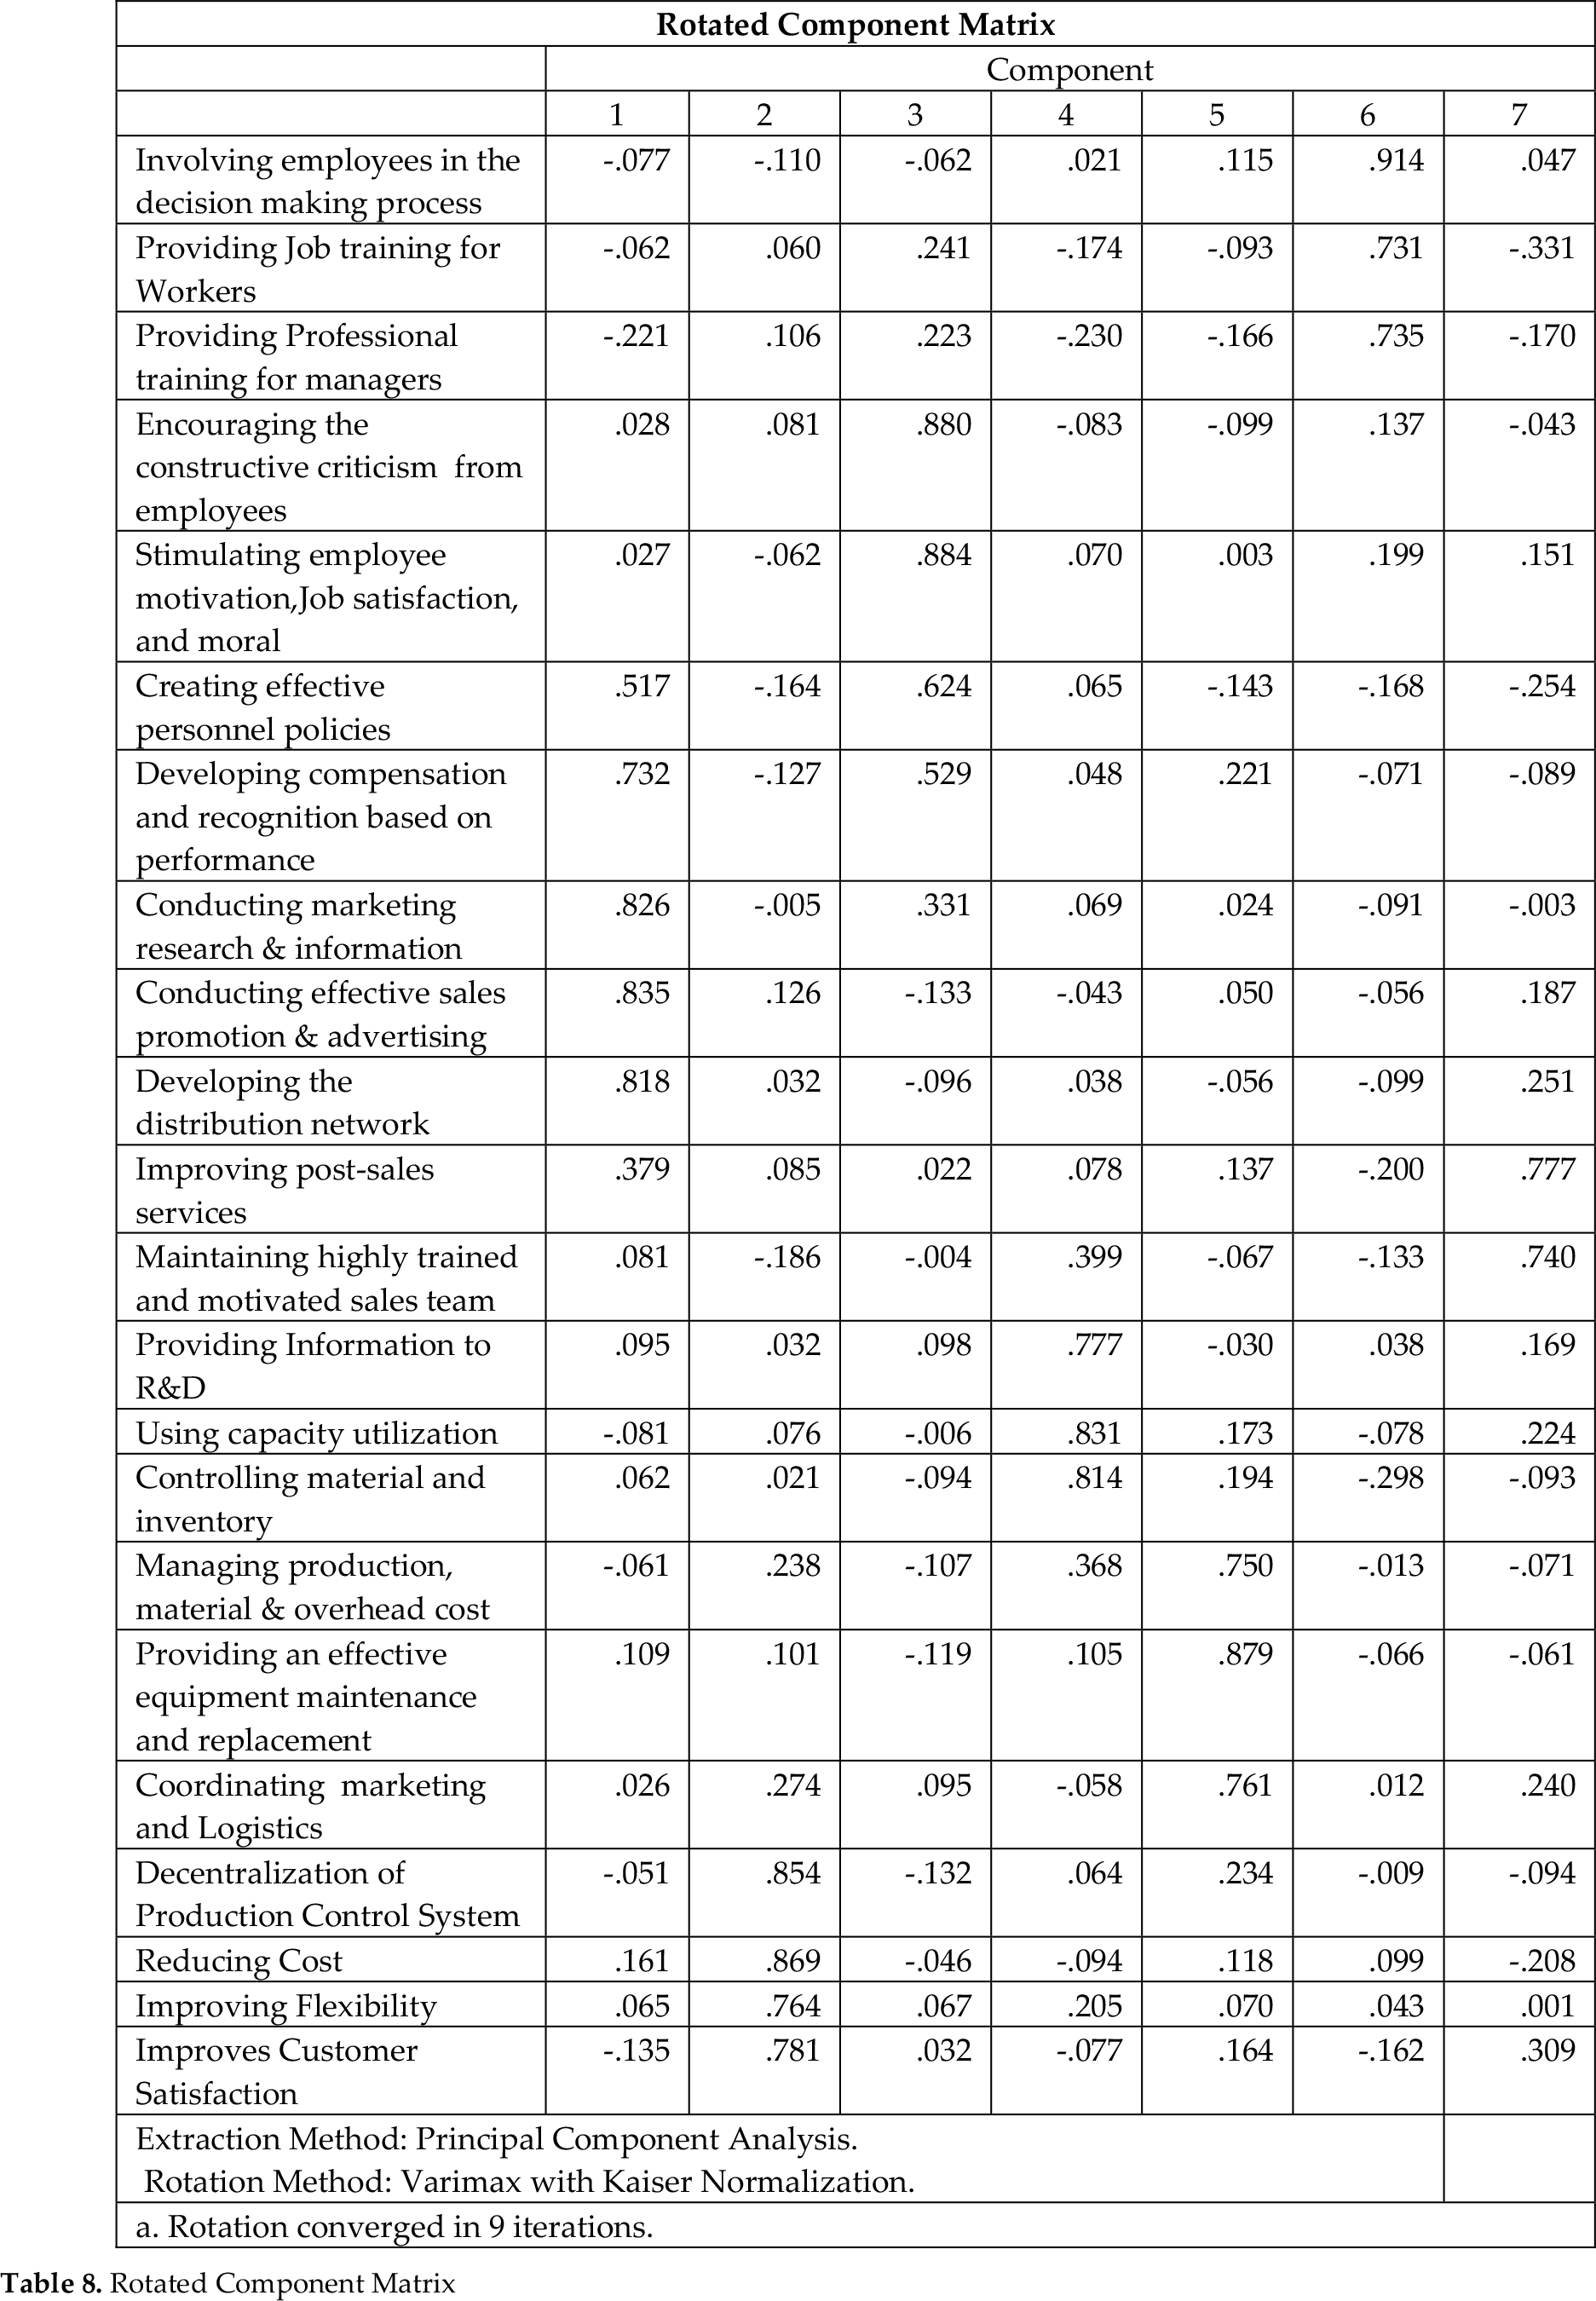
Table 7. shows that seven variables out of 22 variables explain more than 78% of the total variance. The rotated component matrix of seven variables is shown in the Table 8. The loadinds of all the variables are quite high showing strong
Total Variance Explained

Rotated Component Matrix
Communalities Matrix
Total Variance

Component Matrix

1 components extracted.
4.2 Factor Analysis of Performance variables
Manufacturing competency (X) is not significantly correlated with firm performance (Y). The model result shows that there is very weak relationship between independent variable and dependent variable (R=0.063). Only 0.4 percent of the variance in firm performance can be explained by manufacturing competency (R square = 0.004). We can conclude that there is a weak relationship between the manufacturing variable and firm performance and this relationship can be expressed as function:
Y = 4.62 −0.6 X
Here communalities matrix shows that three variables have high extraction however two variables have low extraction i.e market share and sales growth. On the other hand Tab.4.4 explains that one component has eigen value greater than one while other variables has value lesser than one, hence only one component is extracted. The Return on Asset(ROA) explains 43.5 % of the total variance.
Simple Regression Analysis:
Simple regression analysis with manufacturing competency as independent variable and firm performance as dependent variables were conducted as shown in appendix 2.
4.3 Functional competency analysis
A five-point Likert scale was used in this study to measure the competencies of different functional activities, from ‘1’ indicating very weak, to ‘5’ indicating very good. Four functional activities of manufacturing companies was analyzed including human resource, marketing, manufacturing and logistics.
5. Conclusion
These findings suggest that in order to improve firm performance (both profitability and market) manufacturing companies in India need to improve their functional competencies (manufacturing, marketing, logistics and human resource). The empirical study indicates that manufacturing competency is not significant related to firm performance. The possible reasons could be explained by many tasks in manufacturing function (‘managing production, material and overhead cost’, ‘controlling material and inventory’, ‘using capacity utilization’) with focus on cost saving and then lead to the improvement of profitability performance rather than market performance. While these other tasks identified as infrastructure development like ‘on going plant modernization programme’, ‘Controlling manufacturing process quality’ (Hill, 1994) may require time and investment and sometimes takes decades to implement (Skinner, 1969, 1985). The possible reasons for manufacturing and R&D not significant positive with profitability and market performance could be the low labor cost in India. In India, managers still prefer to best utilize relatively low labor cost rather than investing in modernization and automation. Indian managers tend to spend little money on renovating the factory or upgrading the machinery. In addition, investing in manufacturing and large investment and this will not lead to quick return (Ha, 2002). However, manufacturing companies in India should pay attention to improve the performance of operations in long run. Evidences had shown that manufacturing required large in-vestment and this will provide sustainable competitive advantage and return in the long run (Ha, 2002). Swierczek (1999) and Wiklund (1999) found that the higher proactiveness and innovation would result in the higher performance. Being innovative would bring about new products and services that would, in turn, allow the firm to perform better (Swierczek, 1999; Wiklund, 1999).
5.1 Research Limitations
There are some limitations that need to be mentioned. Future studies are likely to benefit if some limitations of the present study are examined. First, studies on samples are seldom conducted without any intention to generalize the results to the whole population to which the samples belong (Cooper and Schindler, 2001). Not all sampling techniques allow this generalization. The most known, comprehensive and pervasive technique is perhaps the simple random sampling in which each possible sample of a given size is equally like to be the one selected (Newbold, 1999). Second, perceptual performance was used in the study instead of objective measure. Although previous studies showed a positive association between objective and perceptual performance (Geringer and Hebert, 1991; Powell, 1992), the latter is not able to fully reflect the real firm performance. However, causality cannot be established without longitudinal data. Future research effort is urged to collect longitudinal data to confirm the causal relationship between four function's competencies and firm performance. Lastly, firm performance may be affected by various other extraneous variables not accounted for in this study. It would be beneficial to examine the myriad of firm performance by taking external conditions like the economic and legal situation into account.
5.2 Managerial Implications and future scope of the present study
While this study was able to provide additional insight into four functional competencies and its relationship with firm performance, it also revealed areas that would benefit from further research. First, this study focused only on four functions of manufacturing companies. Future research could thus focus on the other functions such as finance, planning, controlling.… by doing so, a better and fuller understanding on the effects of functional competencies on firm performance may be achieved. Second, there is a strong need for longitudinal research. A longitudinal analysis of a group of companies over time would provide data to address at least two research questions: (1) is there a time lag between investing in functional competencies and achieving an expected performance, and (2) is there a particular order in which these investments should be made. Third, this study failed to support the proposed hypothesis related to the relationship between manufacturing and firm performance. Hence, there is a need for further study on the influence of different manufacturing practices on firm performance. Fourth, the empirical result shows that even though there is a certain amount of disparity in performing functional competencies among companies with different types of ownership, however these differences are not significant. This result might be the result of the period in which this research was carried out. So there is an important need to investigate the differences in the future when managers had enough time to change their management styles. Finally, to be able to generalize the results of this study future research might be extended to other industries like service and to other countries both developing and industrialized.
6. Acknowledgements
Author specially expresses his thanks to two anonymous referees for their suggestions to improve this manuscript. It would be incomplete without expressing my gratitude to Editor and her Editorial team who took entire pain in coordinating with me during entire review process. It would be ungrateful on my part if I do not express my deep gratitude to my University Vice Chancellor Dr. Parag Diwan for providing all kind of support right from providing encouragement and motivation and to my respected teachers Prof. Tripti Singh, Prof. Geetika, Prof. Janat Shah, Prof. O.P.Gupta and Prof. Celik Parkan who took entire pain to support me during research. I am equally very grateful to my student Neha and Saurabh Tiwari who took great pain to support me during difficult moment of my career.
Footnotes
Appendix 1:

| Hypothesis | Description | Result of Hypothesis testing |
|---|---|---|
| H1 | There is a positive relationship between the manufacturing competency and firm performance | Not Supported |
Appendix 2:

| Regression Analysis Output: | ||||||||
|---|---|---|---|---|---|---|---|---|
|
|
||||||||
|
|
||||||||
|
|
0.0634 | |||||||
|
|
0.004 | |||||||
|
|
−0.0053 | |||||||
|
|
0.3131 | |||||||
|
|
109 | |||||||
|
|
||||||||
|
|
||||||||
| df | SS | MS | F | Significance F | ||||
|
|
1 | 0.042279867 | 0.04228 | 0.43133 | 0.512747103 | |||
|
|
107 | 10.48836233 | 0.098022 | |||||
|
|
108 | 10.5306422 | ||||||
|
|
||||||||
| Coefficients | Standard Error | t Stat | P-value | Lower 95% | Upper 95% | Lower 95.0% | Upper 95.0% | |
|
|
4.62 | 0.405214177 | 11.40021 | 3.47E-20 | 3.816236188 | 5.422816 | 3.816236 | 5.422816 |
|
|
−0.061 | 0.093353363 | −0.65676 | 0.512747 | −0.246372643 | 0.123752 | −0.24637 | 0.123752 |