
Abstract
Linguistic is the systematic study of language. Now quality doesn't always mean the “tangible attribute” of a product or service. It may also be linguistic. Thus, linguistic has applied for product design through capturing the voice of Customers. Capturing of the voice of customers has been done in different way, like Quality Function Deployment (QFD), Kansei Engineering and Kano Model regarding product design. Kano Model has two dimensional linguistic approaches, which is more voice capturing capacity than other methods. Reverse attribute study is important for more reliable product design for next actions than other attributes of Kano model i.e. attractive, must-be, one-dimensional and indifferent. Thus, this paper is exclusively study for reverse attribute. For this purpose, a reverse attribute based linguistic approach, which is run in the computer system for product design regarding Kano model aspect using threshold numbers of real consumers opinions converted into probability through fuzzy concept as an input of Monte Carlo Simulation system determining virtual customers is described in this paper.
1. Introduction
The information and knowledge added to create and maintain the product – in other words the “corporate memory” – are usually represented visually in sketches, models, (technical) drawings, and images. These representations have proved to be of value in computer aided support and have received a lot of attention in both research and practice (Kryssanov, V., et al, 2001). However, in the corporate memory a lot of linguistic information is involved as well to combine ontological and model based techniques (Bock, C., et al., 2010). The added value and the means of applying linguistic information were applied during the life cycle of a product. The early phase of the design, process ambiguity and parallel lines of thought are required, while in a later phase the information has to be precise. In our view, linguistic information is the use of words, abbreviations, vocal comments, annotations, notes and reports, which create meaningful information for designers as well as computers (Schultz, C., et al., 2009). This linguistic information is complementary to visual information and essential to create the products. Product design is concerned with the efficient and effective uses of Linguistic and logic (Korn, J. 1992). Constructing a context through procedural coding, typically involving constraints on inferential process can be applied to intonation/linguistics (House J, 2006) for product design. Seven accepted standard used to qualify a spoken text as a discourse has been suggested by Beaugrande (1981). These consist of Cohesion, Coherence Intentionality, Acceptability, Informativeness, Situationality, Intertextuality (Wiśniewski, K., 2006). This idea must be in front, when linguistics was applied for collecting customer opinions for product development. Moreover, a descriptive gap between language and experience because, even for an ideal speaker, the phenomenal content of sensory experience remains weakly ineffable in the sense that it cannot be digitally encoded in an exhaustive way, hence phenomenal ineffability (Liang, R. 2011) occurred for collecting information regarding product design. Syntactic variation and communication style can move beyond the view of variants as merely formal alternatives conveying a single meaning and co-varying with social features and formality of the situation (Serrano, M. & Oliva, M., 2011) of voices of people regarding customer needs assessment for product development.
In the beginning, voice of people / linguistic is framed for design any product. Then producer can easily proceed to the next step to frame a product. Thus, language of people is needed study on the scientific way for product design. For this purpose, many methods for analysis of customer voice have been studied for product development like, Kansei (total emotions of people regarding any product) Engineering, Quality Function Deployment (QFD) and Kano Model. The Kansei principles provide a transferable and formal method of interpreting human response to products in terms of emotional reaction (Roy R. et al, 2009). Roy R. et al, 2009 has been done a study on mobile phone by using Kansei according to following sequence, determine aim and objective of the study, select a methodology, product classification and feature selection, Kansei word collection/reduction, setting questionnaire, results of the web-based Kansei-questionnaire based on existing product, formation of a design brief, creative product design exercise, stages of the divergent/convergent creative design model and comparison of questionnaire results. In Kansei engineering, setting questionnaire is one dimensional, where linguistic terms can vary. Hari et al. (2007) and Poel (2007) have attended a drawback for considering customer requirements as an arbitrary basis in the first house of QFD. The Kano Model (Kano, N., et al. 1984) is popular for two dimensional (functional and dysfunctional) questionnaire and selection of customer requirements than QFD. Product Designers by Kano model can conceptualize and evaluate ideas of the people and making them tangible through products in a more systematic way. It is needed to combine art, science and technology. In this regards, we have studied basic linguistic, Kano model, fuzzy methods and their applications in product design. In this aspect, a Kano model based computer has been developed (Rashid, M., et al. 2010). This computer system is applied exclusively on reverse attribute in this paper for more reliable product design for more value addition purpose. Moreover, Kano model is discussed for product design in section 2. The simulation procedure and parameter setting are in section 3. Linguistics application for determining probability for the input of the Monte Carlo simulation in Product design is written in section 4. Section 5 is for conclusion.
2. Kano Model
Kano model defines the relationship between product attributes and customer satisfaction. There are five types of product attributes namely, Must-be (M), One-dimensional (O), Attractive (A), Indifferent (I) and Reverse (R). Figure 1 schematically illustrates these attributes. In Fig. 1, the upward vertical axis represents satisfaction and downward vertical axis represents dissatisfaction of customers. The leftward horizontal axis represents absence of performance (the attribute is not working/not present) that is called dysfunctional side. The rightward horizontal axis represents presence of performance (the attribute is working/present) that is called functional side.

Correlation between product attribute and customer satisfaction (adapted from Ullah & Tamaki, 2011)
Table 1 describes the meaning of Must-be (M), One-dimensional (O), Attractive (A), Indifferent (I), and Reverse (R) attribute.
Five types of product attributes for customer satisfaction

A respondent needs to answer one state out of Like, Must-be, Neutral, Live-with, and Dislike from functional side. The respondent needs to do the same for the dysfunctional side. The combination of answers determines whether the respondent considers the underlying attribute an Attractive, One-dimensional, Must-be, Indifferent, or Reverse attribute. Some combinations of answers do not make sense. This type of answer is called “Questionable” answer. This leads to a mapping called Kano Evaluation as shown in Table 2.
Kano Evaluations (KE)

A=Attractive, I=Indifferent, M=Must-be, O=One-dimensional, Q=Questionable, and R=Reverse
This method is adapted with computer using Monte Carlo simulation, which is addressed in section 3 for linguistic study.
3. The Simulation Procedure and Parameter Setting
For the simulation of customer answer is needed a method. This method is formulated in the following way by using Monte Carlo simulation principle. For this reasons, an event is a set of outcomes to which a probability is assigned. An event vector

It is important that for stopping rule of the Monte Carlo Simulation, the cumulative probability of the last event Sn is 1, i.e. CPr (Sn) = 1; then automatically stop the simulation. This formulation also guarantees that the summation of all CPr (Si) is equal to 1. Therefore, simulating Si, the probability of Si should be maintained around CPr (Si).
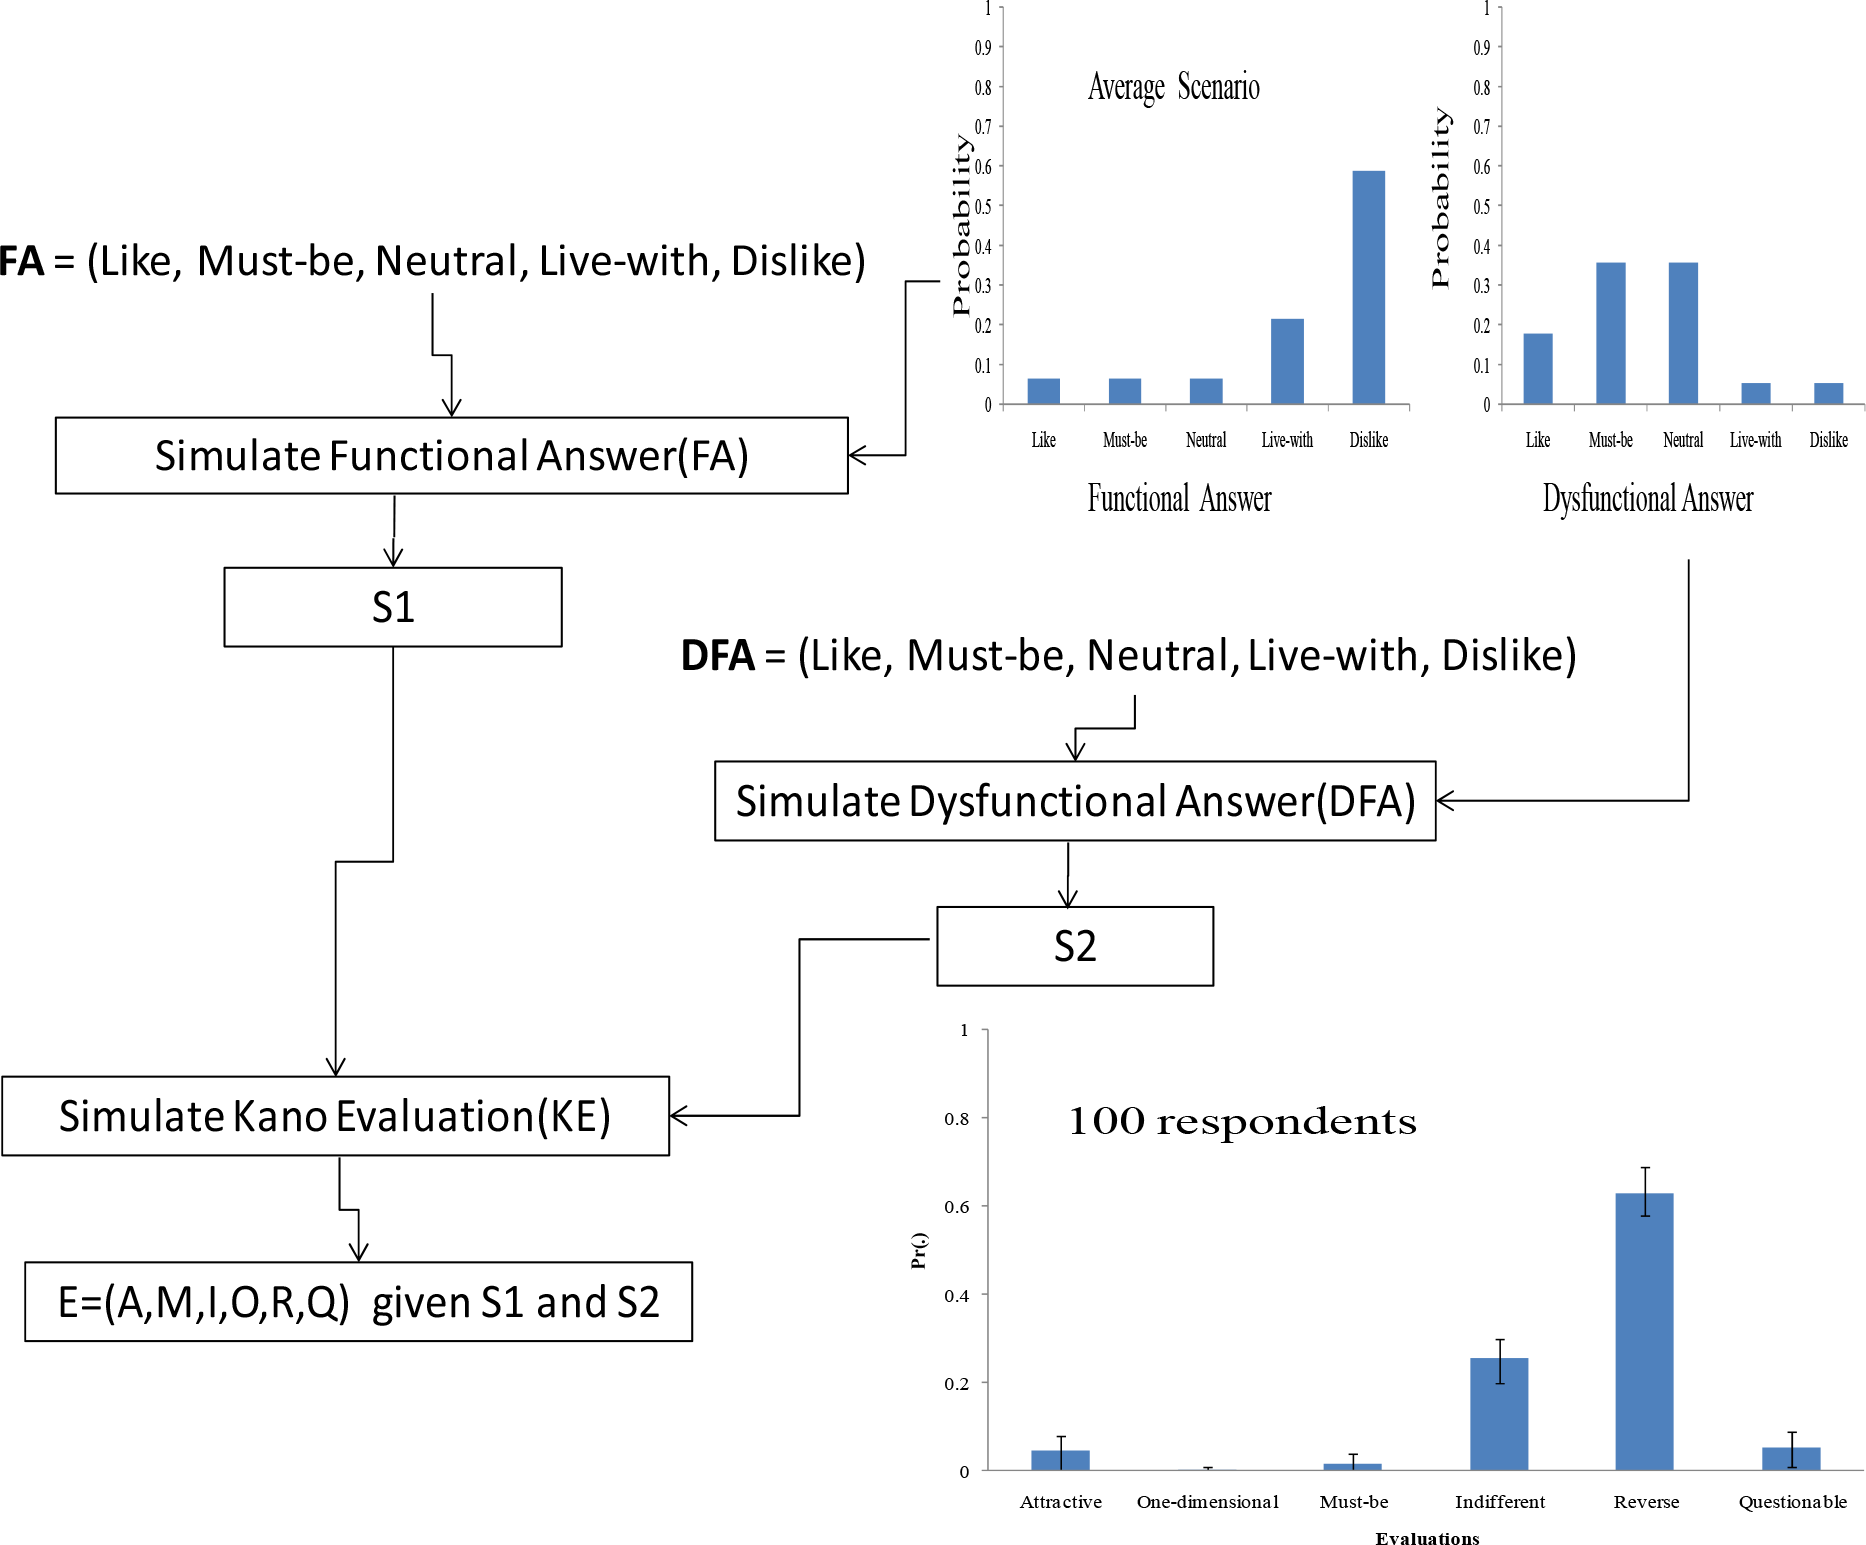
Figure 2 shows a customer need analysis model for the proposed simulation process. Five steps are involved in this process, as described below:
Step 1: Choices of FA and DFA of unknown customer, FA, or DFA ∈ {Like (L), Must-be (M), Neutral (N), Live-with (Lw), Dislike (D)}
Step 2: Generate a set of random inputs
Step 3. Simulation of dysfunctional answer of customer independently
Step 4. Simulation of functional answer of customer independently
Step 5. Simulation of customer evaluation by using combination of FA and DFA
Analysis of scenario
Generic individuals are considered and it is expected that these individuals opinion are enough Choices FA, or DFA ∈ {L, M, N, Lw, D} is considered uniform cumulative vector probability of individuals. According to step 2, a set of random inputs has been generated by using the formula=RAND () in a cell of Microsoft office Excel.
In Table 2, shows the rules of combination of functional and dysfunctional answer for customer Evaluation from Kano model. This rule was applied for simulated the unknown customer answer, where combination of answers for functional and dysfunctional parts of Kano questionnaire for choosing evaluation KE ∈ {A, O, M, I, R, Q}. Therefore, a system is developed to implement the simulation in accordance with Eq. 1, (i e., in accordance with steps 1–5).
4. Linguistics Application in Product design
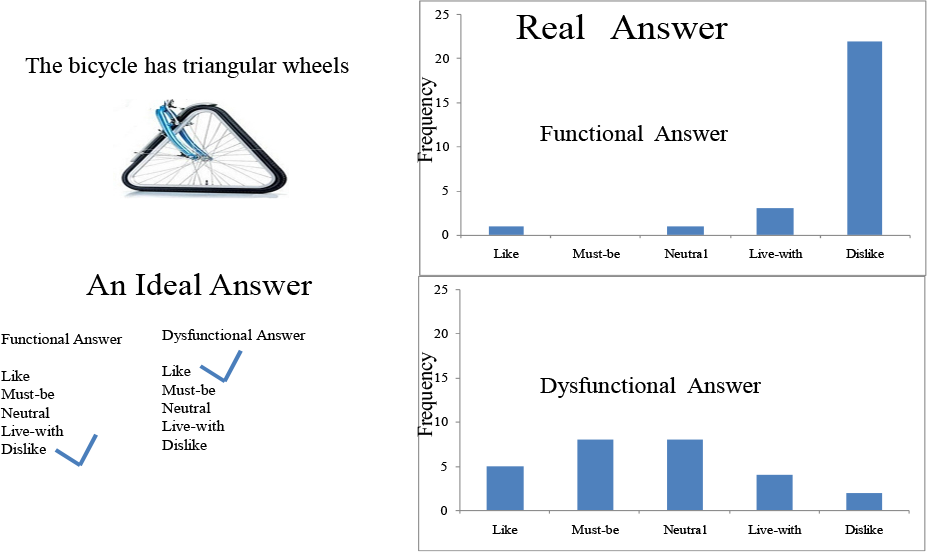
A case is considered in Fig. 3 for application linguistics. According to Fig. 3, there is a questionnaire regarding a product (bicycle) attribute (triangular shape wheel). It is well-known that triangular wheel of a bicycle is “Reverse” attribute. Therefore, the ideal answer of a respondent would be “dislike” from functional side (i.e., the bicycle should not have triangular wheel) and “like” from dysfunctional side (i.e., the bicycle should have circular wheel). This combination of answer (dislike, like) yields a “Reverse” attribute according to Kano Evaluation (see Table 2).
Ambiguity in respondents answer
In reality, respondents exhibit a rather fuzzy behavior and sometimes answer different than the ideal one. For example, see the frequency of the answers of 27 respondents shown in Fig. 3. As a result, some respondents answer makes the attribute “Reverse” some others make it “Indifferent” and so on. This raises a fundamental question that is how many respondents should be requested to know for certain that the specified attribute is a “Reverse” attribute or not.
The first step is to input the probability vectors of functional answers and dysfunctional answers. To determine the probability vectors of functional/dysfunctional answers the following procedure can be used.
As it is seen from the case shown in Fig. 3, from functional side, the respondents are “most-likely” to choose Dislike, “some-likely” to choose “Live-with” and “less-likely” to choose Like, Must-be or Neutral. On the other hand, from the dysfunctional side, the respondents are “quite-likely” to choose Must-be or Neutral rather, “some-likely” to choose Like. Although it should be ideal case most likely rather than some-likely, “Less-likely” to choose Live-with, and Dislike.
These linguistic likelihoods (“most-likely”, “some-likely”, “less-likely”, and so on) can be transformed into numerical probability using fuzzy logic. Ullah and Tamaki (2011) have afforded a fuzzy logic method, which is used here. Figure 4 illustrates the fuzzy numbers defining the linguistic likelihoods “most-likely”, “quite-likely”, “some-likely”, and “less-likely.”

Defining linguistic likelihoods by fuzzy numbers
From the linguistic likelihoods shown in Fig. 4, the average value and lower and upper limits of are determined using centroid method (Ullah, A. & Harib, K., 2006) and α-cuts at α=0.5, respectively. The results are shown in Table 4.
Numerical probability of linguistic likelihoods

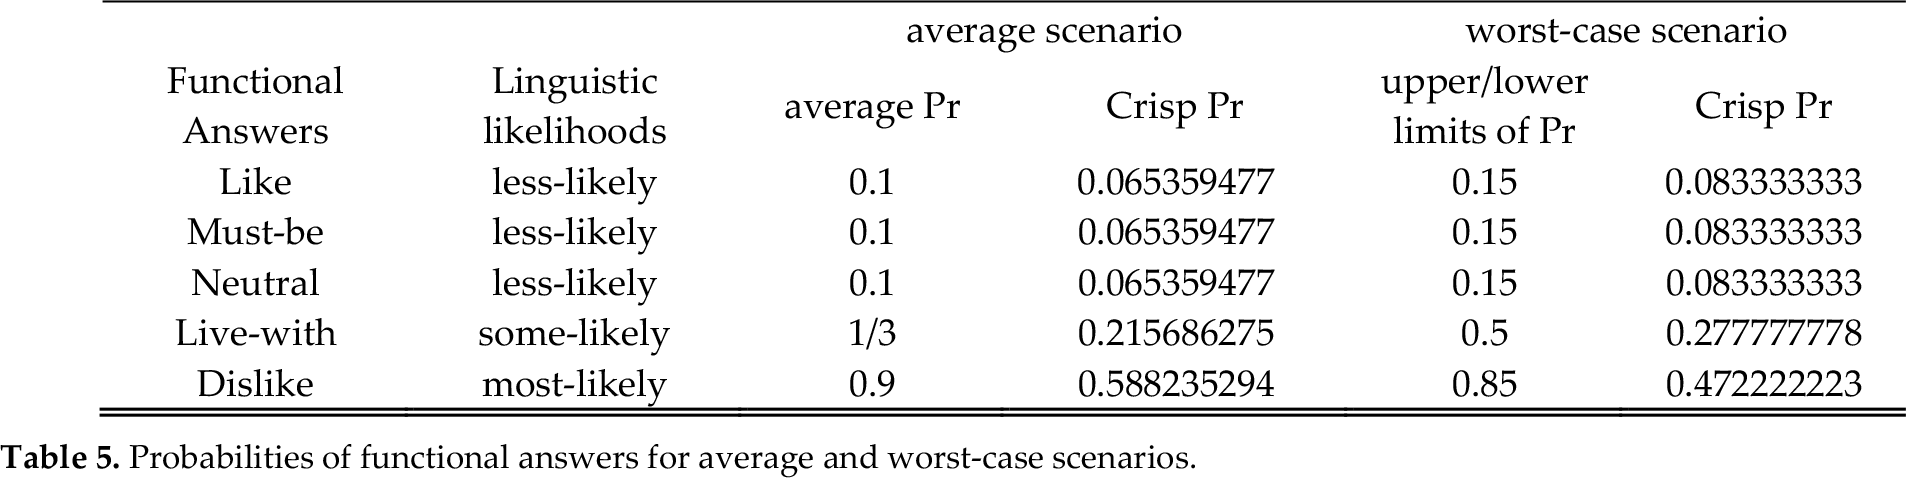
Table 5 shows the probabilities of functional answers for average and worst-case scenarios. For average scenario the average probabilities of linguistic likelihoods (shown in Table 4) are used. These probabilities are normalized to calculate crisp probabilities shown in 4-th column in Table 5. For worst-case scenario, the lower limit of most-likely is used and upper limits of quite –likely, some-likely and less-likely are used. These limits are normalized to calculate the crisp probabilities for worst-case scenarios, as shown in last column in Table 5.
Probabilities of functional answers for average and worst-case scenarios.
Similarly the probabilities of dysfunctional answers for average and worst-case scenarios are determined and listed in Table 6.
Probabilities of dysfunctional answers for average and worst-case scenarios.

The results shown in Tables 5–6 provides two sets probabilities of functional/dysfunctional answers. These probabilities are illustrated in Fig. 5. Using these probabilities a study has been carried out to determine the minimum number of respondents to conclude whether or not an attribute is “Reverse”.

Probabilities of functional/dysfunctional answers for two scenarios
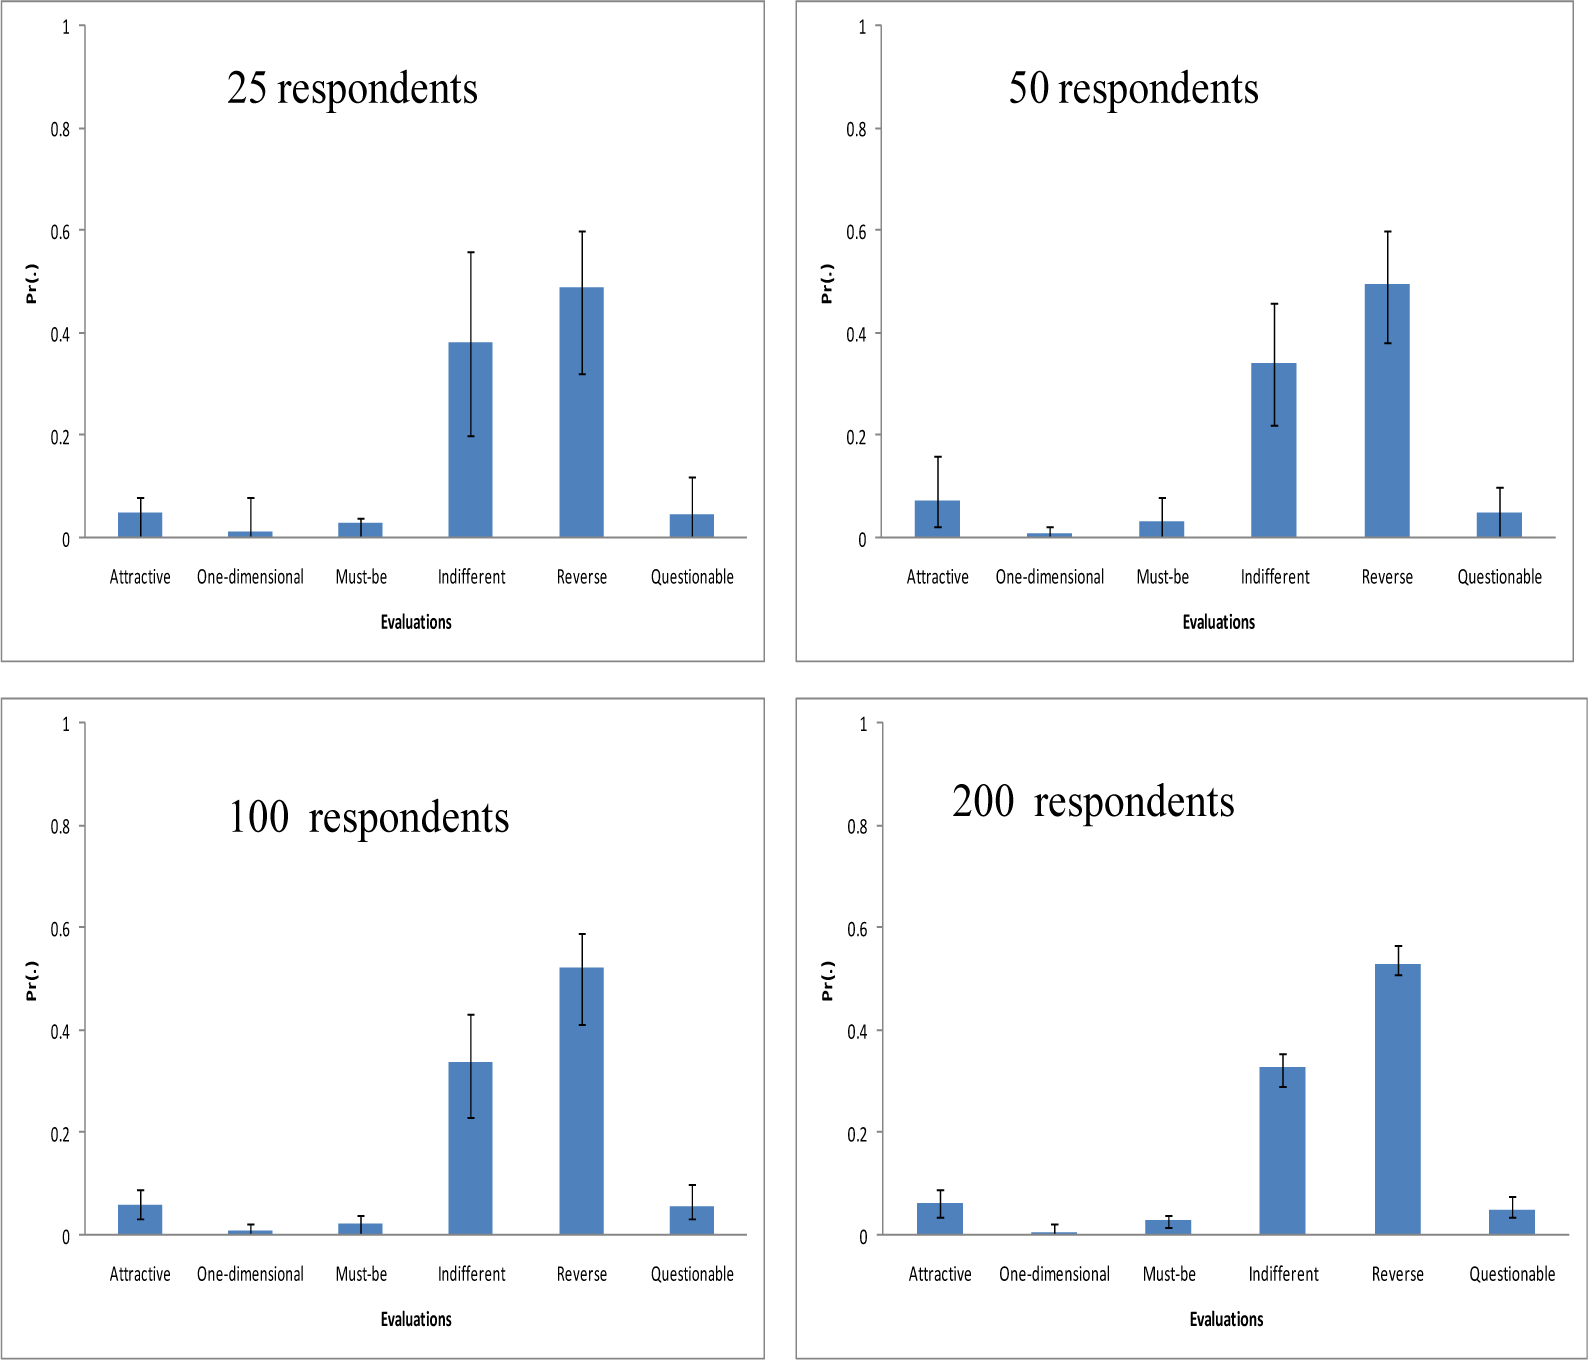
Figure 6 shows results for average scenario. As observed from Fig. 6, for 25 respondents there is overlap among the probabilities of Indifferent and Reverse. This means that using the results of 25 respondents it is not reliable to conclude that the attribute is a Reverse attribute. For the case of 50 respondents still there is an overlap between the probabilities of Reverse and Indifferent. On the other hand, when 100 respondents are used, the overlap disappears and this trend remains more or less the same for more respondents (e.g., compares the results of 100 respondents and 200 respondents shown in Fig. 5). Therefore, at least answer from 100 respondents should be collected to determine that an attribute is a Reverse attribute. What if the other set of probabilities (probabilities for worst-case scenario) is used?

Number of respondents versus Kano Evaluation for average scenario
Figure 7 shows the results for the case. In that case 25 respondents it is not reliable to conclude that the attribute is a Reverse attribute.
Number of respondents Versus Kano Evaluations for worst case scenario
For the case of 50 respondents still there is an overlap between the probabilities of Reverse and Indifferent. On the other hand, when 100 respondents are used, the overlap appears also in the worse case. This means that there is tie between Indifferent and Reverse, there should be considered a Reverse attribute. Otherwise Indifferent probability should have been much higher than that of Reverse.
According to the above results it can be completed that if the answers of at least 100 respondents should be considered a Reverse attribute. This working standard can be used as a guideline while distinguishing a Reverse attribute from others in all kinds of products. This computer system on Kano model aspect can also support a product development team by providing an answer to the question: minimal how many respondents should be asked to determine whether or not an attribute is Attractive (Rashid, M., et al. 2010e), Must-be, One-dimensional or Indifferent in accordance with Kano Model. Exactly it is found that at least 100 respondents should be requested to verify for a Reverse attribute for triangular wheel of bicycle.
5. Conclusion
In this way, Voice of customers/Linguistic can be captured by the computer system for product design. The depth understanding of linguistics can bring more suitable product for customers. Suitable products can give satisfaction of the customer/people through avoiding reverse attribute. Reverse attribute study is important for reliable product design. For the reason that if any reverse attribute, if come any product, it will be hampered the full business system. Therefore, reverse attribute of the product of the business cannot obtain competitiveness and profit.