
Abstract
To realize autonomous navigation of intelligent robots in a variety of settings, analysis and classification of places, and the ability to actively collect information are necessary. In this paper, visual data are organized into an orientation histogram to roughly express input images by extracting and cumulating straight lines according to direction angle. In addition, behavioral data are organized into a behavioral histogram by cumulating motions performed to avoid obstacles encountered while the robot is executing specified behavioral patterns. These visual and behavioral data are utilized as input data, and the probability that a place belongs to a specific class is calculated by designating the places already learnt by the robot as categories. The naïve Bayes classification method is employed, in which the probability is calculated that the input data belong to each specific category, and the category with the highest probability is then selected. The location of the robot is classified by merging the probabilities for visual and behavioral data.
The experimental results are as follows. First, a comparison of behavioral patterns used by the robot to collect data about a place indicates that a rotational behavior pattern provides the best performance. Second, classification performance is more accurate with two types of input data than with a single type of data.
Introduction
Environment recognition technology, which allows an intelligent robot to recognize a given environment, is necessary to enable the interaction technology by which robots can coexist with humans and to allow their use in the fields of home service, education, and entertainment. The environment recognition function is the most fundamental component of such a technology, and environment recognition data can be utilized as basic information in fields such as context reasoning, setting up robot travel paths, travel control, and SLAM (Simultaneous Localization and Mapping).
In many previous studies, place classification has been accomplished by using a visual sensor capable of obtaining a large quantity of information. However, methods that utilize only a visual sensor are beset by uncertainty due to internal and external discrepancies, such as changes in light and noise input. Moreover, the various complicated algorithms developed to solve this problem entail significant computational costs for multi-step convolutions [1]. Therefore, techniques are required for classifying and recognizing places using additional sensors to complement the limits of the visual sensor [2][3][4][5][6]. The limits of a visual sensor can be overcome by adding data such as the distance from obstacles, collisions with obstacles, and the slope of the floor, all of which can be obtained from the visual sensor. However, this approach collects place information passively, and the robot can travel only along a planned path, or be operated by a human. In the absence of place information, it would be difficult for the robot to recognize a place.
Eventually, some intentional action is required to cope with changes in the environment and to collect place information. This suggests a search of past information to recognize a place, and also more active acquisition of place information by observing and experiencing a place while performing movements.
Here, movements that enable active information collection for place classification will be developed, together with a place classification technique with low computational complexity and high accuracy, using a simple image-processing technology that is less affected by lighting.
Behavioral patterns for a robot are defined to actively classify places, and a classification procedure is suggested, based on the information obtained by the robot while executing these behavioral patterns. A behavioral pattern is first defined to review a place. The robot then reviews its location by executing the predefined behavioral pattern to observe and experience the place. By defining and comparing 3 types of behavioral pattern (rotational, rectangular, and random), the best behavioral pattern is determined.
The data obtained during the robot's execution of the behavioral patterns are recorded continuously, and are defined as either visual or behavioral data. Visual data express the overall characteristics of an image, and can be converted to a set of straight lines via the Hough transform. The orientations and magnitudes of these lines are calculated, and an orientation histogram is constructed by cumulating the straight line components[7]. Behavioral data are obtained by recording the movements of the robot to avoid walls and obstacles while executing a given behavioral pattern. A behavior histogram is constructed by designating travel commands such as “go straight,” “turn left,” “turn right,” “stop,” “back up,” and “bumper impact” as the bins of the horizontal axis, and cumulating the number of times each command is carried out.
The naïve Bayes classification method is used to classify places in terms of these two types of data [8]. This technique calculates the probability that an item belongs to each specified category, and then selects the category with the highest probability. In the present study, the major units of the horizontal axes in the orientation histogram and the behavior histogram are defined as key points that represent the orientation angle and the movements performed by the robot. These two histograms define the visual and behavioral data for place classification. After designating the places already learnt as categories to be classified, the probability that the data belong to each specified category is calculated, and the category with the highest probability is then selected. The location of the robot is classified by merging the probabilities for the visual and behavioral data. Finally, a specific technique for classifying the given location as a relevant place is suggested.
Related Work
This section contains a brief review of existing research on active behaviors executed to collect place information. References relevant to place classification are emphasized, and the primary techniques used in the cited studies are described. Particular attention is paid to place classification studies that use various sensor types to obtain different types of information, and studies in which specific behaviors are executed to determine peripheral environments.
Sensory Motor Coordination
In Sensory Motor Coordination (SMC), an animal engages in physical behavioral reactions according to information obtained from its perceptual organs in a given environment [9]. The movements comprising the animal's actions are generated by muscle contraction and relaxation produced by electrochemical signals, and these movements can be explained in terms of changes in the environment and the perceptual organ that recognizes these changes.
SMC can be applied to behavior-based robotics. This is the basic concept for behaviors executed by a robot, and also a basic pattern of higher level learning and reasoning. In general, a robot's response to sensor stimulation and the classification of sensor stimulation in terms of the robot's behavior can be accomplished via SMC. This means that if a robot is following a pre-trained behavior pattern and encounters an obstacle that is not pre-trained, the robot classifies the unknown obstacle in a manner appropriate to the behavior it is currently executing, thereby learning it. This was demonstrated by Pfeifer in a travel experiment in which the sizes of certain objects from a group of familiar objects were manipulated, and the robot was permitted to travel among these objects and classify the manipulated objects until its mode of travel was appropriate [10]. An SMC-based robot can execute a behavior and react to stimulation from the environment, and learn by classifying the stimulation on the basis of the behavior being executed. Active behavioral patterns are defined by incorporating the SMC concept, and are executed to collect information for place classification.
Place Classification Method
In the robot-installed sensor-based method, a robot is equipped with sensing devices, such as visual sensors and distance sensors, to classify places via information obtained while traveling. This technique can be utilized without external devices in an indoor/outdoor environment, and provides input suitable for use as high-level knowledge, such as circumstance recognition and reasoning, depending on the available information. Among the sensors commonly employed, visual sensors have attracted particular interest because of their capacity for gathering information in quantity.
Place classification methods based on visual sensors typically employ a camera to obtain images in real time, process information such as size, location, and color from the images, and finally use this information to classify the place. Much ongoing research of this type has been devoted to finding a technique for recognizing natural or artificial land markers in a place, for ontology representation of domain knowledge, and as context information on pre-trained places or objects.
Recognition methods for landmarks classify a place by predefining the place to be relevant to a designated landmark [11][12][13][14][15][16]. Natural landmarks designate physical objects in a place, while artificial landmarks are artificially preinstalled in a fixed pattern. After feature information on the underlying physical object has been saved to a database, a landmark is recognized by extracting and matching these features, using a technique such as SIFT (scale-invariant feature transform)[1], and the object is identified as a predefined place based on the relevant landmark. Assuming that lighting is constant and a robot can be placed exactly where it can recognize a physical object, good place classification, place recognition, and object recognition can be expected.
Rottmann et al. proposed a procedure for semantic place classification, using metric data from a laser range sensor and semantic information on recognized objects and humans [2]. They suggested the Adaboost model, which contains probabilistic models for low-level features up to high-level inference. In this way, they were able to classify more categories, such as kitchen, office, and laboratory.
Constructing a knowledge system with ontology representation provides a complementary method in cases of scene recognition failure or lack of learning data [17][18][19]. Such a procedure is also capable of classifying a place even when there is no learning data in the database. However, as clustering classifies target recognition data only after all the data have been collected, it is difficult to use in cases in which the data occur in sequence, and hence should be classified in real time. That is, the technique focuses more on place classification from small amounts of data than on real-time properties.
Another method for place classification in terms of context utilizes the context information of a pre-trained scene [20][21][22][23]. This procedure can overcome ambiguity caused by blurring of images, camera noise, and similarity of environment generated by robot movement, and can also enhance recognition accuracy. As this technique is based on the idea that the component factors of an image provide related information about a physical object, and specified place-forming relations do not exist independently or arbitrarily, it could provide more accurate place recognition by including place context, layer context, and time context in the analysis.
Definition of Robot Action
Sensory Motor Coordination
To experience a place means that a robot actually performs actions in that place, and acquires knowledge or functions from the experience. Specific patterns are not required for a traveling robot that can sense obstacles using a distance sensor. However, a robot could acquire more reliable information through direct experience, such as actual collisions with obstacles and the actions taken to avoid them, instead of using a distance sensor.
In this case, to actively acquire information in its current location, the robot must travel according to a given pattern or format. Consequently, the movement instructions that drive the robot, based on positions and orientational angles on a map, are obtained from the robot's mobility model, and various behavior patterns are defined in this paper.
Definition of Robot Movement Instructions
Place data are collected using a differential drive robot with a collision sensor, as shown in Fig. 1. This robot is composed of a single forward-facing camera, as shown in Fig. 1(a), and 7 collision sensors, as shown in Fig. 1(b).
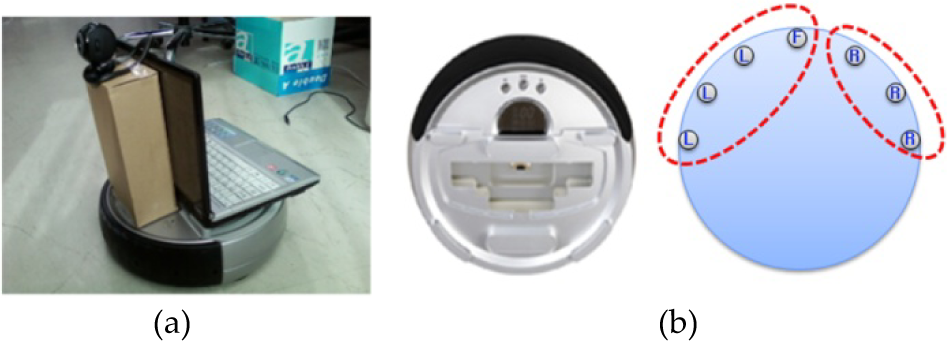
Robot with collision sensor. (a) Two-wheel robot with Web camera, (b) configuration of collision sensors.
All actions performed while traveling are saved as traveling information, and are utilized to classify places. The instructions must express the operating conditions. Accordingly, rotational movement, backward movement, stopping, and input from the sensors are defined as movement instructions, except for operating conditions that follow previously defined behavioral patterns.
Based on the position and directional angle of the robot acquired from the robot mobility model, three kinds of behavioral pattern are defined, as illustrated in Fig. 2.

Robot behavioral patterns. (a) Rotational pattern, (b) rectangular pattern, and (c) random pattern.
The first behavioral pattern is a rotational pattern. In this case, the robot travels in a circle from the starting point, covering 3 circuits with different radii. If the robot encounters an obstacle while traveling in a rotational pattern, it moves backward to avoid the obstacle and rotates through a certain angle (π/2) relative to the opposite side of the sensor that recorded the collision. The robot then resumes its rotational course. The robot alters its path to avoid the obstacle, and then continues along the remainder of the altered path.
The second behavioral pattern is a rectangular traveling pattern. In this case, the robot follows a rectangular path from a starting point. After moving forward in a straight line, the robot rotates through (π/2) in place and then continues to move forward. After completing three rectangular motions, the robot ceases all movement. If the robot encounters an obstacle during rectangular travel, it moves backward to avoid the obstacle and rotates in place. The robot then resumes its rectangular course in a manner similar to the procedure for a rotational course. For example, if the robot encounters an obstacle after traveling halfway, it changes the rectangular course after moving backward and turning a certain angle (π/2), then resumes the path of the remaining alternative two and half rectangular motions.
The third behavioral pattern is a random pattern. If the robot encounters an obstacle while traveling in a straight line, it rotates through a randomly selected angle to avoid the obstacle regardless of the collision sensor's direction when it collided with the obstacle, and then resumes its movement in a straight line. The robot simultaneously accumulates visual and behavioral data on a given place while executing this type of behavioral pattern. The visual and behavioral data acquired while the robot executes a single behavioral pattern in a particular place can be expressed as a set of feature vectors, to be utilized as information on the observation and experience of that place. In this paper, 3 types of behavioral pattern are defined. Each pattern is executed and classified at a given place, the results are compared, and the most reliable behavioral pattern can thus be determined.
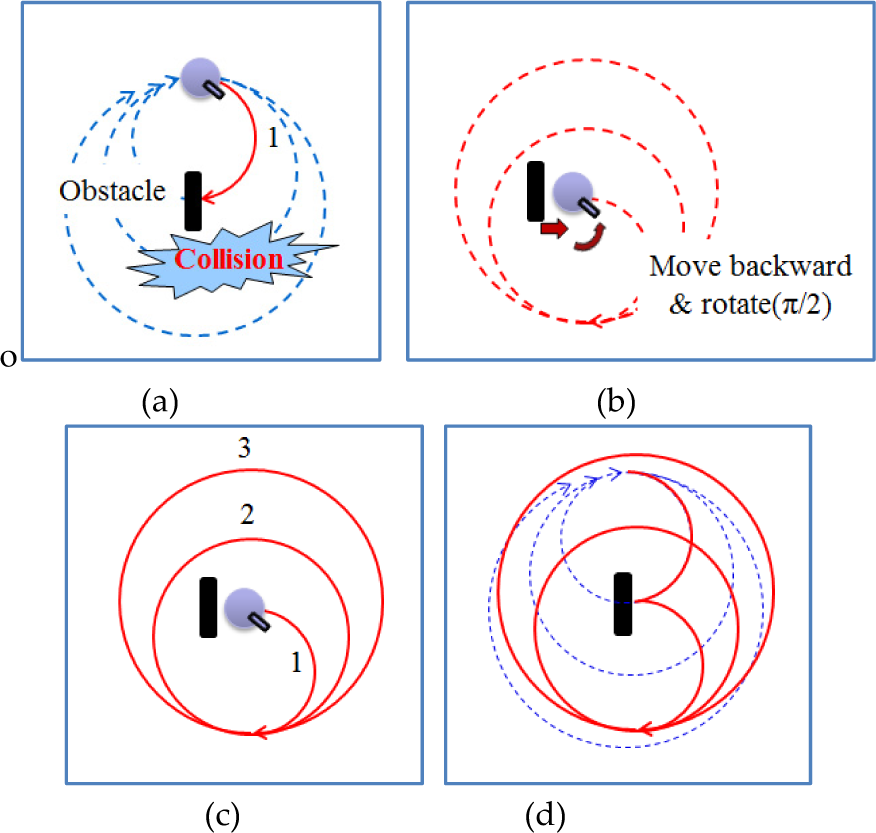
An example of path-altering, using a rotational pattern (dotted blue line: the previous path, which encounters an object; solid red line: the actual trajectory taken; dotted red line: the alternative path). (a) The robot encounters an obstacle, (b) it moves backward and turns a certain angle (π/2), and (c) then resumes the alternative path of the remaining two and half circular motions. (d) Comparison of the previous path and the robot's actual trajectory.
Target Places
A “place” is a location where a physical object exists or something occurs. The place may include many objects, such as a room, or relatively few objects, such as a corridor. People define the purpose of a place in advance, and configure the place as appropriate for the purpose. People generally execute behaviors in a place on the basis of previous experience [24]. In addition, people can reason and classify the purpose of a place by utilizing previous and newly obtained information, even in a new place. Therefore, when a robot encounters a new place, it must observe and experience the place for itself to make a judgment.
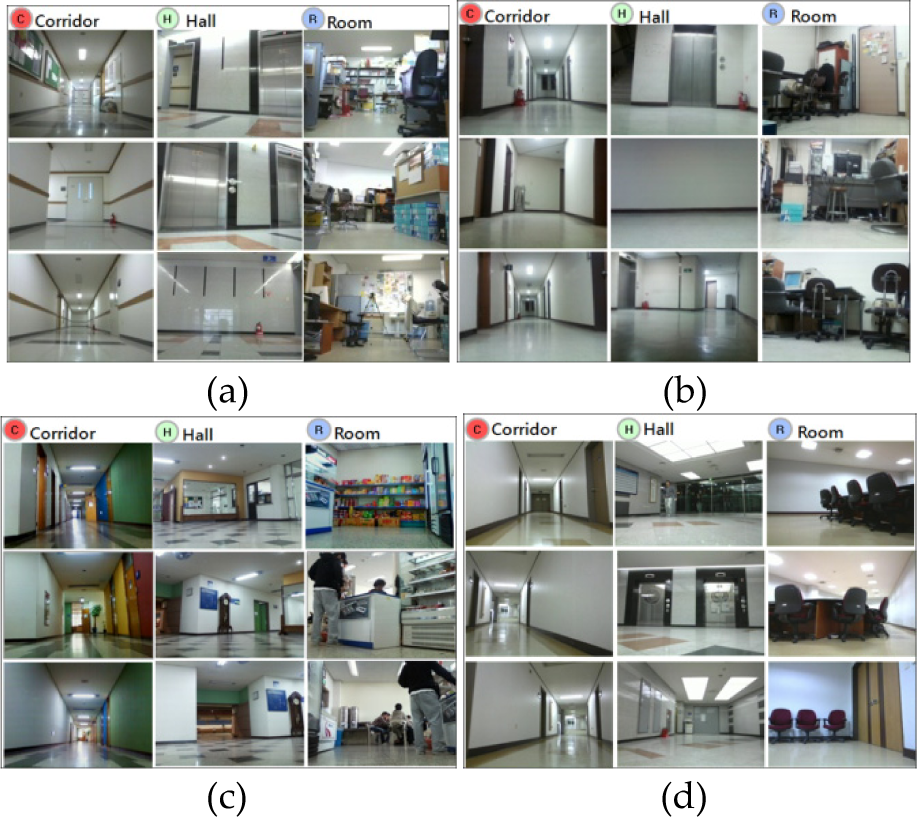
Fig. 4(a) shows a corridor. It is designed for people's movement, and is not complex, generally consisting of simple walls, a floor, and a ceiling. Fig. 4(b) shows a room, laboratory, or office, a place in which people live and work. There are various appliances for functionality, and hence the space for movement is sometimes narrow. Therefore, a robot should travel slowly and with care in such a place. The room is composed of walls, a floor, and a ceiling, and is similar to a corridor in this respect, but also has complicated features, possibly including bookshelves, a table, and a whiteboard. Fig. 4(c) shows a hall or meeting place. Many people typically move through a hall at the same time to enter a building, and meetings are sometimes held there. Therefore, the hall includes some physical objects, such as a bulletin board, as well as high walls, a floor, and a ceiling.

Sample images of places that are objects for place classification: (a) corridor, (b) room, and (c) hall.
The visual and behavioral features of a place are reviewed in terms of the place's characteristics, and a place classification technique based on images and behaviors is proposed in this paper.
Extraction of Straight Line Components from an Image
The straight line components in an image are extracted via the Hough transform, on the assumption that the general features of the image are straight lines created at the crossing areas between ceiling and wall, wall and floor, and the combination of gates and various appliances. The directionality of the extracted straight lines is determined, and is used as a feature to distinguish the place.
The Hough transform is a technique for extracting straight lines, inducing the equations of the lines by transforming them to the parameter space. The boundary of the image is first extracted using a Canny edge detector, and then the straight lines are extracted. The straight lines extracted via the Hough transform do not have directionality, and their directionality is determined by designating the starting and end points of each line in terms of the center of the image.
The center of the image is defined as the origin of coordinates, and the distance between two points on a straight line is calculated as shown in Fig. 6. By comparing the distances between the origin and the two points, the closest and most distant points are designated as the starting and end points, respectively. The length and directional angle of the straight line are then calculated.

Example of straight lines extraction from an image.

Example of straight lines extraction from an image.
The straight lines extracted above are regarded as vectors with directionality. These vectors have an angular range of 0∼2π, are distributed over the image, and play the role of general features. To use the various vectors comprising an image as a single set of data, an orientation histogram is constructed, which accumulates the distribution of vectors in terms of direction.
First, an arbitrary set of straight line vectors in the image will be denoted by X = {x0, x1,…, xM–1, x
M
}, where M is the number of lines. The set of major units on the horizontal axis of the orientation histogram is denoted by V = {v1, v2,…, vN–1, v
N
}, where N is the width of a major unit, and has a value of 18. An orientation histogram based on this definition can be constructed as follows:

where f satisfies the condition 0 ≤ f ≤ N. When v
f
has the same value as the quotient obtained when the straight line is divided by a constant δ, the value of the corresponding c
fj
is increased by 1. The constant δ has the value 10 in this paper. Thus, by applying Eq. (1) to all of the vectors in an image, the following histogram is constructed:

An orientation histogram constructed in this way is shown in Fig. 7.
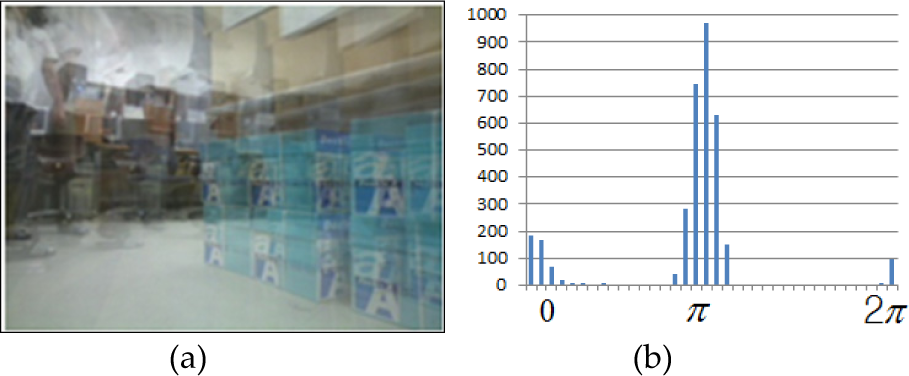
Construction of orientation histogram: (a) cumulative image, (b) histogram.
Fig. 7(a) is a cumulative image compiled while the robot was observing the place. Fig. 7(b) is an orientation histogram constructed by accumulating the vectors acquired from the observations according to directional angle. The straight lines are extracted from the sequential images obtained while performing a single action, and are utilized as behavioral data for the place.
Behavior Histogram
If a robot encounters an obstacle while executing a behavioral pattern that has been defined in advance for searching a place, the robot performs certain movements to avoid the obstacle.
At this time, the robot calls a movement instruction to carry out the appropriate movement for the situation. By saving the frequencies of the instructions that are called, the robot has access to information that it has experienced in that place. In this paper, the robot recognizes obstacles by using bumper sensors. This is used to define the behavior histogram, which is constructed as follows.
First, the 6 robot movement instructions are organized into a set of behavior histogram bins, E = {e1, e2, e3, e4, e5, e6}, where e1 is the pattern being executed, e2 is a right turn (RT), e3 is a left turn (LT), e4 is a backward movement (Back), e5 is stop (Stop), e6 and is the collision sensor (Bumper).
The sequence of movements that constitute the behavior pattern being executed by the robot is denoted by B = {B0, B, …, Bp–1, Bp}.
Based on this definition, the movement instructions received by the robot are expressed as in Eq. (3), by accumulating on the vertical axis according to the major unit of the horizontal axis of the histogram:
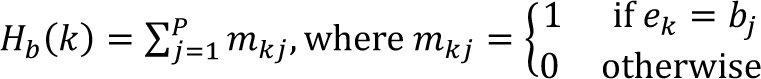
where k satisfies the condition 1 ≤ k ≤ 6. After the current movement instruction is confirmed, the value of k is increased by 1. Thus, the histogram can be constructed as in Eq. (4), by applying Eq. (3) to the acquired movement instructions:

Fig. 8(a) shows a place where the robot executed a rotational traveling pattern, and Fig. 8(b) shows the resulting behavior histogram. The instructions received during a single action are recorded in the histogram, and are used as behavioral data.

Behavior histogram: (a) place traveled and (b) behavior histogram.
Place Classification Method
The purpose of place classification is to determine the class to which the acquired information belongs based on a predefined set of categories. The information should be similar to the pattern of the relevant category.
Numerous classification studies utilizing various procedures have been reported, including the naïve Bayes method and SVM. Each technique has relative advantages and disadvantages. The naïve Bayes approach is simple and responsive, but slightly less accurate than other methods. SVM has comparatively higher accuracy, but its algorithm is complex. The results generated by a naïve Bayes classifier and SVM are compared in Section 6.
In this paper, the naïve Bayes method is used to classify place. Assuming a polynomial constructor using a given set of learning data, this procedure classifies each object into the category with the highest inclusion probability. Here, the K-means algorithm is used to calculate the polynomial constructor in advance, by classifying the learning data obtained in a given place.
Analysis of Visual and Behavioral Data
Fig. 9 shows the orientation histograms, cumulative images, and behavior histograms acquired while executing the rotational pattern in different places.

Orientation histogram and behavior histogram.
For the corridor, the orientation histogram is very simple. However, the behavior histogram shows that the robot collided with a wall due to the narrowness of the corridor, and then performed some actions to avoid the wall. For the room, numerous straight line vectors were extracted. In addition, the behavior histogram shows that the robot collided with an obstacle, and then performed a number of actions to avoid the obstacle. For the hall, more straight line vectors were extracted than for the corridor, but fewer than for the room. The behavior histogram shows that the robot executed a rotational traveling pattern without colliding with any obstacles, because of the spaciousness of the surroundings. Thus, the respective histograms of the three places have different features, which can be used as information for classification via the behavioral histograms.
The Naïve Bayes Method
The naïve Bayes method calculates the probability that random information belongs to each specific class, and then selects the class with the highest probability. These probabilities are calculated using
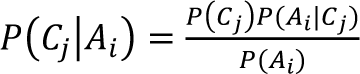
The above formula represents the probability that information A
i
from a set of information A = {A0, A1,…, A
n
} belongs to class C
j
. P(A
i
) is the probability that information A
i
will be extracted from the set of information, and P(C
j
) is the probability that class C
j
will be extracted from the set of classes. P(A
i
|C
j
) represents the probability that C
j
is the class to which A
i
belongs. The naïve Bayes method selects the class with the highest calculated probability among P(A0|C
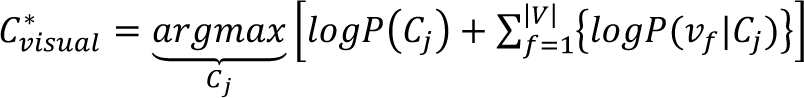
j
)P(A1|C
j
)⃛P(A
n
|C
j
) for given information A. This class is generally expressed as follows:

During the search for C*, P(A i ) has a constant value, and can be omitted from the calculations. We propose to select the place with the highest probability of being the robot's location by applying the naïve Bayes method to the respective visual and behavioral data, and then merging the probabilities.
The visual data obtained while executing a given behavior pattern can be expressed in terms of the directionality of the straight line components extracted from the image associated with the histogram. In the orientation histogram, the major unit of the horizontal axis can be used to define key points representing the relevant range. If these key points are denoted by V = {v0, v1, …, v N ), a set of representative key points can be defined.
Let I = {I0, I1, …, I
i
} be a set of visual data for a given place, and let the number of feature vectors accumulated at key point v
f
be denoted by H
v
(v
f
,I
i
) for each visual datum I
i
. Then, the following method is used to classify visual data obtained in time:

To avoid the case in which some factor

The probability
By using Eq. (9), the greatest a posteriori score for the visual data of a place can be obtained.
Behavioral data (as defined above) are organized into a behavior histogram based on 6 movement instructions to the robot. Let E = {e1, e2, e3, e4, e5, e6} denote the major units of the horizontal axis of the histogram, and let B = {B0, B1,…, B
k
) be a set of behavioral data. The number of instructions accumulated for each movement instruction of each behavioral datum is denoted by H
b
(e
g
,B
k
). The following method is then used to classify behavioral data obtained in time (as in the previous subsection):

To avoid the case in which some factor

In addition, a logarithm is applied to Eq. (10) to yield

By using Eq. (12), the greatest a posteriori score for the behavioral data of a place can be obtained.
Visual and behavioral data can be classified separately for their respective places, but there is a limit to using only one type of data. A more reliable place classification can be obtained by merging the probabilities of the two types of data. Under the assumption that the visual and behavioral data are independent of one another, a final classification can be obtained from Eq. (13):


where P(C j |I i ,B k ) is the probability of class C j when the visual data I i and behavioral data B k concur. By the Bayes theory of Eq. (13), this can be represented by P(C j )P(I i ,B k |C j ), and P(I i ,B k ) can be omitted as it has a constant value. P(I i |C j ) is the probability that I i belongs to the class C j acquired from Eq. (7), and P(B k |C j ) is the probability that B k belongs to class C j acquired from Eq. (10). The highest probability classification of the given place is obtained by multiplying these two probabilities.
Experimental Environment
To validate the method proposed in this paper, an experimental environment was constructed as follows, and experiments were carried out accordingly.
Learning data collection place: IT building
Experimental places: IT building, R&D building, Olympic gymnasium, Law building
Experimental robot: X-bot of Yujin Robot
Camera: Logitech QuickCam Communicate Deluxe
Computer: Core2Duo T7250 (2 GHz) CPU, 512 Mb RAM
Implementation tools: Visual Studio 6.0, MFC
The learning data were collected in the IT building only, and the experiments were implemented in different experimental settings, based on these data. The experimental places had walls of different colors, and the ceiling and floor conditions were also different.
Collection of Learning Data
The learning data were collected in the IT building of Hanyang University, as shown in Fig. 10. Fig. 10(a) shows images of the respective places, taken with a camera mounted on the robot. The corridor, hall, and room are listed, and shown in that order. The hall image shows a spacious area in front of the elevator. The room contained various objects, including a table, chair, and bookshelves, and provided a very complex environment. Fig. 10(b) shows the internal layout of the IT building, and each point indicates a location at which learning data were collected. The learning data were collected by executing 3 types of behavior pattern in each place.

Collection locations: (a) sample views of each place and (b) locations where the data were gathered.
The robot collected learning data at 5 locations while traveling through the room, corridor, and hall. Whenever the robot executed a behavioral pattern, it was able to collect both visual data and behavioral data. Thus, when the robot collected 5 learning data in one place, a behavioral pattern was executed 5 consecutive times while traveling in the same place.
Classification Data Collection
Fig. 11 shows the places where the experiments were performed. During the experiments, the robot repeated the three kinds of behavioral pattern 10 times in each of the 4 places, and classification data were collected until the robot finished each behavioral pattern.
Experimental Places. (a) IT building. (b) R&D building. (c) Olympic gymnasium. (b) Law building.
Tables 1, 2, and 3 list the place classification results for the IT building, where the robot collected the learning data.
Place classification results according to rotational pattern (location: IT building, R: room, C: corridor, H: hall).

Place classification results according to rotational pattern (location: IT building, R: room, C: corridor, H: hall).
Place classification results according to rectangular pattern (location: IT building, R: room, C: corridor, H: hall).

Place classification results according to random pattern (location: IT building, R: room, C: corridor, H: hall).

The left-hand entries in the table are the place classification results. The right-hand columns contain input data for place classification. For example, rotational pattern learning and place classification using visual data are summarized in the blue-shaded rectangle, and all classification results are correct. As another example, rectangular pattern learning and place classification using behavioral data are summarized in the red-shaded rectangle, and the classification results are correct for the hall and entirely incorrect for the room and corridor. When the robot was trained in the rotational pattern, the visual data, behavioral data, and merged probabilities all performed well. When the robot was trained in the rotational pattern, the place classification results using visual data, behavioral data, and merged probabilities were all correct. On the other hand, when the rectangular learning pattern was used, the results obtained by using visual data were correct, whereas the use of behavioral data caused the robot to misclassify room and corridor locations as hall locations. This could mean that visual data from rotational and rectangular patterns are adequate for classifying places, whereas behavioral data from rectangular patterns are not sufficient for classifying places and are inferior to the behavioral data obtained from rotational patterns. Although the classification results for the merged probabilities were inferior to those for the rotational pattern, they were somewhat better than the results for the behavioral data. The correctness of place classification increased from 10/30 to 26/30. This suggests that the degradation of performance resulting from the use of behavioral data could be complemented by using visual data. When the robot executed the random learning pattern, the classification performance was lower than that obtained from the other patterns.
Tables 4, 5, and 6 are the classification results for the R&D building.
Place classification results according to rotational pattern (location: R&D building, R: room, C: corridor, H: hall).
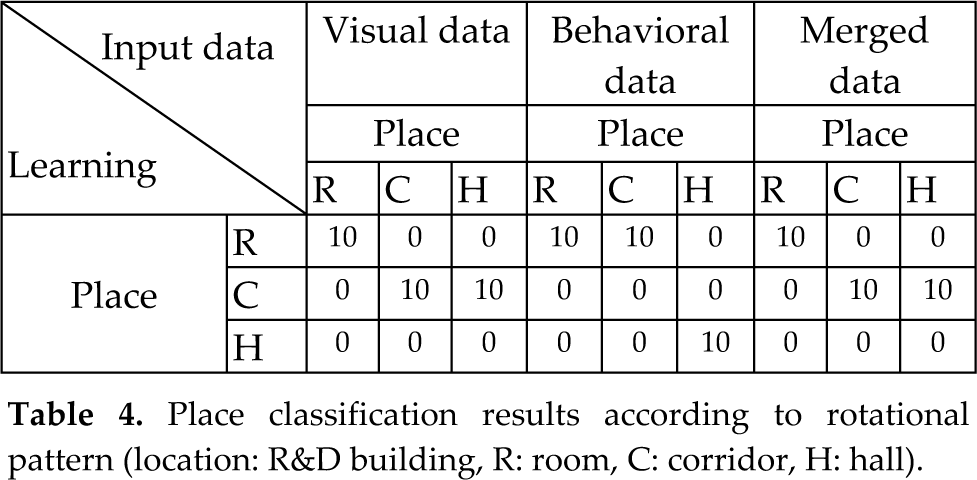
Place classification results according to rotational pattern (location: R&D building, R: room, C: corridor, H: hall).
Place classification results according to rectangular pattern (place: R&D building, R: room, C: corridor, H: hall).

Place classification results according to random pattern (place: R&D building, R: room, C: corridor, H: hall).

When the robot executed the rotational learning pattern, it was unable to distinguish the hall, and classified all surfaces as floor in the visual data. This is because the corridor, the ceiling of the hall, and the floor and walls of the R&D building were all the same color and shape, as shown in Fig. 12.

Whole-view image of the hall of the R&D building.
The structure of this building is such that the wide space in front of the stairway and elevator could not be distinguished from the corridor. Fig. 12 shows that the spacious area of the R&D building is part of the corridor, unlike the other buildings.
Fig. 13 shows the average classification correctness of the visual data, the behavioral data, and the merged information created by combining the two information types, according to behavior. Based on the results for the IT building, R&D building, Olympic gymnasium, and Law building, place classification can be analyzed according to behavioral method and place as follows.
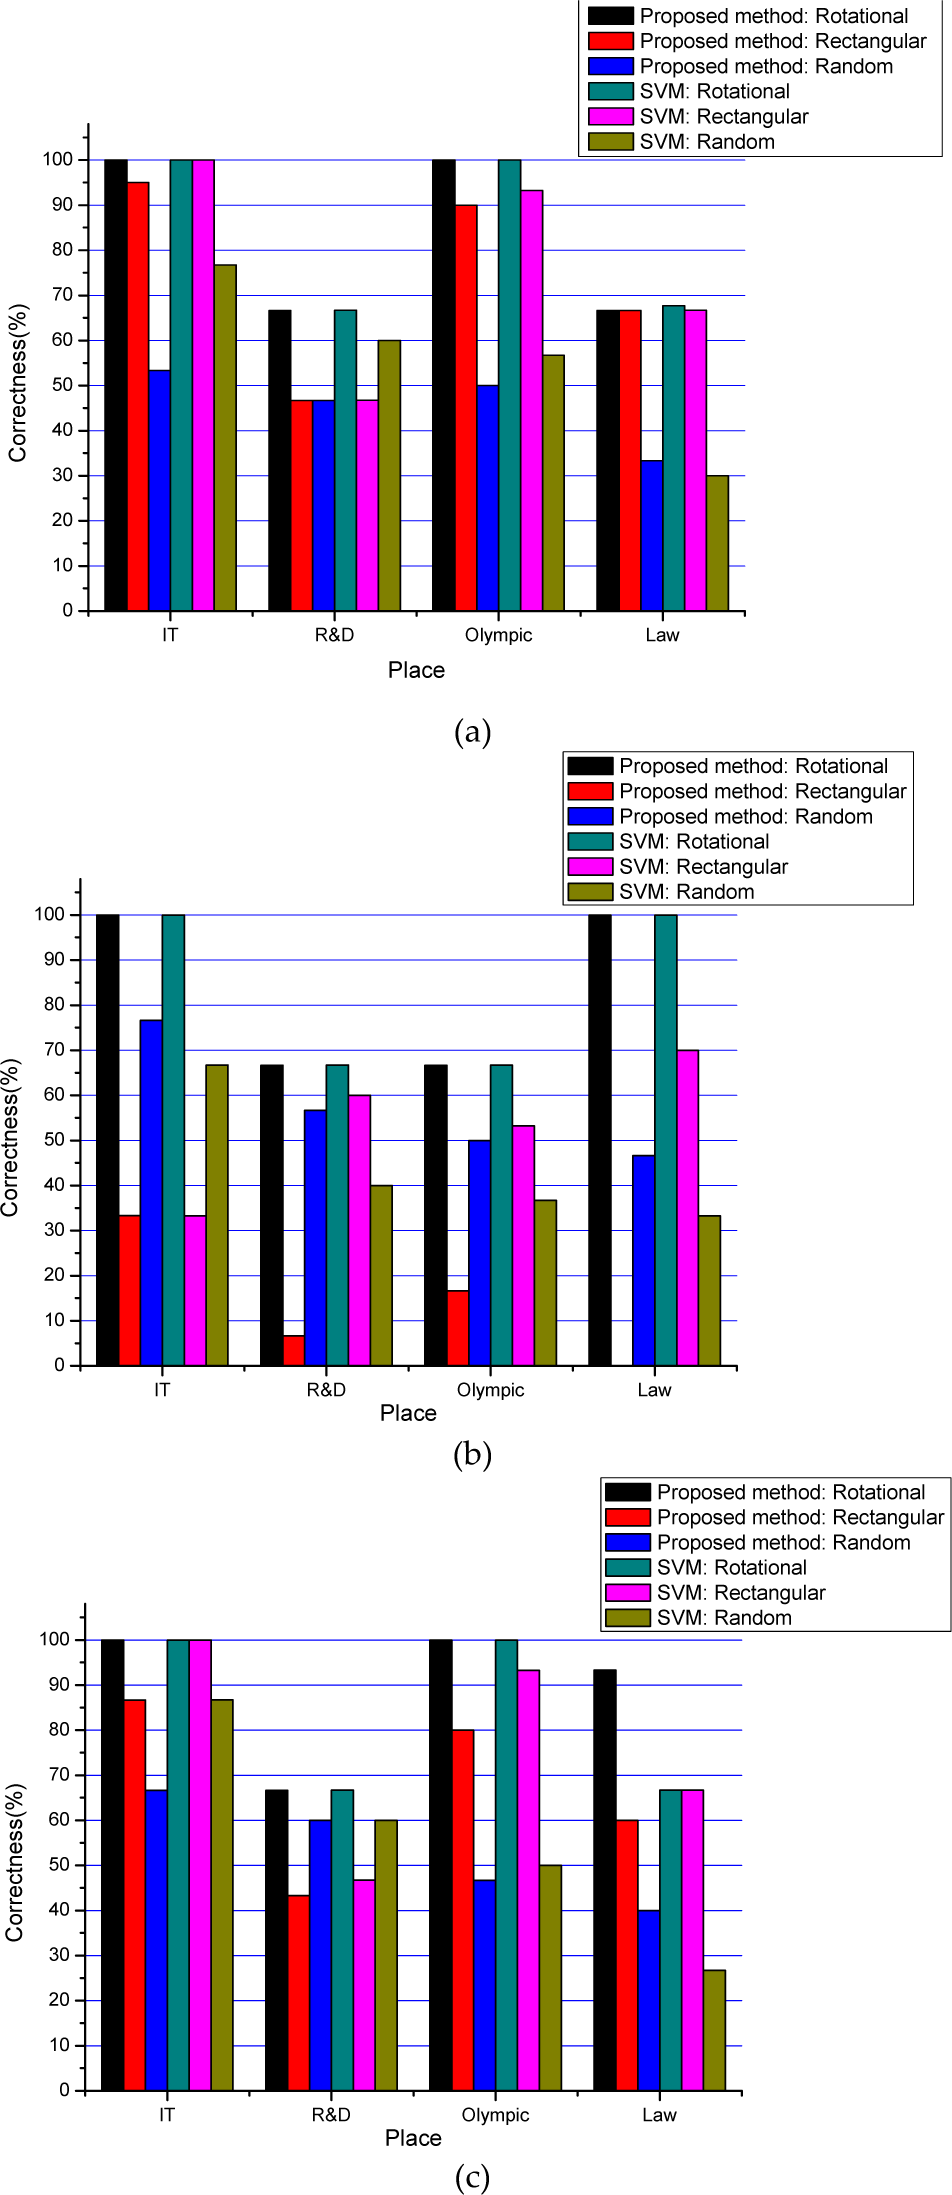
Average classification correctness for each information set: (a) average classification correctness of visual data by place, (b) average classification correctness of behavioral data by place, and (c) average classification correctness by place.
When a robot collects learning data and classifies a place via the rotational pattern, the place can be searched in all directions by increasing the radius of the traveling path. This produces good classification results by acquiring appropriate visual data for classification. The robot undergoes frequent collisions in narrow places, and occasional collisions in wide places. As collision information becomes a part of the travel information, it can be utilized as important classification information with behavioral data. This method provides high classification correctness for all types of information, as shown in Fig. 13. Consequently, the rotational pattern is confirmed as the most reliable of the 3 behavioral patterns for collecting place data. Next, the results of place classification of the respective places are discussed. The robot first collected learning data in the IT building, and then the same number of experiments were carried out in the IT building, R&D building, Olympic gymnasium, and Law building. The results indicated that the rotational pattern was the most reliable. As the learning data were collected in the IT building, the classification accuracy for the visual data, behavioral data, and merged probabilities were all high in this environment. As shown in Fig. 13., the 3 behavioral patterns have higher classification correctness in the IT building than in the other places. In the R&D building, the corridor and hall are connected in one place, and have the same color and shape. Hence, they cannot be readily distinguished, and the classification correctness was not high for any of the behavior patterns. Visual data provided better performance in the rotational behavior pattern than in the other patterns. Thus, the behavioral and image data were not completely independent, and affected each other during the process.
Finally, the performances of the naïve Bayes classifier and SVM did not differ significantly. For the SVM classifier, each place class had the same amount of data; the RBF kernel parameter γ, which was used for training, was
2−3,5 and was generated via a tool provided by LIBSVM [25]. The performance of the object classifier was 93.87%, based on 10-fold cross-validation, which was also provided by the LIBSVM tool.
Footnotes
7.
This work was supported by the Global Frontier R&D Program on “Human-centered Interaction for Coexistence” funded by the National Research Foundation of Korea grant funded by the Korean Government(MEST) (NRFM1AXA003-2010-0029744). This research was supported by the MKE(The Ministry of Knowledge Economy), Korea, under the Human Resources Development Program for Convergence Robot Specialists support program supervised by the NIPA(National IT Industry Promotion Agency) (NIPA-2011-C7000-1001-0009).
8.
In this paper, active behaviors are defined for the collection of place information, and a place classification technique is proposed, using visual and behavioral data acquired while a robot executes various behavior patterns. A behavioral pattern is first defined to search the place. Visual and behavioral data are then defined, based on the data acquired while the robot executes a behavioral pattern.
From the visual data, straight lines are extracted to roughly express the acquired images. An orientation histogram is then constructed by accumulating the straight lines according to their directional angles. Behavioral data are used to create a behavior histogram, by accumulating the movements performed to avoid obstacles while executing a behavioral pattern. The visual and behavioral data are then utilized as input data, and probabilities are calculated by designating pre-learnt places as categories. The technique employs the naïve Bayes classification method, which calculates the probability that the input data belongs to each specific category, and then selects the category with the highest probability. The location of the robot is classified by merging the probabilities for visual and behavioral data.
By defining and comparing 3 types of behavioral pattern for searching a place, the results confirmed that a rotational pattern yields the best performance, and has the most active ability to collect classification data about a place. The experiments indicate that a robot can successfully classify a place, using only pre-learnt data from a single place. These results suggest an effective method for place classification, which has no need for reconstruction or replacement of learning data according to place transfer.