
Abstract
This study aimed to construct a MRV system for the REDD regions. The system was based on the GIS and Remote Sensing techniques, and it developed a method which could detect the land cover change area as well as evaluate its accuracy. GIS, the Remote Sensing technique and the statistical modelling technique were merged, and then we monitored areas of deforestation among the REDD regions. This study compared deforestation from administrative information (GIS deforestation1) with deforestation (RS deforestation) extracted from satellite imagery by vegetation indices (NDVI, NBR, NDWI). The highest extraction accuracy that applies filtering to NDVI with a threshold of 1.5 showed reliable accuracy 35.47% with a k-value of 0.20. However, one of the reasons for the accuracy error was due to the difference between land-use change and land-cover change. The actual rate of land-cover change deforestation was 32% on the administrative information. The other reason was a 7.52% error extraction of the forest management area. Finally, considering the deforestation of the changed land-cover region (GIS deforestation) and RS deforestation, the highest accuracy was observed at the NDVI threshold value interval of 2 and showed an extraction rate and k̂ index of 61.2% and 0.23, respectively. In comparison with the case of applying GIS deforestation I, it showed 36.7% and 0.03 improvements. The MRV monitoring system based on the GIS and Remote Sensing techniques would enable the monitoring of larger size areas regularly and with high reliability.
Keywords
1. Introduction
In 2005, the Korean government announced a master plan for U-Korea, and it tried to apply ubiquitous computing technology to various areas. This plan included 5 strategic objectives, such as improving the living environment of the city and supporting the life of the people in the city. Such ubiquitous technology has been expanded to the agricultural and forestry industries. In 2010, the Korean forest service established a U-Forest construction strategy which including a forest information-oriented master plan encompassing forests' spatial information. GIS (Geographic Information System) and IT (Information Technology), which are the base technology for this ubiquitous system have been used to not only provide forests' spatial information, but also to operate the FGIS (Forest Geographic Information System). The Office of Forestry has also developed various forest information system, such as a forest fire forecasting system and a landslide hazard area management system.
The Kyoto Protocol will require the reduction of greenhouse gases produced in Korea. To respond to the resolution, this requires the development of an information system for the management of discharge and greenhouse gases [16]. The Office of Forestry is currently developing an information system for greenhouse gases to meet the negotiations for climate change. However, the administration's data and field survey face a difficulty in constructing a proper information system for greenhouse gases [28]. Recently, after the COP16, a MRV (Measuring, Reporting and Verification) system is required which can perform the functions of measuring, reporting and verification for the statistics on greenhouse gases. Therefore, the importance of GIS and Remote Sensing technology is increasing in the forestry industry, and they are becoming the necessary factors in developing a forest strategy.
In particular, according to Clauses 3 and 4 of Article 3 of the Kyoto Protocol, in the case of forest-utilizing activities such as afforestation, reforestation, forest management and vegetation recovery these are all recognized as greenhouse gas reduction sources, but in the case of deforestation it is recognized as a greenhouse gas emission source. The greenhouse gas reductions achieved through projects such as AR/CDM are allowed to be used by developed countries towards their own greenhouse reduction goals [15]. In addition, according to the Marrakesh Accords, afforestation is to be done in lands that have not had forests during the past 50 years, and reforestation areas are only to be in regions that were not forests as of December 31, 1989 [11]. In these situations, Reducing Emission from Deforestation and Forest Degradation (REDD) is being discussed as a possible substitute for AR/CDM projects [13]. In accordance with the size of the area deforested, as the net loss of carbon absorption, deforestation can be a carbon emission source, as the forest's unique function of storing carbon or as an absorption source is reduced [16]. In the case of having multiple instances of deforestation within a single mountainous region, since it is possible to develop into forest degradation, periodic monitoring of such deforestation areas is required [10]. However, since forest distribution is large and deforestations occur irregularly, the reality is that for on-site investigations it is hard to attain an effective understanding or management.
Meanwhile, since satellite imaging has the advantages of being able to conduct periodic monitoring for large scale regions, it is widely used in studies of land utilization and land cover classification [22], and Geographic Information System (GIS) and Remote Sensing (RS) technologies have the advantage of offering the easy ascertainment of deforestation regions. Currently, the characteristic analysis of studies on deforestation's occurrence through the use of GIS and administrative information is actively being pursued. Along with the assessment studies of the carbon emission amounts of deforestation regions through the use of statistical information, studies analysing the spatial distribution of deforestation regions and the assessment of carbon emission amounts by using administrative information and GIS are progressing [20, 21, 28]. Lee et al. [21] performed a study analysing the extraction accuracy of deforestation regions by linking the GIS and the probability model. On the other hand, looking at land utilization and land cover change detection studies using satellite imaging, land cover changes in urban areas through image differences and image ratio techniques at multiple periods were detected [2, 19], and the extraction accuracies of forest cover reduction regions by using a normalized burn ratio (NBR) and a normalized difference vegetation index (NDVI) were estimated [3, 25]. Volcani et al. [30] and Park [24] suggested the efficacy in detecting vegetation change by using image classification and vegetation indices.
As such, this study attempts to extract deforestation regions by using satellite imaging information, which is found to be helpful in figuring out land cover changes over large areas, and to comparatively analyse the agreement level and accuracy of deforestation regions against the administrative information for the REDD MRV system.
2. The MRV Monitoring System
The information system for greenhouse gas was constructed through the merging of various data sources such as FGIS in the Office of Forestry and the forest data of various study areas. Also, the spatial information of GIS and Remote Sensing technology enables the monitoring of forests regularly. This system considers functions for measuring the magnitude of greenhouse gas, reporting the magnitude of reduced amounts of gas, and the verification for those amounts (Fig. 1).

Concept of the MRV system for REDD.
3. Materials and Methods
3.1. Study area
Since 2006, urban development has progressed continuously through the designation of innovation cities and enterprise cities, and the City of Wonju in Gangwon Province, whose population has grown steadily in the last 10-years, was selected as a subject area. In addition, the subject area was selected as a responding model city for the United Nations Framework Convention on Climate Change, and the city is currently pursuing projects such as the construction of environmentally-friendly self-supporting energy towns, carbon point systems and carbon absorbing source construction, along with the construction of a forestry production basis and forestry product distribution and processing facilities [33].
3.2. Data Source
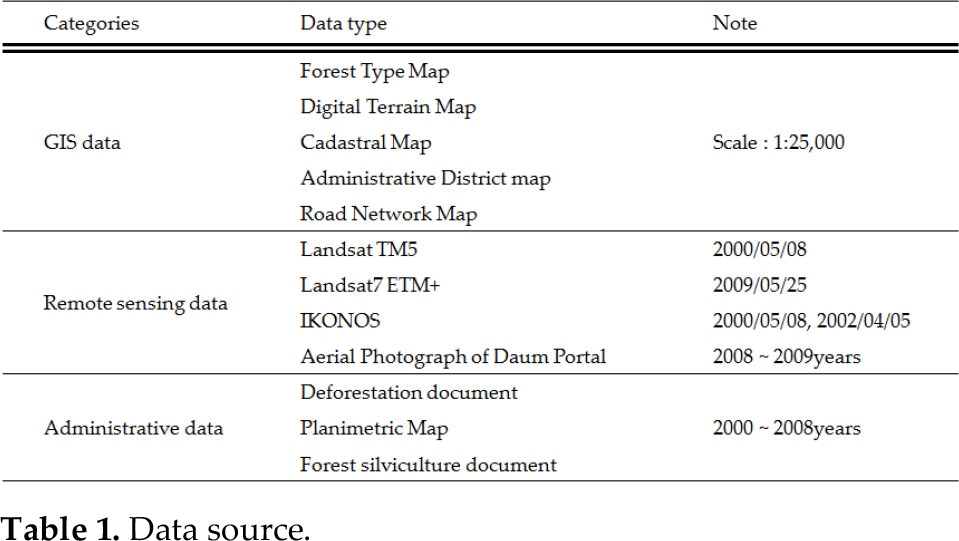
For the analysis of the region, administrative information, Geographic Information System (GIS) and Remote Sensing (RS) information were all used. For the administrative information, cutting license registrations, deforestation license registrations and planimetric maps for the regions of deforestation that were issued for the last 8-years were used, as provided by the City of Wonju. The planimetric maps provided information for the locations of deforestation regions and district information. Also, the 4th digital forest type maps, digital topographic maps, cadastral maps, administrative district boundary maps and the maps of road systems were used as GIS data. As to the RS data, Landsat TM images, IKONOS images and aerial photographs loaded into the Daum portal site were used (Table 1).
Data source.
In addition, the deforestation region's extraction and its accuracy of evaluation were performed by using the ENVI 4.7 and ArcGIS 9.3 programs developed by ITT and ESRI.
3.3. Methods
Along with the GIS database for deforestation license registrations, the geometric correction was performed after scanning the deforestation region's forest type maps so as to be fitted to the cadastral maps in order to construct a GIS forestation region that included both location and scale information. Based on the IPCC standard (agricultural land, grassland, wetland, residential region and miscellaneous lands), the deforestation type was largely classified into 5 categories in order to analyse the spatial development characteristics (Table 2). In addition, the GIS forest management (FM) activity regions were constructed by using the cutting license registrations.
Land use categories of IPCC Guidelines.

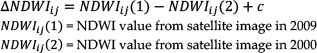
Meanwhile, the pre-treatment works of geometric correction and radiometric correction were performed for the satellite images. Based on the digital topographic maps and road system maps, the geometric corrections for the Landsat TM satellite images at 2 different time points were performed using the WGS 1984 UTM Zone 52N and the Root Mean Square Error (RMSE) was 0.64. In addition, since the relative radiometric normalization technique [6, 12] was used extensively for the analysis of the detection of change in the satellite images that were captured at multiple time periods, and image normalization was performed by conducting a regression analysis after selecting 5 locations in each region of forest, a watery region and unchanged areas from the satellite images that were captured at two different time points. For the extraction of regions of changing forest cover, the normalized differences in the vegetation index (NDVI), the normalized burn ratio (NBR) and the normalized differences water index (NDWI) were used (Fig. 2). The NDVI that was devised by Rouse et al. [26] is one of the most widely used parameters for estimating forest vitality. It is widely used for the estimation of vegetation vitality, productivity evaluation and land cover change [29, 34]. NBR was suggested by Key and Benson [14] for use in the quantitative evaluation of the damage level of forest fire regions [18, 31]. In addition, the NDWI that was developed by Gao [9] is easy to use for finding out the water holding amount of vegetation and it is used in the classification of land cover (Table 3).
Formula of vegetation indices.

NIR: near-infrared spectral range
R: red spectral range
SWNIR: short wave near infrared
MIDIR: mid-infrared spectral range

Framework of method.


To detect regions of forest change by using satellite images, periodic indices were calculated and an image difference technique was used (Equation 1, 2, 3). Royal [27] and Phua et al. [25] suggested a method for estimating the extraction accuracy of forest change in regions by using the mean and standard deviation values of the image difference of satellite images. Those pixels with no change of brightness between two time periods distributed at the perimeters of the mean surroundings and those pixels showing a change of brightness are located at the terminal of both sides, as shown in Fig. 3. Therefore, to extract regions of forest change, threshold values from the mean(μ)±standard deviation(σ)×1 to μ±σ×4 were multiplied by 0.5 units to produce threshold values, and the location change of threshold values was used to extract a RS deforestation region. In addition, the improvement of extraction accuracy was compared and reviewed by applying a 3 by 3 majority filtering, and for the evaluation of RS deforestation region accuracy, GIS deforestation regions and the extraction rates of FM activity regions which were used along with Kappa analysis.

Determination of the threshold.
Kappa analysis is a discrete multivariate analysis technique, which is widely used for accuracy analysis. It produces a statistical value of kappa (k̂) and shows the agreement or accuracy between the reference data and the classification maps that were produced by using remote sensing [1, 4, 5, 7, 8]. According to the evaluation criteria of the kappa coefficient that was defined by Landis and Koch [17], a k̂ value larger than 0.8 indicates very excellent agreement or accuracy between the classification map and the reference information, while a value of 0.6–0.8 indicates excellent, 0.4–0.6 indicates good, 0.2–0.4 indicates fair, and a value of less than 0.2 is evaluated as poor agreement or accuracy (Equation 4).
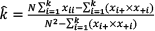
k: The number of columns in the matrix
xi: The observed number in columns i and rows i
xi+: Column i sums
x+i: Row i sums
N: Total number of observed data
Lastly, the causes of GIS and RS deforestation regions were analysed by using high resolution satellite image data.
4. Results and Discussion
4.1. The distribution characteristics of GIS deforestation and FM activity regions
The size of the area of occurrence of the GIS deforestation region (GIS deforestation region type I) over the last 10-years, as estimated by using deforestation registrations, was about 467ha with an annual deforestation of 52ha, and 21% of the deforestation occurred in 2008 (Fig. 4). In addition, the area distribution by deforestation type showed that 72% of deforestation occurred in residential areas, followed by 17% in miscellaneous lands and 9% in agricultural lands. Approximately 97% of the total deforestation areas occurred in lands smaller than 2ha. The distance characteristics of the deforestation showed that 48% of the deforestation was located within 200m of roads and 79% of it occurred in areas within 100m of the boundaries of forest/non-forest (F/NF). In addition, approximately 80% of the total deforestation occurred in the area within 500m of roads and areas within 100m from the boundaries of F/NF.
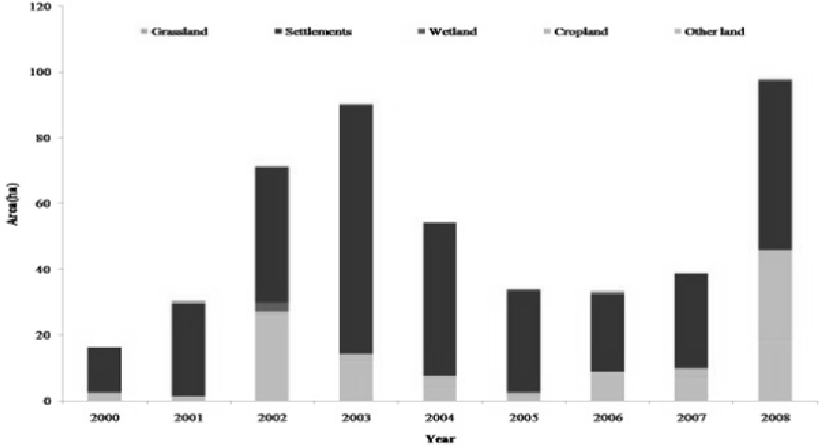
Annual occurrence area of deforestation.
Meanwhile, the GIS forest management activity region (GIS FM activity region) that was constructed using cutting license registrations was about 3,970ha, which was 8.5 times larger than the GIS deforestation I, but it showed a decreasing pattern from year to year, and approximately 70% of the total GIS FM activity regions occurred between 2000 and 2004. The distance characteristics of the deforestation showed that 15% of the deforestation was located within 200m of roads, and the largest FM activity regions were 200m–400m from roads. In addition, approximately 86% of the total cutting area was located within 100m of F/NF boundaries and this was similar to the occurrence which was characteristic of deforestation.
4.2. Comparison of the extraction accuracy of GIS deforestation I by the RS deforestation region
4.2.1 Before applying filtering
The extraction accuracy of the GIS deforestation I by the index-based RS deforestation region and the extraction rate of the threshold value interval of 1–2 showed NDVI>NBR>NDWI in decreasing order. The threshold value of the NDVI was found to be about 3.7% and 9.4% higher than NBR and NDWI, respectively. However, the extraction rate at the threshold interval of 2.5 was found to be higher in NBR than the value of NDVI, showing about 2.2% and 6.3% higher NBR values than the values of NDVI and NDWI, respectively. But the NDWI showed the lowest extraction rate regardless of the threshold value interval. In terms of the index, NDVI and NDWI recorded the highest at the threshold value interval of 2, and the NBR was high in the threshold value interval of 2.5 (Table 4).
Accuracy assessment of GIS deforestation I and RS deforestation.

ROC: Rate of concordance
The comparison of index-based RS deforestation regions with FM activity regions showed a high error extraction rate in decreasing order of NDWI>NBR>NDVI at the threshold value interval of 1–2. From the threshold value interval of 2.5, the error extraction rate was observed to be high in decreasing order of NBR>NDWI>NDVI. As such, the accuracy of NDVI was found to be most stable. According to the studies of Won et al. [32] and Lee et al. [23], NBR has been reported to respond more sensitively to land than NDVI and as a useful parameter for the extraction of forest cover change regions that were damaged by forest fire. The report is considered to be the result of the oversized error extraction of NBR than NDVI by determining the FM activity of such regions as the deforestation regions due to their sensitive response to land cover changes caused by cutting activities (Table 5). Since NBR responds sensitively to large scale land cover changes, the use of NDVI is considered to be appropriate for the extraction of deforestation regions at the threshold value interval of 2, which, respectively, showed agreement and a index of 33% and 0.21.
The ROC of RS deforestation and forest activities areas.

4.2.2 After applying filtering
The extraction accuracy of GIS deforestation I by index-based RS deforestation regions was the same as before, and in applying filtering and NDVI it was higher at the threshold value interval of 1–2, while the NBR was found to be higher at the threshold value interval of 2.5. The agreement of NDVI at the threshold value interval of 1–2 was found to be, on average, about 3% and 9.2% higher than NBR and NDWI, respectively, and NBR was higher on average, by about 0.9% and 4.5%, than NDVI and NDWI, respectively, but it showed no significant difference before filtering. The index results show the same value at the threshold value intervals of 1.5 and 2. Therefore, it was considered to be suitable to apply a threshold value interval of 1.5 with high agreement (Table 4). Meanwhile, the error extraction rate of the index-based FM activity regions was found to be lower compared to the results before applying filtering by showing higher results in decreasing order of NDWI>NBR>NDVI at the threshold value interval of 1–2, and the pattern was found to be in decreasing order of NBR>NDWI>NDVI from the threshold value interval of 2.5. As such, based on the results of reviewing the accuracy of applying filtering along with the accuracy by indexes and by intervals, it was considered to be most appropriate to apply filtering to NDVI with an interval of 1.5 for the extraction of deforestation regions, which resulted in an extraction rate and a index of 35.47% and 0.20, as shown in Table 5.
4.2.3 The accuracy of evaluation for GIS deforestation I and RS deforestation regions
From the perspective of land usage type, the GIS deforestation1 signified the deforestation change from forest (F) to Non-forest (NF), but it does not mean a land cover change. The result of decoding the land cover changes of GIS deforestation I by using high resolution satellite images (IKNOS, Daum) allowed the classification of land cover changes largely into 4 different types. The land cover change was judged based on when more than 30% of the area was changed. From the perspective of the land cover change of GIS deforestation I, the regions that changed from forest (F) to Non-forest (NF) was only about 57%, and the regions' change pattern of F→F, NF→NF, and NF→F resulted in ranges of about 19%, 22% and 1%, respectively, by causing the deterioration of the extraction accuracy of GIS deforestation regions by RS deforestation regions.
In addition, the error extraction rate of FM activity regions with RS deforestation regions resulted in 7.5% of the total FM activity area at the NDVI threshold value interval of 1.5. Since large scale land cover changes were developed by cutting activities, which were extracted as the forest reduction regions by RS technique, it showed a limitation for classifying land cover change and land utilization change by using RS technique. To supplement this limitation, it is considered necessary to understand the forest management activity regions by using GIS and administrative information before conducting the analysis.
4.3. Evaluation of the RS deforestation region accuracy by comparison with GIS deforestation region II
4.3.1 Comparison of accuracy by applying filtering
By using the GIS deforestation regions that were changed from F to NF regions, the actual land cover of changed regions (GIS deforestation II) was about 150ha and took up about 32% of the deforestation area based on administrative information alone. The index extraction rate of the GIS deforestation II compared with the RS deforestation region was high, in decreasing order of NDVI>NBR>NDWI at the threshold value interval of 1–2, and in decreasing order of NBR>NDVI>NDWI at the threshold value interval of 2.5–4. Compared with GIS deforestation I, the index extraction rate for NDVI, NBR and NDWI before applying filtering resulted in improvements of about 28%, 31% and 24%, respectively. After filtering, there were improvements of 25%, 27% and 20% for each index (Table 6).
Accuracy assessment of RS deforestation and GIS deforestationll.

In the case of the k̂ index, regardless of filtering, the extraction accuracy maintained a higher accuracy at the threshold value interval of 2–2.5. In addition, compared with the GIS deforestation I, the k̂ index for each index was improved by about 0.03, 0.02 and 0.02 for each index of NDVI, NBR and NDWI, respectively. After applying filtering, index improvements of 0.04, 0.03 and 0.03 were observed. Considering the extraction rate and the k̂ index, the highest accuracy was observed at the NDVI threshold value interval of 2 and showed an extraction rate and k̂ index of 61.2% and 0.23, respectively. In comparison with the case of applying the GIS deforestation I, it showed 36.7% and 0.03 improvements.
4.3.2 Evaluation of the RS deforestation region accuracy by using high resolution satellite images
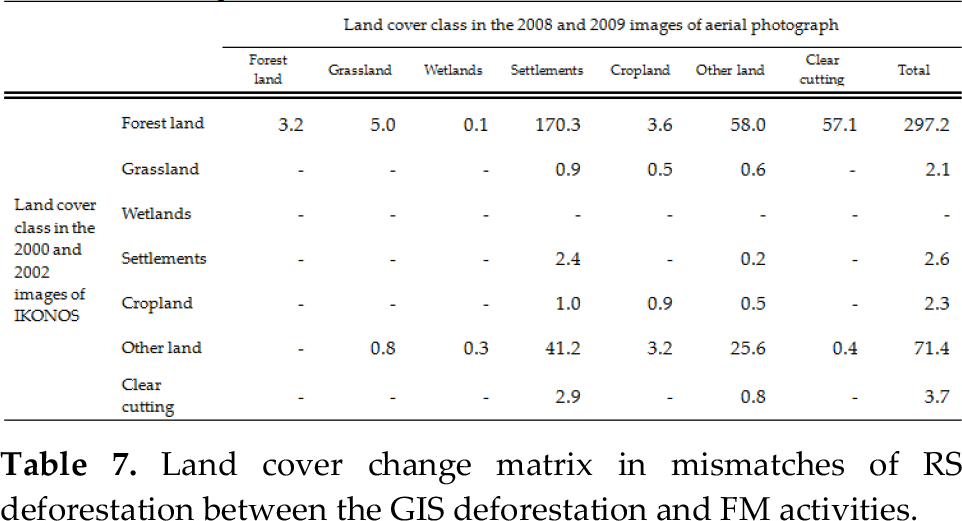
The disagreement between the RS deforestation regions (NDVI at the threshold value interval 2 after applying filtering) and GIS deforestation II was found to be 58ha, which showed that 84% of the development was observed at the perimeters of deforestation regions. In addition, the disagreement between the RS deforestation regions and FM activity regions was about 173ha, and 49% of the region was found to be the FM activity regions that occurred in 2008 and 2009 (Fig. 5). However, the disagreement between the GIS deforestation II and FM activity regions was about 379ha, and 19% of the region was already judged as miscellaneous lands in 2000–2001, and approximately 78% of the region was decoded as a forest region in 2000–2001, but was found to be changed to residential and miscellaneous land types in 2008–2009 (Table 7).
Land cover change matrix in mismatches of RS deforestation between the GIS deforestation and FM activities.

Comparison of RS deforestation and GIS deforestation (example: NDVI of threshold of 2 σ with filtering).
5. Conclusions
This study constructed a MRV system through combining GIS, Remote Sensing and statistical modelling techniques, and monitored deforestation areas among REDD regions. The REDD monitoring system based on the GIS and Remote Sensing techniques will enable the monitoring of large areas regularly and with the high reliability. The extraction accuracy from using RS information included limitations which could largely be divided into 2 facts. First, it showed a limitation on extracting deforestation regions by using RS information alone due to the difference between the time points of land usage change and the land cover change of GIS deforestation regions; therefore, in improving the accuracy of deforestation regions by using RS information, it is felt to be useful to use the information from previous years instead of using administrative information from the same periods alone. Second, there is a limitation on the error extraction of FM activity regions. Among the FM activity regions, cutting activity occurred at a large scale, causing land cover changes, which was judged as being the forest reduction regions. Therefore, it is considered necessary to conduct continuous monitoring by establishing time and spatial information for forest management regions.
Since the Kyoto Protocol came into force recently, concerns over climate change are being amplified in each country. In response to this problem, emphasis has been placed on the construction of greenhouse gases statistical information systems based on forests. In particular, the prevention of deforestation and degradation through the reduction of greenhouse gases (Reduced Emissions from Deforestation and Degradation, REDD), and REDD+ which contains forest preservation and promotion, and sustainable forest management will be utilized as the new mechanism in post-2012. The MRV system is required to identify changes in forests. In this study, the geographic information system and information technology based on remote sensing was proposed to extract the area of deforestation. This method was supposed to quickly determine which forest areas were changed and also provide reliable information. The proposed system could be used for the verification of greenhouse gas accounting systems, and this system can play an important role as an MRV system that is required by the post-2012 world.