
Abstract
Human consumption of scarce ecological resources is at the heart of the climate change crisis. Mitigating climate change will require changes in consumer behavior. Further, to respond effectively, policymakers need information on the environmental impact of individuals’ behaviors. In this paper, we study the effect of socio-demographic characteristics and personality traits on individuals’ environmental impact measured by their ecological footprint. We also investigate consumers’ willingness to pay for “green” goods. Using survey data from the Netherlands, first, we construct individuals’ ecological footprint. The survey also uses a 50-item personality scale developed by Goldberg (1992) to construct five personality traits. We find that individuals with higher personal income, less than a high school education, males, the employed, and people living in rural areas are associated with a higher EF. We also find that consumers’ WTP and demand are responsive to price increases in high-emitting goods and personality traits. We contribute to our understanding of the influence of socio-demographic and personality characteristics on the actual ecological footprint at the individual level. Further, we contribute to the economic literature on consumers’ WTP for “green” products as well as the ongoing discussion on using market-based solutions to tackle climate change.
1. Introduction
According to the Global Footprint Network estimates, human use of ecological resources exceeds the Earth’s capacity to replenish them and we are operating as if we lived on 1.6 Earths (GFN, 2020). Governments and environmental agencies have previously focused on minor ways in which individuals and households can reduce their emissions (recycling, water saving). However, they have paid considerably less attention to consumer trends that have significantly contributed to increasing emissions (Stern, 2011). High-emission-related activity is associated with the size and location of housing, transportation, and nutrition (Kennedy et al., 2015; Moser and Kleinhückelkotten, 2018). Therefore, it is crucial for policymakers to promote pro-environmental behaviors that have a significant impact on the environment. To achieve this, we first need to understand the drivers of individuals’ behavior towards the environment and the factors that influence behavioral change.
In this paper, we use field surveys to examine how socio-demographic characteristics such as income, age, gender, household composition, and personality traits influence an individual’s ecological footprint (EF); a measure of an individual’s environmental impact. Following Rees and Wackernagel (1996), we use relevant questions from the surveys to construct the EF for 2010 and 2011. 1 EF is a broad measure of human demand on the Earth’s ecosystem which offers a greater scope than the more narrowly defined carbon footprint (Guzman et al., 2011). Further, we calculate an individual’s EF based on her/his actual consumption patterns rather than expected consumption, a novelty of our study. Second, we analyze an individual’s willingness to pay (WTP) a price premium for more environment-friendly goods. Specifically, we examine the impact of increasing the price of goods and services associated with high emissions (meat, household energy, fuel, and aviation travel) if produced in a sustainable way with lower emissions but at a higher cost. 2
We use individual-level surveys (conducted in 2010 and 2011) conducted by the CentERdata at Tilburg University to determine how individual socio-economic and personality characteristics affect their EF. The Dutch National Bank (DNB) Household Survey is the largest household-level questionnaire administered and conducted by the CentERdata in the Netherlands. 3 Note that the Netherlands is a member of the OECD. The OECD is a forum for the members of countries, providing a platform to compare policy experiences, seek answers to common problems, identify good practices, and coordinate domestic and international policies of its 38 members. Hence, the sample from the Netherlands is also highly representative of the European population and at least the other 37 OECD nations.
Our results indicate that individuals with higher personal income, less than a high school education, males, the employed, and people living in rural areas are associated with a higher EF. We also see that personality traits do not significantly affect EF. Our WTP exercise finds evidence of a standard decline in the demand for meat and household energy, but there is no significant evidence that car and air travel are responsive to changes in price. These findings can have important implications for policymakers as interventions to reduce individual environmental impact can be more effective if they are tailored to suit different segments of the population.
We contribute to the existing literature in the following ways. Specifically, the growing literature on the environmental impact of individuals and households represents a very important research area in several disciplines. Environmental attitudes (concern, awareness, and values) and pro-environment behaviors of individuals and households have attracted the interest of an increasing number of academics e.g. Kennedy et al. (2015), Steg and Vlek (2009), Steg (2015), Dono et al. (2010), Gifford and Nilsson (2014), Bamberg and Moser (2007), Bauer et al (2021), Riedl and Smeets (2017). However, an objective measure of behavior is lacking in the research on individuals’ and households’ actual environmental impact. Our paper makes three main contributions. First, we contribute to the literature by shedding greater light on the influence (or lack of influence) of socio-demographic and personality characteristics on the actual environmental impact—in the form of the EF—from an individuals’ perspective. Second, we contribute to the emerging literature on EF as a measure of this impact at the individual level with actual consumption patterns. Finally, we contribute to the growing economic literature on consumers’ WTP for “green” products as well as the ensuing discussion on using market-based solutions to tackle climate change.
Individuals’ environmental impact
In the literature on individuals’ environmental impact, previous researchers have focussed on engagement in specific pro-environment behaviors and attitudes towards the environment, often estimated in terms of self-reported environmental concerns. 4 However, Kennedy et al. (2009) note a gap between environmental attitudes and behavior in which individuals express environmental values that do not necessarily lead to pro-environment behaviors. A gap between pro-environment behavior and its impact was identified by Csutora (2012). Kollmuss and Agyeman (2002) also addressed the awareness-impact gap and found that higher environmental awareness did not necessarily translate into pro-environment behaviors. It is therefore important to measure the impact from behavior ex-post as well as intended behavior ex-ante.
The concept of EF as an environmental indicator is growing in the literature (Bleys et al., 2017). The EF is considered a better indicator of environmental quality by some due to its greater multidimensional nature that is crucial in monitoring sustainability and tracking improvements towards targets (Haider and Akram, 2019). However, the existing literature focuses more so on carbon dioxide emissions to estimate individual environmental impact. One example is Druckman and Jackson (2009) who use household expenditure data to estimate household CO2 emissions from a consumption perspective by calculating the CO2 emissions generated from direct fuel use as well as “embedded” or indirect CO2 emissions associated with the consumption of goods and services. Kennedy et al. (2015) uses survey data to measure a partial CF but they do not account for the environmental impact from the production of goods and services such as food consumption. Another common measure of environmental impact in the literature is household energy use. 5 Energy use in households is an acceptable indicator of environmental impact because energy-related emissions are a significant contributor to total emissions, and households account for 15–20 percent of total energy-related emissions (Biesiot and Noorman, 1999). 6
A focus on energy use and carbon dioxide emissions (or CF) does not account for the increasing trends of other pollutants and therefore EF can provide a more accurate estimate (Stern, 2017). However, the use of EF to investigate environmental behavior at the individual level is scarce. 7 One example is a study by Bleys et al. (2017) exploring the environmental impact of individual behavior using a sample of the Belgian population in 2013. They analyze different determinants of an individual’s EF and compare individual self-assessments of environmental behavior with their actual impact. Our paper extends the literature to investigate a two-period setting for an individual’s EF as well as including personality traits in the estimation.
Economists increasingly hold that personality generates a non-cognitive response to economic decision-making (Cobb-Clark and Schurer, 2012). A person’s personality traits are interesting because it is reasonable to assume that personality is a stable and central factor in how people behave as it is considered to be unchanging. 8 The Big Five Personality Traits model, developed in the 1990s, is widely accepted in psychology and incorporates a broad spectrum of personality traits—extroversion, openness, conscientiousness, agreeableness, and neuroticism. 9 Within each of the five overarching personality traits, there are around 20 individual personality characteristics.
Pro-environment attitudes have been extensively studied as a predictor of individual environmental behaviors. For example, Moser and Kleinhückelkotten (2018) demonstrate that actual measured CF depends on intent-driven characteristics of individuals such as awareness and concern towards the environment, however, less is known about the origins of pro-environment attitudes and their connection to pro-environment behavior (Brick and Lewis, 2016). Hence, an individual’s personality traits might explain why people develop certain attitudes and behaviors towards the environment. For example, Hilbig et al. (2012) and Markowitz et al. (2011) consistently found positive links between openness and pro-environment attitudes and behavior. However, results for the other personality traits were more mixed. There was some evidence that agreeableness had a positive relationship with pro-environment behaviors (Hirsh and Dolderman, 2007), but others found no relationship (Hilbig et al., 2012; Markowitz et al., 2011).
A Spanish study found that the personality traits of agreeableness, extroversion, and conscientiousness are associated with greater pro-environment behavior, but in slightly different ways (see Fraj and Martinez, 2006). They found that consumers who were more conscientious were likely to purchase environment-friendly products or switch products for environmental reasons. However, those who were more extroverted were associated with pro-environment behavior in their community such as joining environmental groups. In a German panel study, results were consistent with much empirical and theoretical research in that agreeableness and openness were significant predictors of pro-environment attitudes (Hirsch, 2010. 10 They also found that neuroticism was significantly related to greater environmental concerns; a higher level of neuroticism is associated with higher emotional instability and, hence, these individuals might be more worried about negative outcomes (Hirsch, 2010).
Some studies discovered a small positive relationship between conscientiousness and environmental concern (see Milfont and Sibley, 2012 and Swami et al. 2011), while other studies found a very strong link between conscientiousness and environmental engagement and behaviors such as recycling. 11 Conscientiousness is related to planned behavior and self-discipline and might explain why there are stronger links with measures that involve ecological action. Less discussed in the literature are the mediating effects of other personal and social characteristics in the personality-environmental behavior relationship, particularly gender.
Agreeableness is a personality trait consistently linked to pro-environment behavior in the literature but associated more with females (Luchs and Mooradian, 2012). Zelezny et al. (2000) note that females tend to demonstrate a higher level of social responsibility, are more focused on helping others, and are more willing to sacrifice their own standard of living to preserve the environment for future generations. 12 These behaviors also relate to the traits of agreeableness and openness. The moderating role of gender was examined by Hirsch (2010) in detail for females and males and concluded that gender had no moderating effect. By incorporating individual personality traits into our empirical models, we also contribute to this strand of the literature.
Furthermore, an extensive body of literature has studied how socio-demographic characteristics (income, age, gender, household composition, and education level) affect an individual’s environmental impact and behavior. 13 Income is often considered the most significant predictor of environmental impact—a higher level of income is related to higher ecological impact (Csutora, 2012). For instance, studies have found that higher income is related to higher carbon emissions, greenhouse gas emissions, and EFs. 14
While there is plenty of evidence that income and environmental impact are positively related, the relationship with other socioeconomic characteristics is inconclusive (Bruderer-Enzler and Diekmann 2015). For example, Abrahamse and Steg (2009) found no correlation between gender and carbon emissions, while Büchs and Schnepf (2013) found higher emissions in female-headed households. In a study across 14 countries, women tended to report stronger environmental attitudes and behaviors than men (Zelezny et al., 2000). 15
Age also presents contrasting results. Lenzen et al. (2013) found emissions increasing with age, while Büchs and Schnepf (2013) found that emissions initially increased with age but then reached a turning point and declined to indicate a non-linear relationship. Diekmann and Jann (2000) investigate the relationship between age and energy use related to different lifestyle factors such as food consumption, transport and mobility, and housing. They find that age does not have an impact on food-related energy use but is negatively related to mobility-related energy use. They also note that energy use in the house increases with age.
There is also no uniformity with regard to the relationship between education and individual environmental impact. For example, Diekmann and Jan (2000) and Kennedy et al. (2015) find no correlation, while Büchs and Shnepf (2013) find that higher education plays an important role in predicting high household emissions (in particular for transport-related emissions). Research suggest that those more educated are likely to be earning a higher income with greater opportunity for consumption (see Kennedy et al., 2015 and Druckman and Jackson, 2009). However, Baiocchi et al. (2010) found a negative relationship that supports the hypothesis that a higher level of education leads to greater awareness of environmental issues and, thus, encourages pro-environment behavior (also see Gifford and Nilsson, 2014).
Researchers have studied geographic location (such as urban or rural location) as a factor influencing an individual’s environmental impact. On the one hand, residing in an urban area may lower an individual’s footprint due to reduced transport needs and greater use of public transport as well as smaller living spaces with lower energy requirements. However, individuals may cause higher indirect emissions through greater consumption of dining out and entertainment (Ala-Mantila et al., 2014). Li et al. (2015) supported this theory, finding that the total carbon dioxide emissions of households in China were significantly higher in urban areas than in rural areas. They found a causal relationship between urbanization in China and higher carbon emissions. Urban residents in China are generally more representative of the wealthy, while in developed countries (such as the Netherlands), it is more common for the wealthy to reside outside of urban areas—suburbs or rural areas—and occupy more land. Therefore, if the relationship is income-driven, we may not see the same results in the developed and developing nations.
The importance of promoting environment-friendly consumption to help consumers engage in environment-conscious purchases was noted by Brécard et al. (2009). Many economists have recommended a market-based approach in the form of a direct or indirect “carbon tax” as the most cost-effective lever to reduce emissions (Metcalf, 2009), acknowledging its implementation would be extremely complex. Therefore, it is vital to understand consumers’ behavioral responses in terms of their WTP and its influence on demand.
Willingness to pay for green goods
Considering the WTP for green goods literature, it appears that individual and household consumption is a vital category that policymakers should target in tackling climate change (Ölander and Thøgersen, 1995). 16 The greenhouse gas emissions generated indirectly—or “embedded”—in purchasing goods and services are a significant portion of an individual’s footprint. For example, Reinders et al. (2003) estimate that half of a household’s energy use in the Netherlands is indirect. Grunert and Juhl (1995) estimate that household consumption is responsible for around 40 percent of ongoing environmental damage. Therefore, individuals need to switch to environment-conscious purchasing to limit further damage to the environment, as Joshi and Rahman (2015) point out.
Environment-friendly or “green” goods can be considered impure public goods. 17 Kotchen (2005) developed an extension to Cornes and Sandler’s (1984) impure public good model to apply it to the environment. The model’s premise lies in the assumption that consumers derive utility from the good’s characteristics rather than the good itself. Therefore, an impure public good, such as one that reduces emissions, would generate both private and public elements (non-rival and non-excludable). Consistent with the properties of a public good, the economic value of climate change mitigation is not fully realized and, thus, is not priced by conventional market mechanisms (Choi and Ritchie, 2014). A Lindahl solution would require individualized prices of mitigation differentiated according to each individual’s WTP, as Siebert (2008) points out; but this is not practical. Instead, economists suggest setting a price (such as an emission tax) equal to the social marginal cost or marginal abatement cost to reduce the exploitation of the environment and its resources (Fullerton et al., 2008). Our study contributes to this literature by using survey data to estimate how individual demand responds to increased prices of high-emitting goods and WTP for more environment-friendly substitutes.
By the law of demand, when the price of a good or service increases, it diminishes a consumer’s willingness and ability to pay. Hence, the question is whether demand for green products differs from standard theory (Kotchen, 2005). If consumers are willing to pay more for a “green” product, it reflects a higher marginal utility for the “green” product (Brécard et al., 2009). In Kotchen’s (2005) model for impure public goods, the comparative statistics show that a rise in the price of “green” products leads to an expected decrease in demand. However, the effect is more ambiguous depending on whether there is a substitute available for the “green” product. Kurz (2018) experimented with reducing meat consumption in two Swedish restaurants and estimated that reducing meat consumption by six percent would require a 12–13 percent increase in price. This is relatively consistent with Andreyeva et al. (2010) who estimate the price elasticity of meat at approximately 0.7. Our results also indicate that the probability of consuming meat will decrease by about five percent if the price increases by one percent; which is of a significantly higher magnitude when considering meat within the household basket of food prices.
Further, consumer budget constraints play a major role in the purchase of green products (especially when considered in substitution of standard alternative products), as most “green” products are expensive (Brécard et al., 2009). Therefore, income is likely to be a strong determinant of “green” demand. However, there is no clear correlation. Consumers with a higher income could pay higher prices for “green” goods if they had preferences for those goods (Li et al., 2016). However, with a higher income, they also have greater choice and so may purchase their most preferred products regardless of their environmental impact. It is possible that those with a low income have strong preferences towards “green” goods but cannot afford to purchase them and, therefore, choose the standard alternative. Li et al. (2016) also found that that respondents who are more knowledgeable and concerned about the adverse effect of climate change show higher WTP. There is a growing literature on the effects of altruism, social norms, ethical values, and beliefs on consumer behavior towards “green” goods. 18 There is a strand of literature in public economics on the altruistic and “warm-glow” effects of an individual’s contribution to the welfare of others. 19 If people are motivated by altruism and “warm glow,” they will demand products that generate a public benefit and exhibit a greater preference for environment-friendly goods. In an experimental setting, Menges et al. (2005) find evidence of impure altruistic behavior when examining WTP for green electricity. Social norms also determine “green” consumption. In particular, Bénebou and Tirole (2006) identify the importance of social reputation. Griskevicius et al. (2010) explored this in an experimental context and found that “green” products often have a lower performance quality but a higher price than their non-green counterparts. They found that participants who purchased a green product were less motivated by their environmental concern than their reputation as perceived by others.
The paper is structured as follows. Section 2 provides a description of the survey data, the calculation of the EF, and descriptive summary statistics. Section 3 presents an empirical analysis, followed by a discussion of the results in section 4. The paper concludes in Section 5 with a summary of the findings and potential policy implications for sustainable consumer practices.
2. Data
2.1 CentERdata
We use individual-level survey data from a questionnaire administered and conducted by the CentERdata at Tilburg University to determine how individual socio-economic and personality characteristics affect EF in the Netherlands. The DNB Household Survey is the largest project based on the CentERdata that collects household-level data as well as information on economic and psychological concepts from a cross-section of the Dutch population to determine household and individual decision-making behavior. In 2010, the CentERpanel and the Tilburg Sustainability Center (TSC) released the first Tilburg Sustainability Monitor (TSM). TSC focuses heavily on climate action and resource efficiency, and the TSM was released to encourage knowledge-building about climate change and environmental issues. The TSM is conducted as a questionnaire among the CentERdata’s household panel. The questionnaire was mailed out to 2,315 individuals who were at least 16 years old and received a response rate of 64 percent (1,477 respondents). The CentERdata included environment-relevant information as well as individual information on gender, age, net monthly personal and household income, educational attainment, living area, and many other characteristics that provide a rich database to conduct EF analyses. 20 The survey was repeated in 2011, mailed out to 2,573 individuals who were at least 16 years old, achieving a marginally higher response rate (69 percent) with 1,765 responses. 21
We match these two surveys using unique household identification and individual household identification number. By this initial merge of 2010 and 2011 data, we get 1,436 respondents, meaning that only 1,436 participants responded to both surveys. Out of these 1,436 respondents, only 1,061 participants answered the net monthly personal, net household income, number of individuals in the household, and the number of children in the household questions. Finally, only 1,058 out of 1,068 answered the personality questions that we use these questions to construct the personality traits. Hence, our final sample size used in the analysis is 1,058.
The sample from the Netherlands is also highly representative of the European population and OECD nations. Compared to other OECD nations, the Netherlands is not different when it comes to CO2 emissions. For example, Japan’s per capita CO2 emissions is 9.703 tons per person, while it is 9.620 tons per person in the Netherlands. This is very similar to Germany (9.112 tons per person) and Finland (9.310 tons per person) 22 . Further, the Netherlands also stands to be at high risk from the influences of climate inaction. For example, if the sea level rises due to climate change, the Netherlands, as a “low-lying country,” could face catastrophic flooding like many low-lying regions worldwide. Hence the regional dimension in the study is of interest to analyze in greater detail.
2.2 Ecological Footprint calculation
Wackernagel and Rees developed the concept of EF in 1996. It is a measure both promoted and developed to evaluate human demand against the capacity of the Earth’s natural resources. Rees and Wackernagel (1996) defined the EF as “an accounting tool that enables us to estimate the resource consumption and waste assimilation requirements of a defined human population in terms of corresponding productive land area.” 23 The more common greenhouse gas footprint or CF is a component of EF. While CF focuses strictly on carbon emissions from the burning of fossil fuels, EF is more comprehensive. However, the two are inextricably linked as CF is estimated to take up around 60 percent of EF (GFN, 2020).
In partnership with Global Footprint Network (https://www.footprintnetwork.org/), The Small Earth released an Ecological Footprint Calculator (EFC) with questions that calculate the individual EF and provide insight into the ways in which lifestyle choices impact this footprint. Questions with regard to meat- and fish- consumption were answered on a scale of 1 to 6 where 1= “I don’t eat meat/fish” and 6 = “Over 2,000 grams per week” (800 for fish). There were also questions regarding kilometers traveled by car, public transport, air travel, and household energy use. Points were given according to each response, with higher points related to higher consumption. The points also differed between questions depending on the impact potential of the activity. For example, the highest points were given to air travel. The points were then totaled to reveal an EF, which could be converted into land use in hectares, if necessary. Details of the EFC are available in Appendix 1.
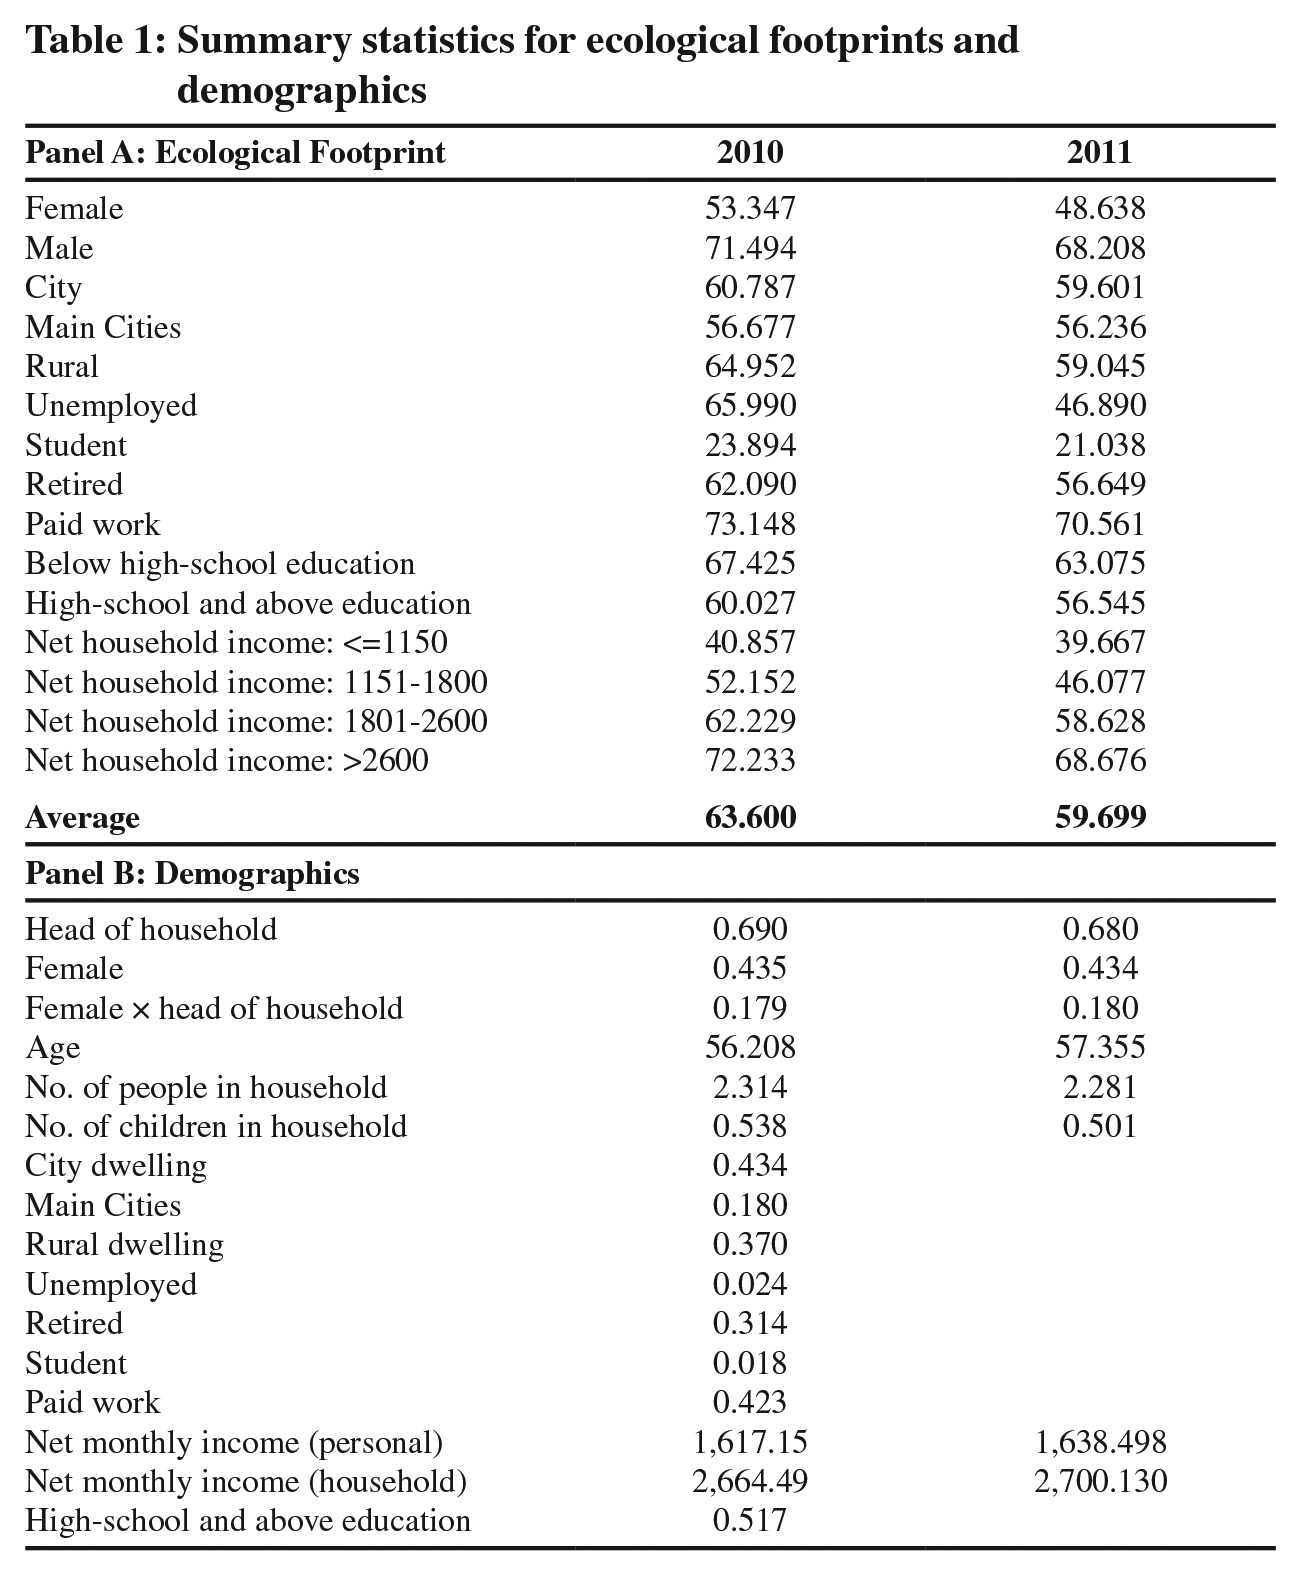
TSC data included the same EFC questions. Based on the responses, we also calculate the EF for each individual surveyed in 2010 and 2011. We report these values in Table 1, Panel A. Our summary statistics indicate that males’ EF is about 20 points higher than females’. Further, paid workers and individuals with higher incomes have a higher EF. There is a small difference between those living in a city and in a rural area, with the average footprint for a rural area being slightly higher. Compared to 2010, the overall average EF decreased by about four points in 2011. However, this difference is less than one percent of the EF of 2010 or 2011.
Summary statistics for ecological footprints and demographics
Considering provinces in the Netherlands in general, Drenthe, Flevoland, and Limburg have the lowest EF scores, while Utrecht and Zeeland have the highest (see Figure A.1.1). However, these average descriptive statistics are not controlled for any observable individual characteristics. Hence, we advise caution in interpreting these patterns.
2.3 Socio-economic characteristics
Several characteristics can predict the effect of an individual’s socio-demographic background on their environmental impact—monthly household and/or personal income, age, gender, home ownership, number of people in the household, educational attainment, and several others. Regional congestion variables are categorized into city, town, and rural dwelling, where a city dwelling is defined by “Very built up to built-up area,” a town is identified as “town,” and a rural area is defined as “less to not at all built up.” The data also identifies the participants’ location in terms of the province and major cities (Rotterdam, Amsterdam, and Den Haag). Respondents indicate their highest level of education. Educational attainment is then categorized into basic, middle-level, and higher education as in Nyhus and Pons (2005) and Pinjisakikool (2017). Basic education includes primary education up to secondary education or junior vocational training through an apprenticeship. Middle-level education includes pre-university education such as senior vocational training. Higher education represents university education. We report summary statistics for these variables in Panel B of Table 1 by year. Given that we have matched the same individuals between the 2010 and 2011 surveys, the demographic characteristics vary only in very few variables (i.e., number of inhabitants in the household and age). Further, please note that, due to matching by individuals in both years, we obtain 1,058 observations in the analysis.
Panel B of Table 1 shows that around 45 percent of respondents identify themselves as head of the household. The average age of the sample is 57 years across both samples, and the sample is relatively evenly split between females and males (43 percent being female). The average net monthly household income is about €2,700 and a net monthly personal income of around €1,600. In terms of educational attainment, about 52 percent of respondents have a high school or higher level of education, and around 18 percent live in the main cities (Amsterdam, Rotterdam, and Den Haag). The mean number of people living in a household is 2.3, and the mean number of children in a household is less than 1. Results also show that 31 percent of the respondents are retired and 1.8 percent are students. In addition, 76 percent of the respondents identify themselves as homeowners.
2.4 Personality traits
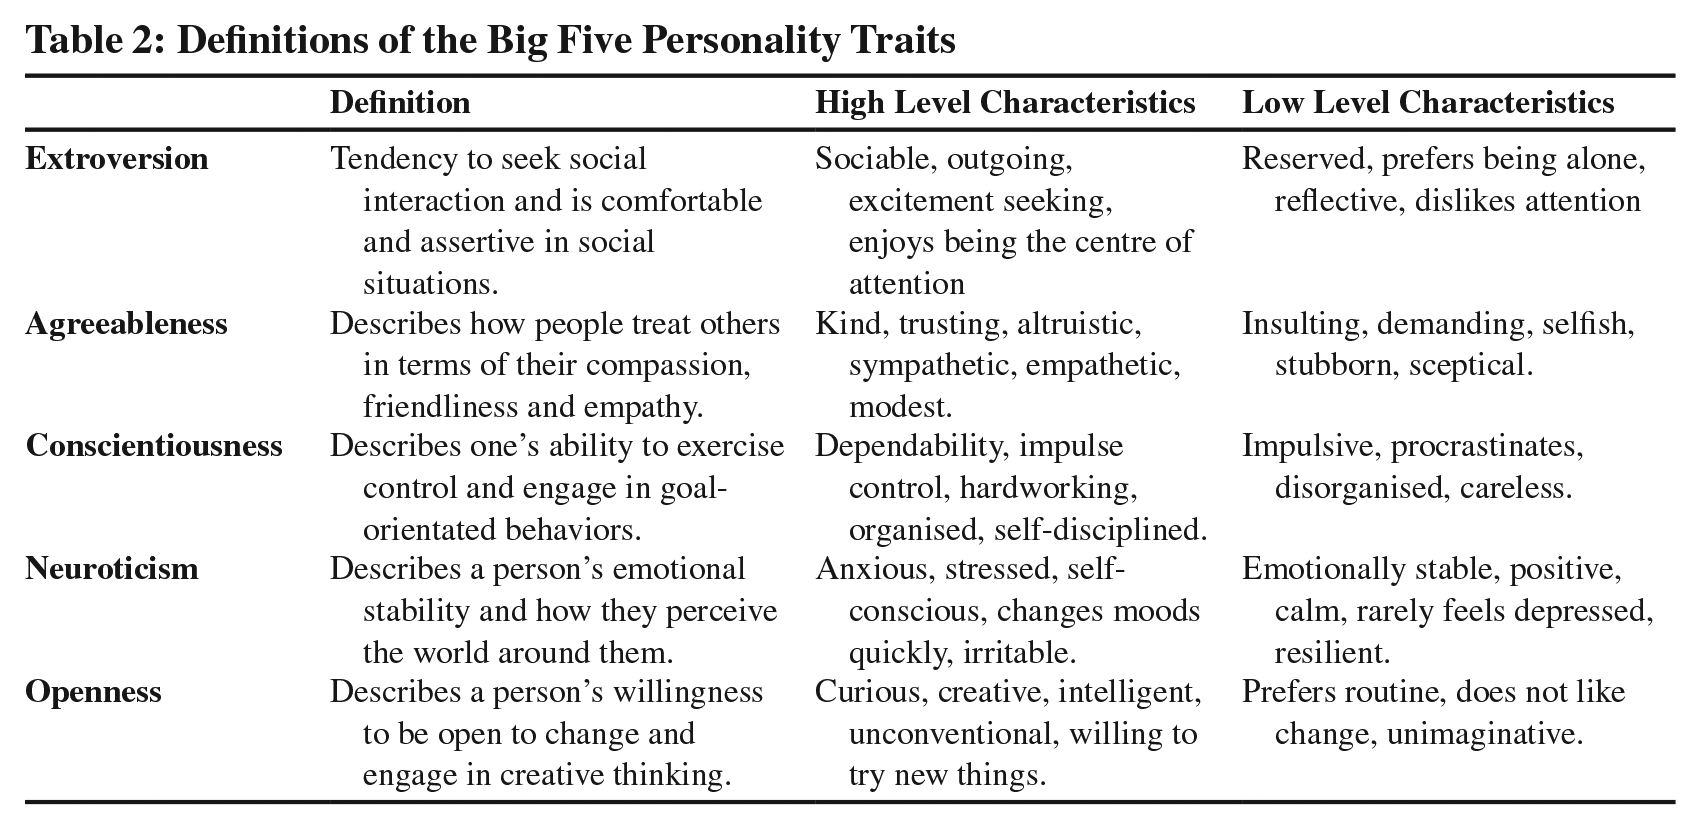
The data for personality characteristics are also gathered from the DHS. The survey uses a 50-item personality scale developed by Goldberg (1992) wherein each personality factor is measured by 10 statements—half of the statements phrased positively and half negatively. Participants respond to each statement on a scale of 1 to 5: totally disagree (1), slightly disagree (2), neither agree nor disagree (3), slightly agree (4), and totally agree (5). The answers from each group of 10 statements were then added together and divided by 10 to get a score between 1 and 5 for each personality trait. The Cronbach alpha’s for each personality factor were as follows: Extroversion (0.82), Agreeableness (0.71), Conscientiousness (0.76), Neuroticism (0.86), and Openness (0.84). These indicate relatively high internal validity in the responses. 24 Table 2 gives brief definitions of each of the Big Five Personality Traits. 25
Definitions of the Big Five Personality Traits
In Figures A.1.2–A.1.6, we map these five personality traits for the 12 provinces of the Netherlands. In Figure A.1.2, we map the Extroversion values of each respondent, averaged by provinces. On average, Flevoland and Friesland respondents respond as more extroverted while subjects from Groningen, North-Holland, and Zeeland seem to be less extroverted. In Figure A.1.3, we map Agreeableness; in Figure A.1.4, we map Conscientiousness; in Figure A.1.5, we show values for Neuroticism; and, in Figure A.1.6, we depict the values for Openness. Darker colors represent higher values and lighter colors represent lower averages. These figures show that there are considerable regional variations in personality traits. One could interpret these figures as we described in Figure 2. For example, North-Holland has the highest rate for openness, while Limburg residents seems to be less open. Considering conscientiousness, Limburg residents are in the highest range, while North-Holland citizens seems to be less conscientious.
2.5 Willingness to pay for “green” goods
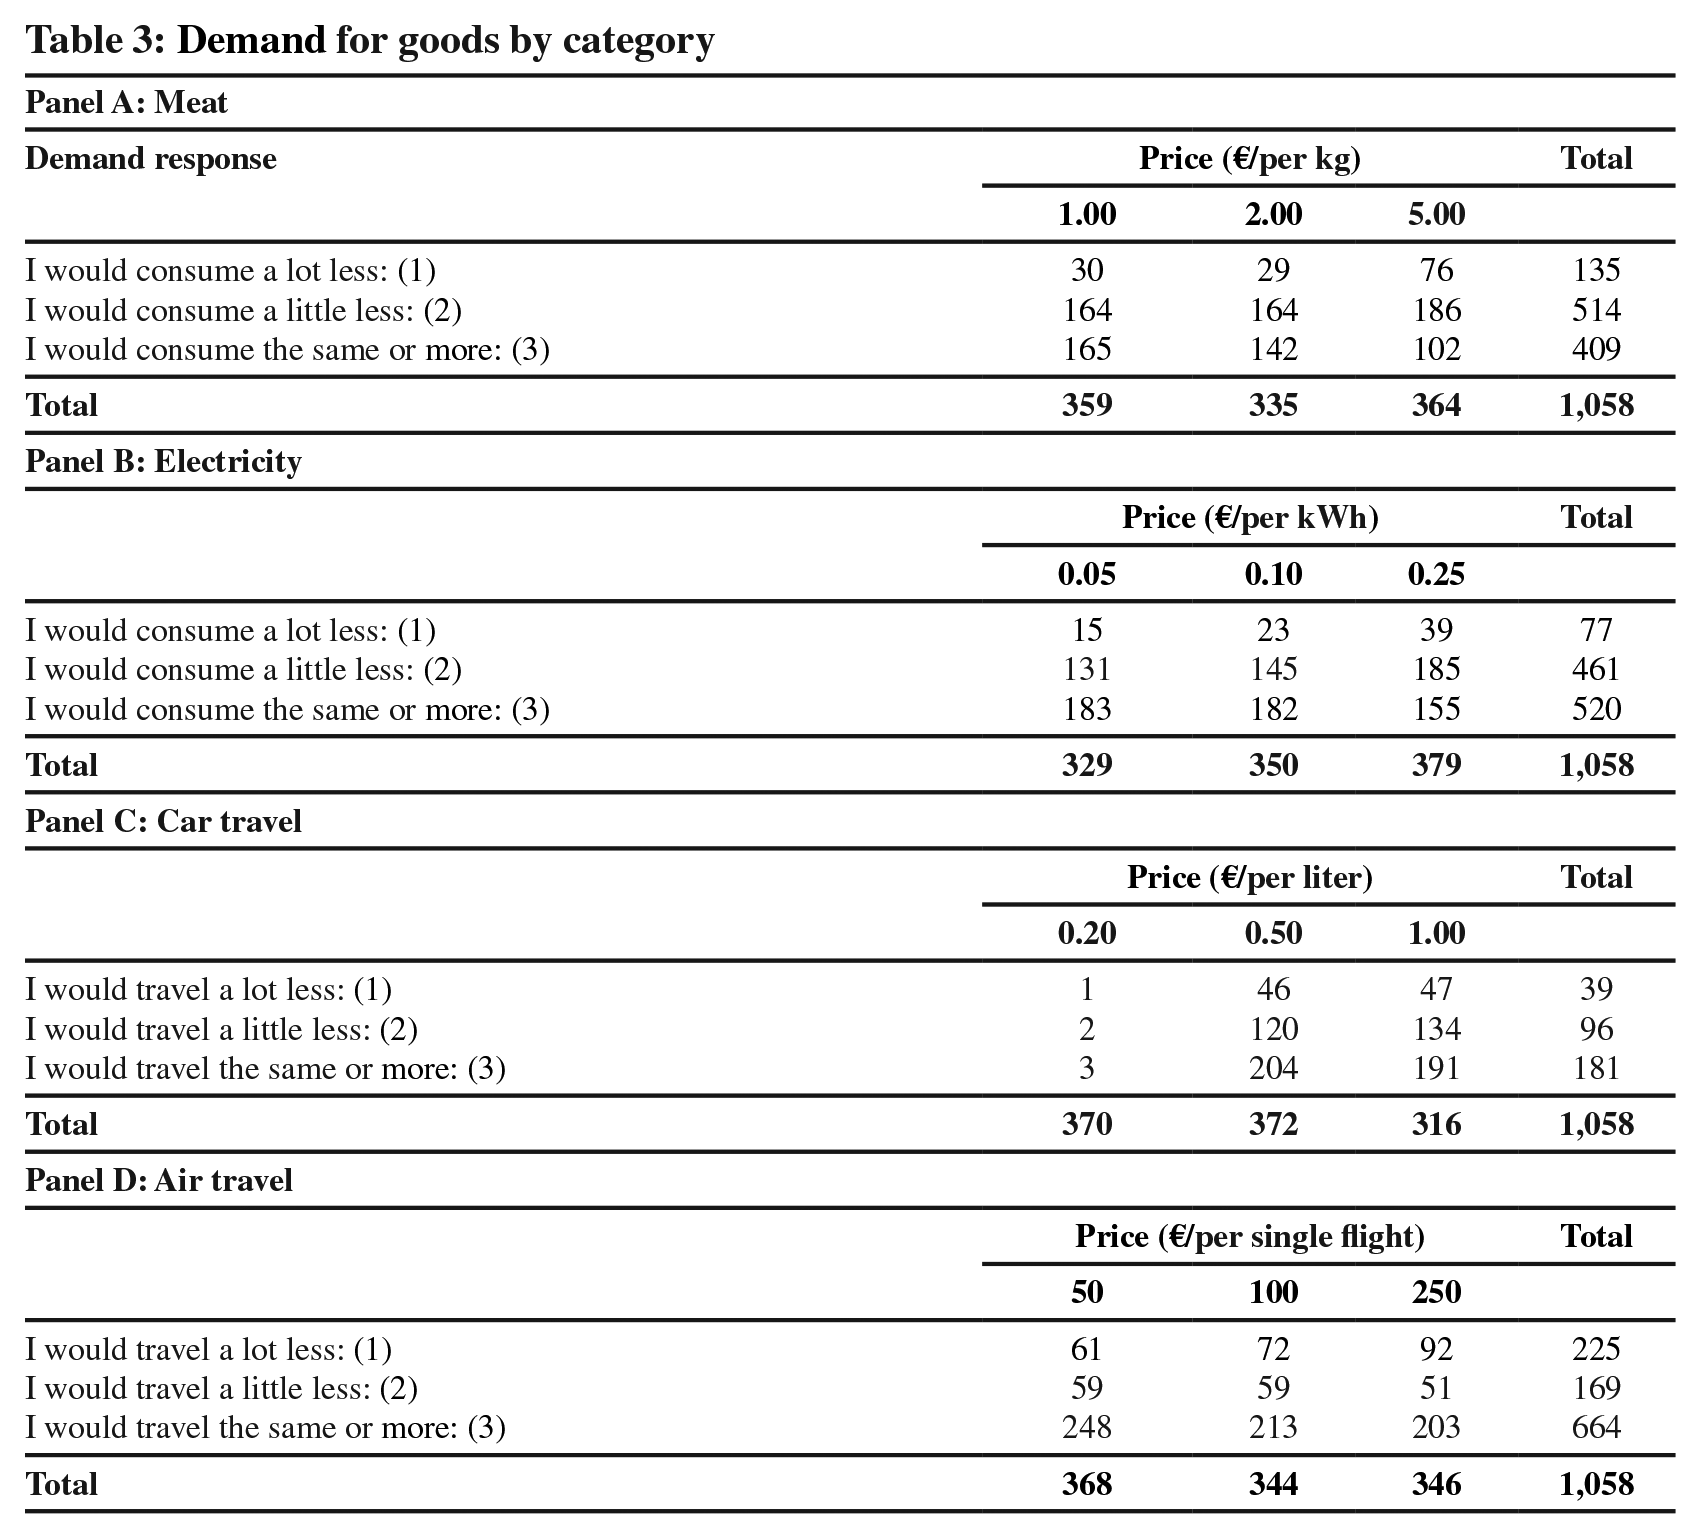
The survey also collects data on individual respondents’ WTP for “green” goods. Participants are informed of a potential policy change. For example: “Meat production is one of the main sources of greenhouse gas emissions. Suppose a global deal was made to make meat production less burdensome for the environment which would increase the price of red meat by 1, 2, or 5 euro per kg.” They were given similar information about energy use in their home, fuel for their cars, and airline ticket prices. Each respondent was randomly assigned one of the three price variables and each was randomly assigned a variable that indicated whether the change would be voluntary or obligatory. “Voluntary” meant that a conventional substitute was available at the current price; hence, switching to a more environment-friendly product was voluntary. “Obligatory” meant that there was no other substitute for sale. Respondents were then asked two questions. First, those for whom the change was voluntary (about 50 percent of survey participants) were asked, “Would you buy the more expensive, environment-friendly meat/electricity/petrol/diesel/flight tickets?” The response options were “Yes” or “No.” Second, all groups were asked, “Would you, therefore, reduce your consumption of meat/electricity/car travel/plane travel?” The response options were “I would consume a lot less,” “I would consume a little less,” “I would not change anything,” “I would consume more.” We found that less than five participants responded by saying that they would consume more. Hence, we combined both “I would not change anything” and “I would consume more.” See Table 3 for a breakdown of these responses by category. We use these data to examine individuals’ WTP for goods given their demographic characteristics and personality traits.
Demand for goods by category
3. Empirical Analysis
3.1 Individual EF
We begin our analysis by examining the determinants of individual EFs. The empirical model is similar to that of Bleys et al. (2017), testing how socio-demographic background and personality traits affect an individual’s environmental impact (in the form of their EF).
We specify an equation that includes a vector of socio-demographic characteristics,

The estimated results for the years 2010 and 2011 are in Table 4. Our results indicate that the higher the personal income, the higher the EF, with an elasticity of about 0.45 for 2011. 27 This finding is consistently statistically significant (at 99 percent) for all our empirical models for both 2010 and 2011. 28 We also observe that, while the net household income is significant (at 95 percent) in 2010, it is statistically insignificant in 2011.
Regression results for ecological footprint
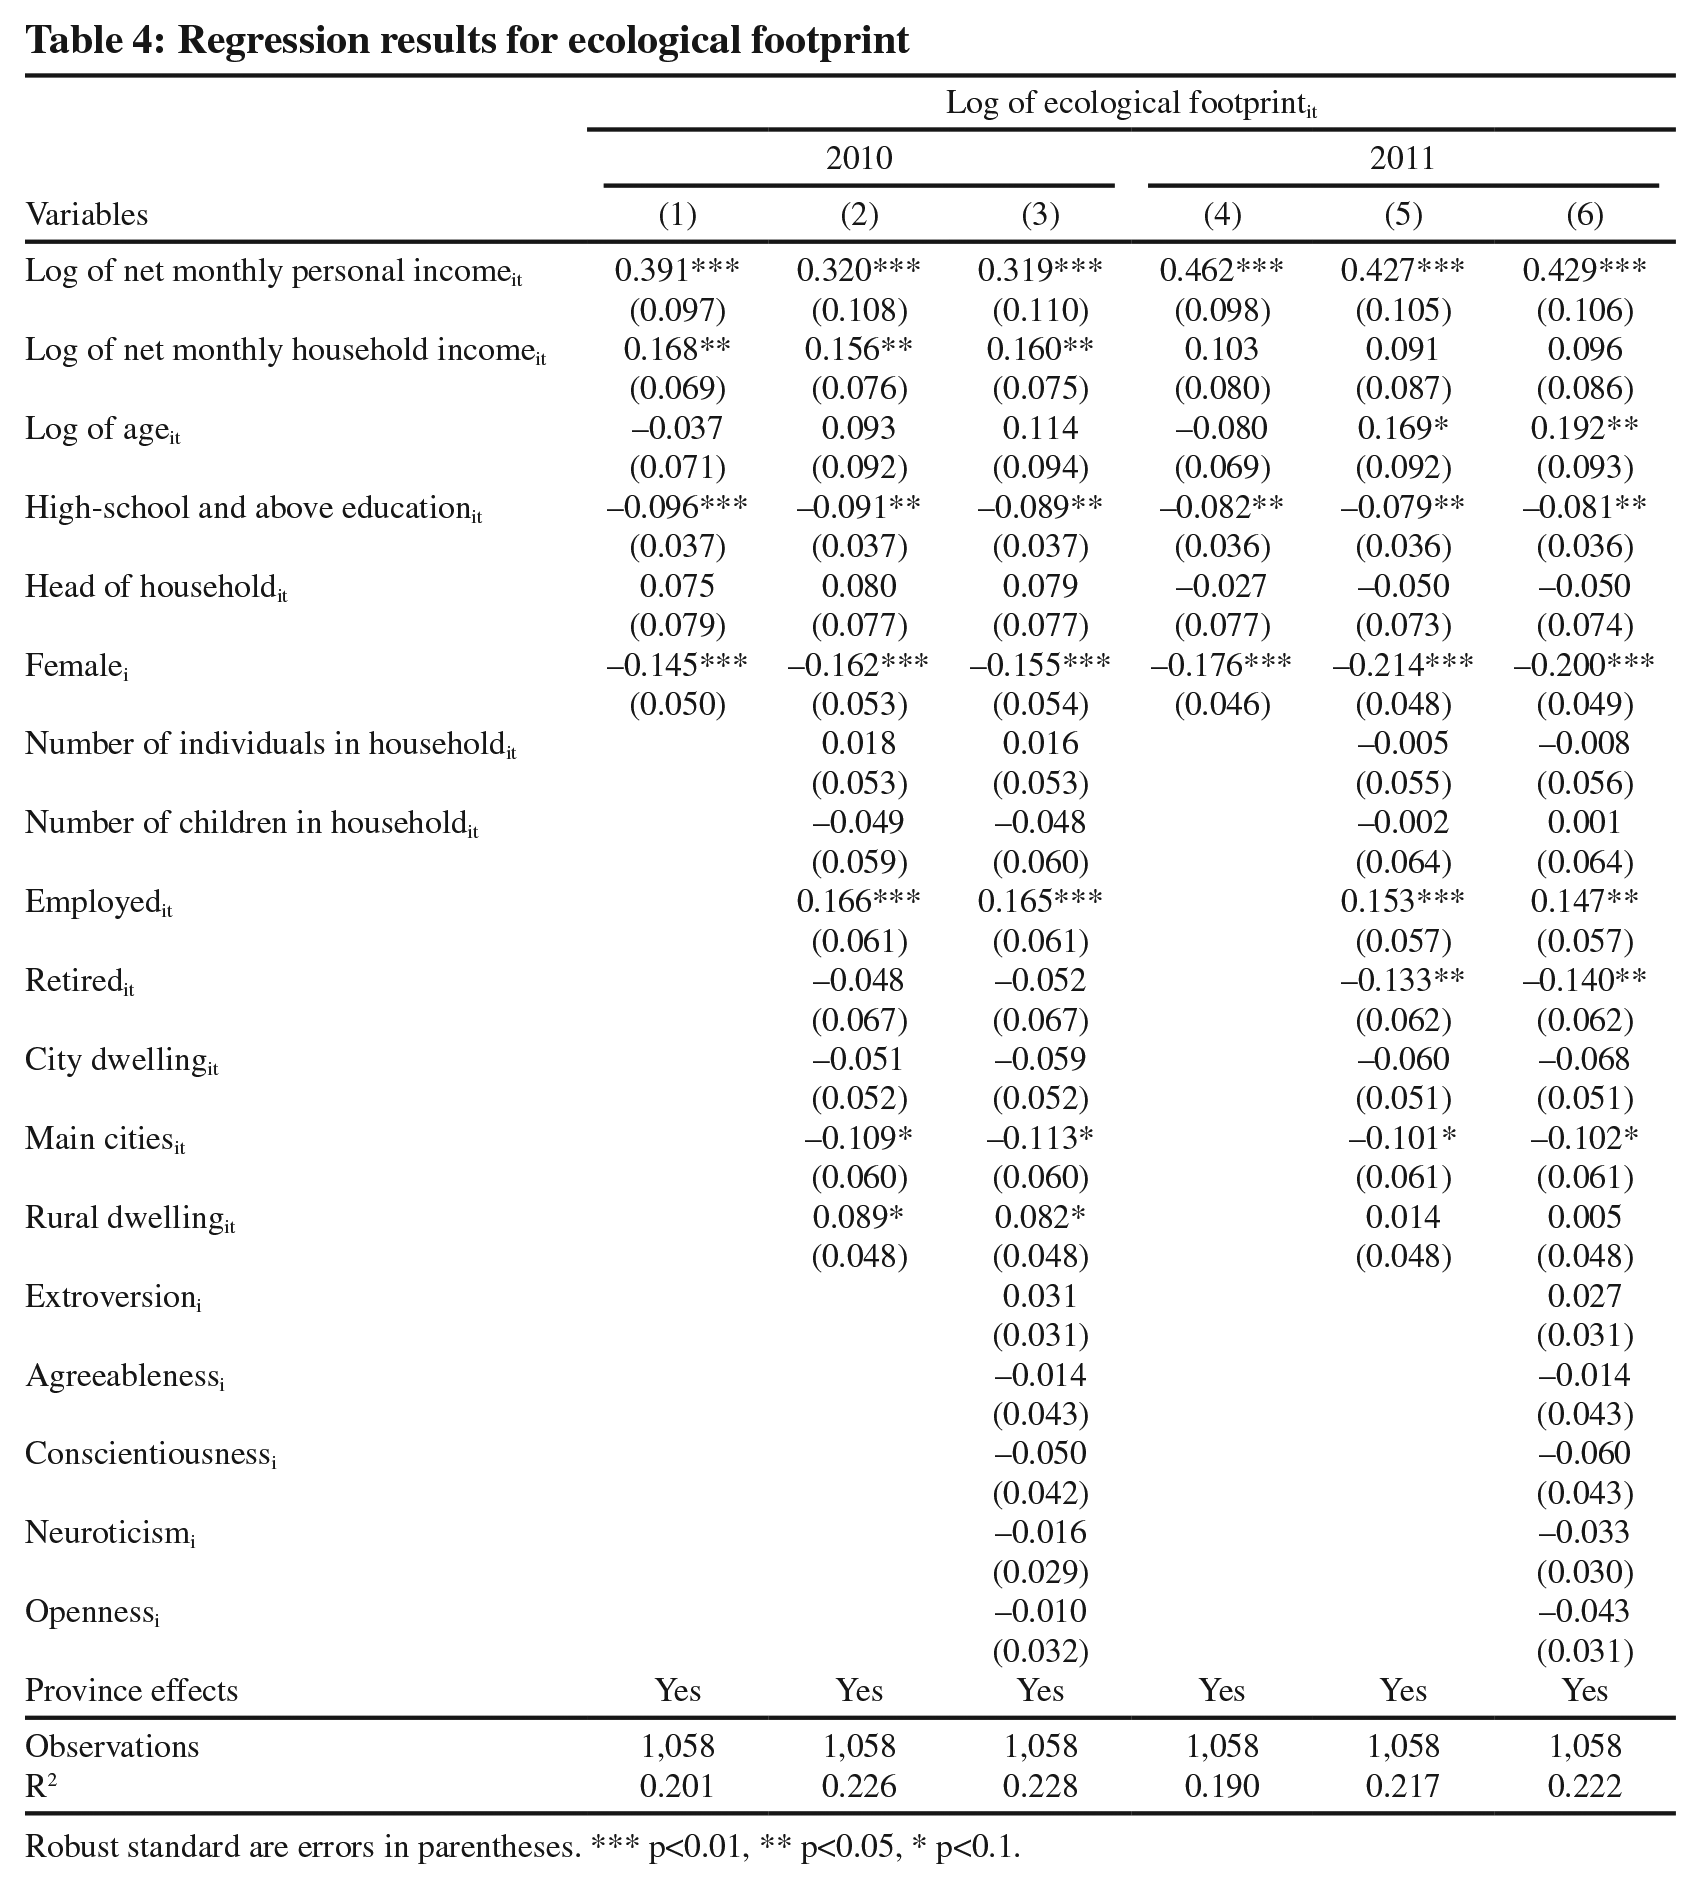
Robust standard are errors in parentheses. *** p<0.01, ** p<0.05, * p<0.1.
The results also indicate that individuals with at least a high school education have a smaller EF. We also find that females have a lower EF, about 12 percent, than males, supporting Zelezny et al. (2000) who state that women report stronger environmental attitudes and behaviors than men. We also find that employed individuals have a higher EF compared to the unemployed or students. Further, people in the main cities have a lower EF. All above mentioned results are statistically significant at least at 95 percent. Interestingly, we do not find any correlation between personality traits and EF.
As a robustness exercise, we also estimate the EF regression (Eq 1) using levels instead of log linear regression. In this case the coefficients provide the change in EF for a unit change in the independent variable in concern. These results are presented in Table A.1 and qualitatively results have similar patterns. For example, if the respondent is a female, then her EF is about 10 units lower than a male subject. These 10 units represent a 10–12 percent difference compared to males (from Table 4.)
3.2 Willingness to pay for “green” products
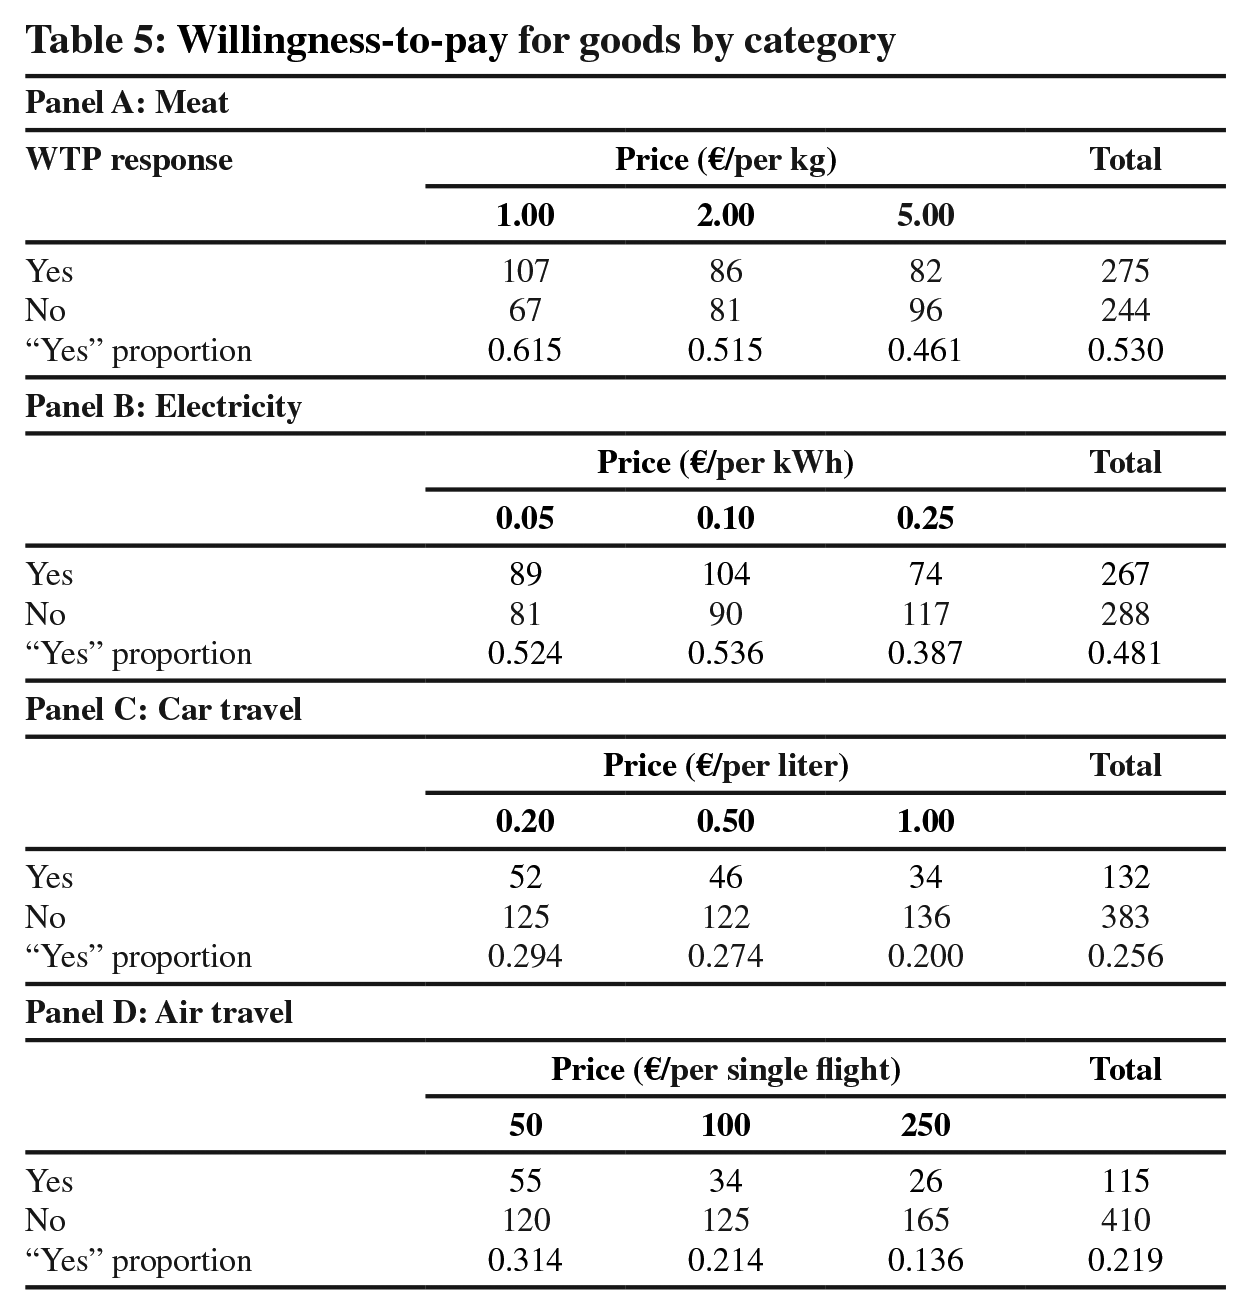
Next, we focus our analysis on WTP using responses from individuals randomly assigned to one of the three price variables. Table 5 displays the results of respondents assigned to the “voluntary” category who were asked if they would be willing to purchase the more expensive environment-friendly products. These offer an insight into consumer WTP for “green” products. For ecologically friendly meat and energy, those answering “Yes” were in the majority up to the highest price category, which shows that respondents were willing to pay a price premium up to a certain point (at least 2 euros and 10 cents, respectively). This result is statistically significant at 95 percent. However, for fuel and flight tickets, the large majority of respondents were unwilling to pay a price premium across all of the price variables. There is also the general pattern whereby, as the price increased, the number of respondents answering “Yes” decreased while those answering “No” increased. The responses for petrol or diesel were relatively consistent and did not show large differences between the three prices.
Willingness-to-pay for goods by category
3.3 Demand for “green” products
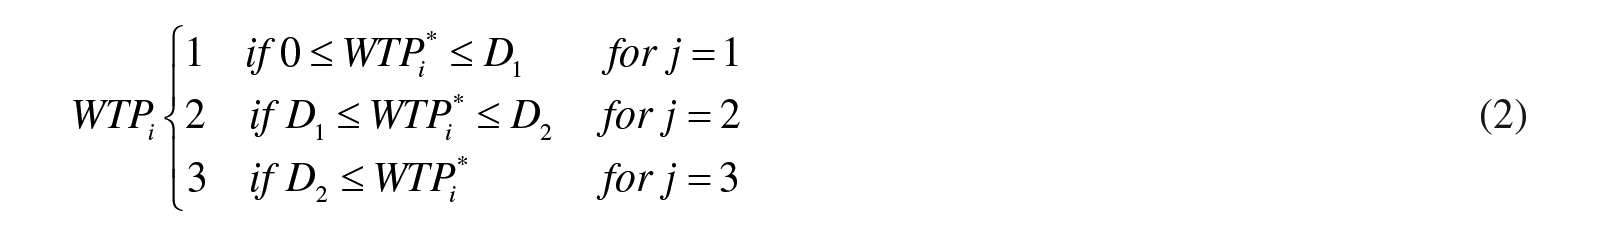
Next, we move to estimate the demand for “green” products. We assume a standard utility function, as in Kotchen (2005), where consumers derive utility from the characteristics of goods. Hence, those that value environmental principles will have a higher WTP for these goods. An ordered probit model assumes that a consumer’s true underlying WTPi* is unobservable and the respondent’s choice of WTPi is observed by the researcher. WTPi falls into one of the ordered categories, j. In our case, there are three categorical choices (Di): 1) consume a lot less, 2) consume a little less, and 3) not change anything or consume more.
where Dj are unknown cut-off parameters to be estimated. Let G(.) denote the standard normal cumulative distribution function and, then, the probability Pr(WTPi = j) can be expressed as:
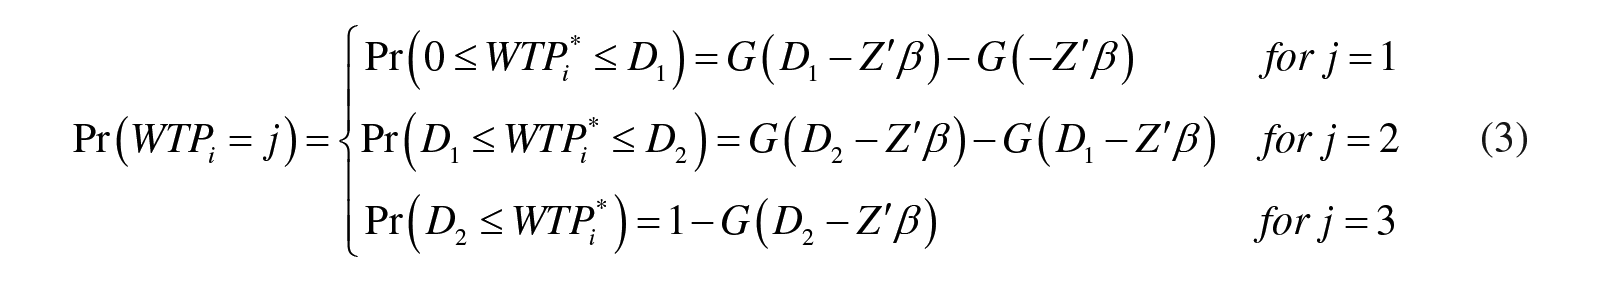
where
As prices increase for meat, electricity, and air travel, our results in Table 5 indicate that individuals were less willing to purchase them. However, respondents were indifferent to price hikes on fuel for car travel. A possible explanation for this is simply that petrol and diesel are highly price inelastic: car travel is the most common method of transport and alternative methods of transport often lack the convenience of traveling by car. Further, fuel price fluctuates by nature and, therefore, in the context of the experiment, respondents’ non-response to increased fuel prices might be a non-cognitive reaction that reflects the fact that drivers are accustomed to changes in fuel prices.
The estimation results from Table 6 particularly imply that price has a statistically significant negative effect (at 99 percent) on WTP. Next, we take a deeper look at the estimated average marginal probability effects or marginal probability effects at the means of the price for each good. We present these results in Table 7. Considering meat prices, we observe that, as the price increases, consumers’ average marginal probability effect of price on the choice of “not change anything or consume more” is decreased by 12.5 percent. Similar conclusions could be derived for electricity and air travel. It is clear that the demand for fuel for vehicles will not be affected.
Ordered probit results for demand for products
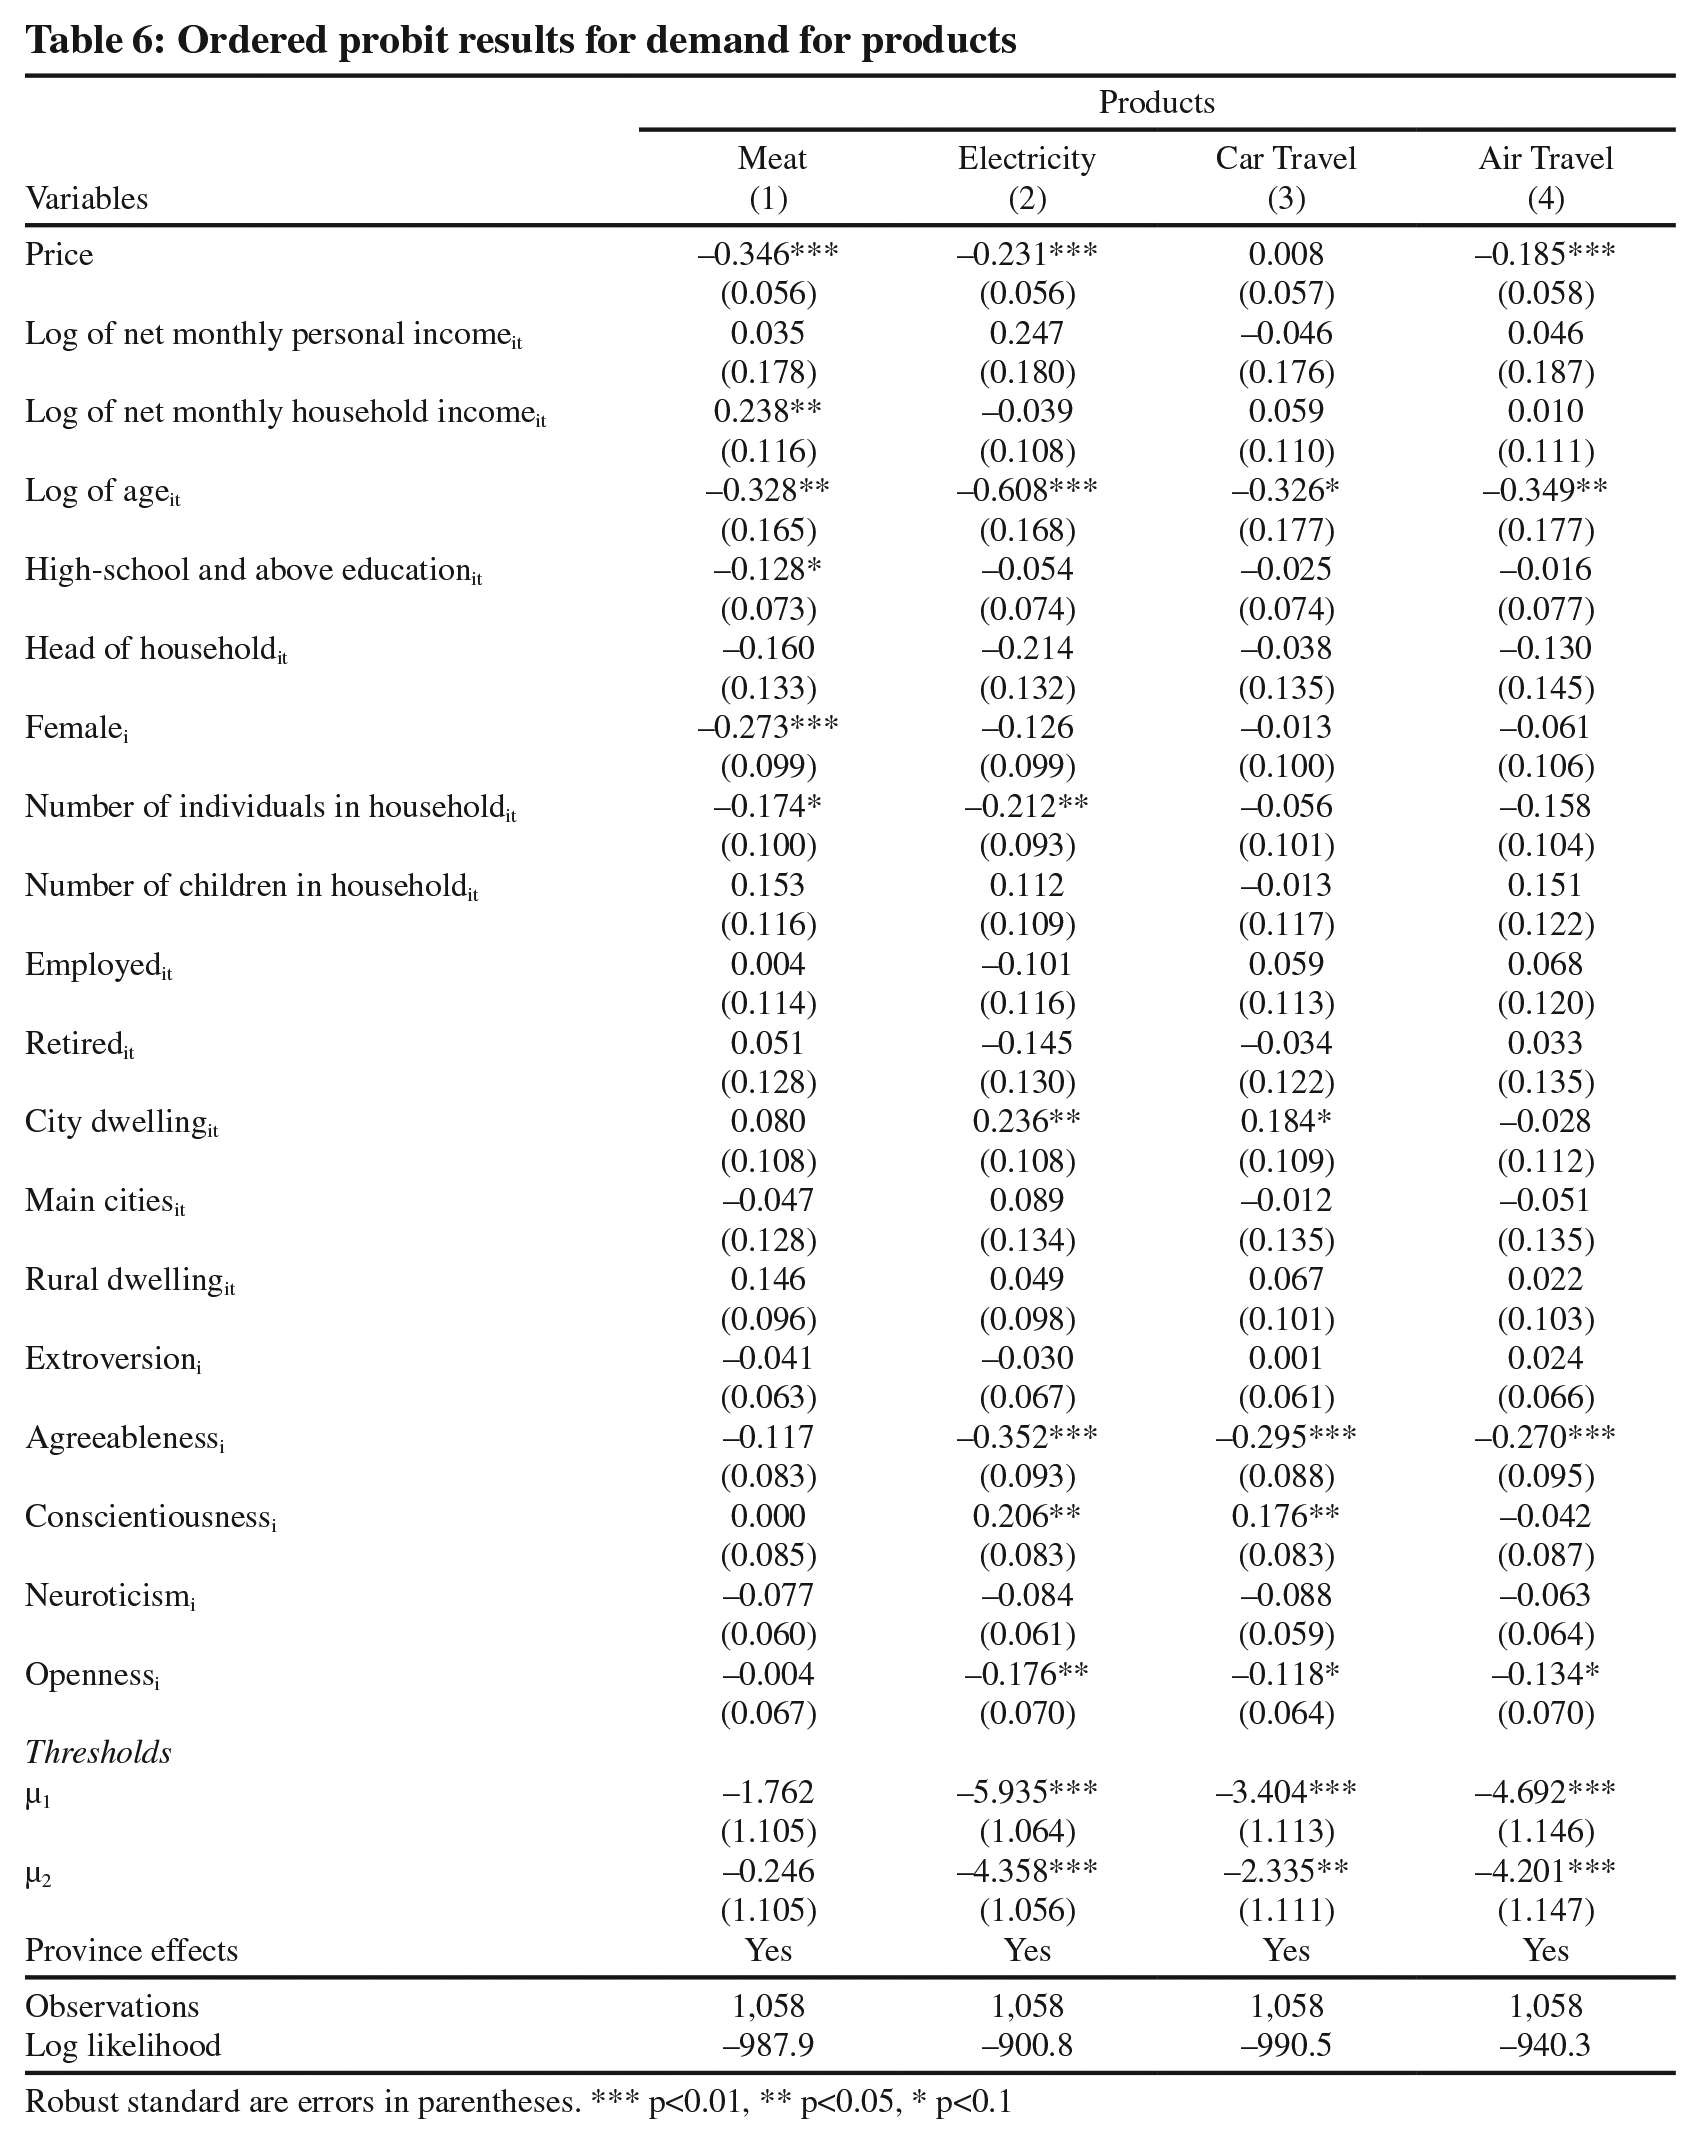
Robust standard are errors in parentheses. *** p<0.01, ** p<0.05, * p<0.1
Marginal probability effects of price
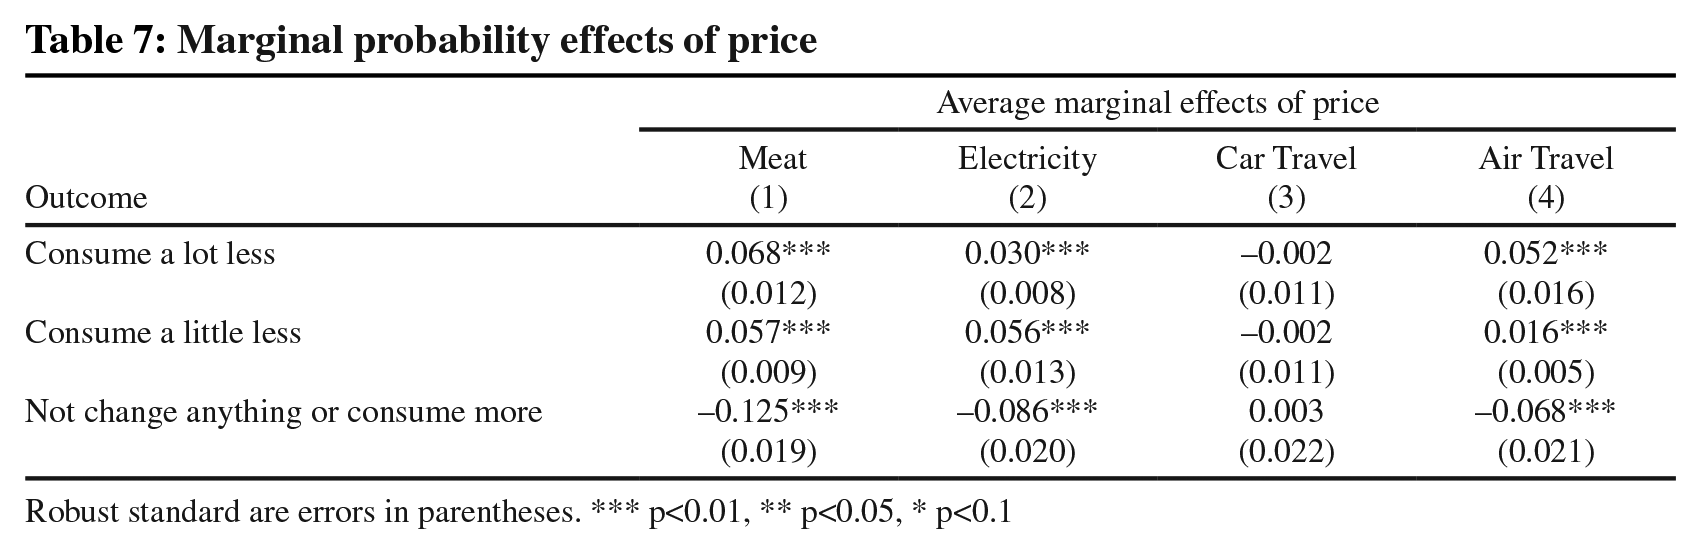
Robust standard are errors in parentheses. *** p<0.01, ** p<0.05, * p<0.1
Considering personality traits, individuals who describe themselves as “high in agreeableness” do not seem to agree to pay higher prices for greener goods—at least for electricity, car, and air travel. Individuals with a high “conscientiousness” score are willing to pay higher prices for electricity and fuel for car travel. And, finally, individuals who indicate that they are “willing to be open to change and engage in creative thinking” are less willing to pay for greener goods. Our results also indicate that, as individuals age, they seem unwilling to purchase greener goods at a higher price.
Finally, as a robustness exercise, we re-estimate Table 6 with dummies for prices. These results are presented in Table 8. From these results—for example, for meat—we can clearly see that individuals are indifferent to paying a premium of at least two euros. However, their consumption patterns drastically change if they have to pay five additional euros per kilogram of meat. Similar inferences hold good for all other goods. As before, the results indicate that demand is not responsive to price increases in petrol.
Ordered probit results for demand for products – alternate specification
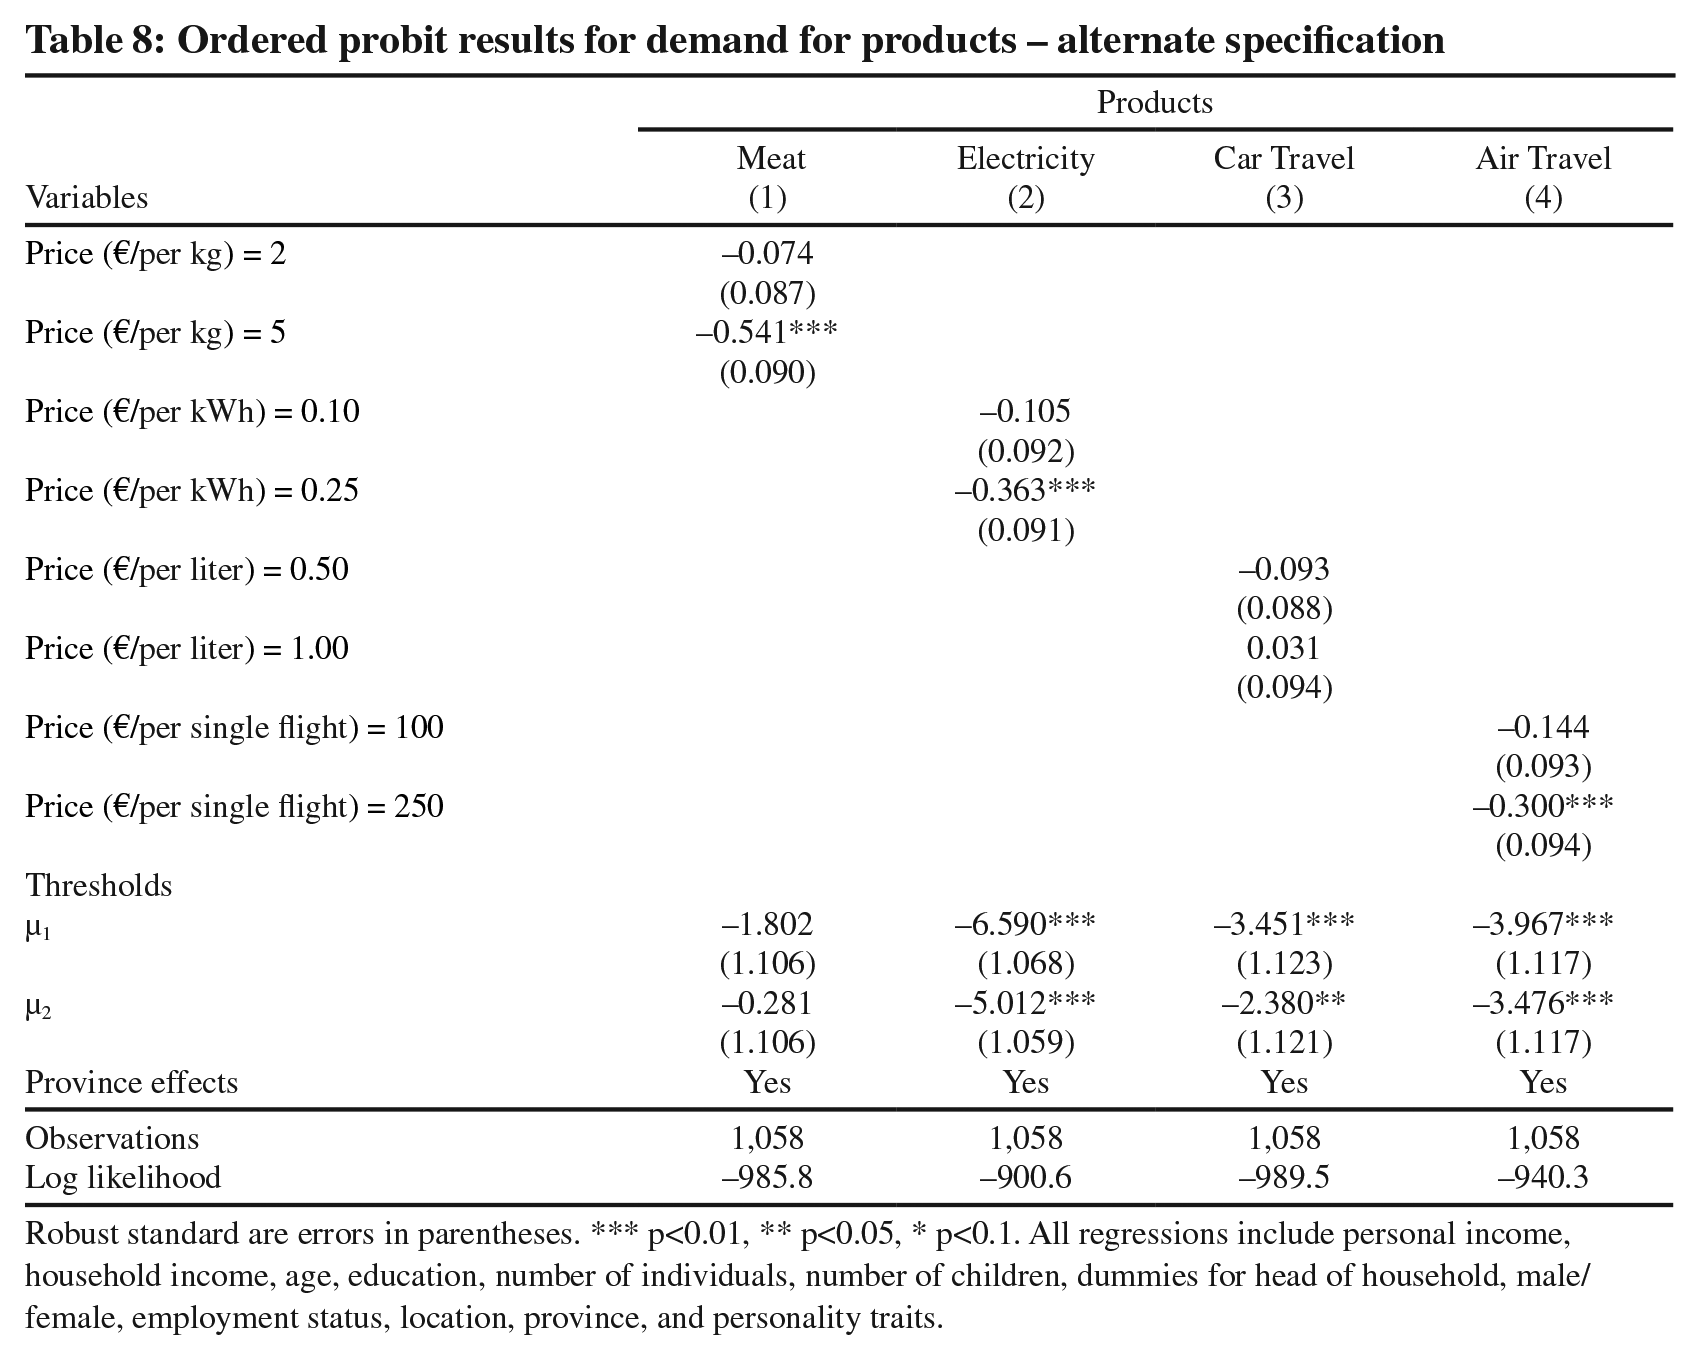
Robust standard are errors in parentheses. *** p<0.01, ** p<0.05, * p<0.1. All regressions include personal income, household income, age, education, number of individuals, number of children, dummies for head of household, male/female, employment status, location, province, and personality traits.
4. Discussion
When considering our results from the EF analysis, the significance of several socio-demographic characteristics suggests the potential success of targeted policies. Our results consistently indicate that individuals with higher personal income have higher EF. From a consumer standpoint, it is reasonable to assume that an individual with a higher income would have a greater ecological footprint. With more disposable income come greater opportunities and a wider range of spending options (Roca, 2003). For instance, greater disposable income might be spent on more holidays or choosing holidays in more exotic, cross-continental destinations. This requires more air travel—a significant contributor of greenhouse gas emissions. This is the same for car use: a household with a higher income is likely to have multiple cars per family (which leads to higher emissions) as well as the ability to afford more everyday purchases such as clothes, food, and entertainment, all with an increasing carbon bill attached. The higher footprint of wealthier households may also be a reflection of their structural constraints. As mentioned before, in developed countries, it is common for the wealthier in society to move to the suburbs to acquire more land and benefit from the amenities of out-of-city living. However, this will require a longer commute to work, increased car use, and more energy to power bigger homes.
Further, our results indicate that EF is less for people with at least a high-school degree. Also, Moser and Kleinhückelkotten (2018) point out that environmental awareness campaigns can serve to educate all members of society. However, this can only translate into significant environmental impact if the required behaviors are congruent with one’s income. This argument is often made on the basis of the “polluter pays” principle as well as the greater capacity to bear mitigation costs (Büchs and Schnepf, 2013). The ecological calculator used in this analysis could be a potential tool in raising awareness of the dangers of current consumption habits as well as educating people on how to reduce their footprint. Hence, incorporating material related to environment to a curriculum even from primary school will help educate the importance of sustainable growth.
Considering the WTP analysis, our results found that, in general, respondents were willing to pay a price premium for sustainably produced meat and household energy that presents potential policy implications in respect to these products. In particular, information strategies and persuasion campaigns might be promising for these goods as they demonstrate a positive voluntary response to a policy change. These may be particularly successful when targeted at high-income households that have the means to switch to “green” energy in their homes and bear set-up costs. 30 Further, lack of WTP a voluntary price premium for air travel is consistent with the literature and, therefore, a mandatory policy change might be necessary. 31 However, respondents were indifferent to price hikes on fuel for car travel.
This suggests that mitigating the environmental impact of travel may have to come from other factors, for example, increasing the accessibility of viable alternatives such as hybrid or electric cars (Hössinger et al., 2017). This might be achieved through subsidy schemes such as the UK’s Plug-in Car subsidy payments to consumers of electric cars up to £3,000 (Department for Driving and Transport, 2020), which has consequently seen a growth in the electric car market. Lifestyle changes would also reduce the demand for car use. For example, working from home has become the norm for many people, especially more recently in light of the Covid-19 pandemic. Recently, many academic, non-academic, private, and government institutions in EU has adopted a “travel by train” policy if the distance is below a certain threshold and reachable by train and bus. Note that most of the trains in EU is using electricity.
Further, regulators often use progressive carbon tax, energy tax, or emissions tax as policy tools to sufficiently reduce demand and, hence, lower EF (See Bashmakov et al., 2007). An example is a Pigouvian tax that aims to correct the negative externality of greenhouse gas pollution by imposing a tax equal to its marginal social cost (Baumol and Oates, 1971; Marron and Toder, 2014). Imposing a tax on the consumption of meat, air travel, and household energy, for example, targets not only those keen to take measures to protect the environment but also those who will reduce their demand to save money, with environmental benefits being just a positive by-product. In an economists’ statement on carbon dividends, 3,589 US economists (including 27 Nobel Laureates) stated that a carbon tax would be “the most effective lever to reduce carbon emissions at the scale and speed that is necessary” (Wall Street Journal, 2019). Many governments worldwide have implemented a form of carbon taxation with varying degrees of success (in most part due to its political viability) and, thus far, the overall impact has been relatively modest (Metcalf, 2009).
However, Marron and Toder (2014) note that, despite its potential for reducing demand, levying such a tax comes with implementation costs, including setting the tax rate, collecting the tax, and distributional costs. Consumption taxes tend to be regressive and have potentially unwelcomed welfare repercussions wherein they impact the living standards of low-income individuals disproportionately. Metcalf (2009) notes that, in terms of fairness, this is problematic as the results in this paper have demonstrated that it is the higher-income earners who disproportionately impact the environment, but it is the lower-income earners that will be forced to pay a larger proportion of their income. Therefore, as pointed out by Marron and Toder (2014), the redistribution strategy of the tax revenue is crucial to offsetting its regressivity as well as being essential in building political support. Therefore, thoughtful consideration is needed when deciding whether such a policy would be appropriate.
5. Conclusion
In the past, research has focused on pro-environment behaviors in individuals and has neglected research into the actual environmental impact of behaviors. In this paper, we have taken this impact-orientated perspective to determine the factors that influence an individual’s environmental impact over two years as measured by their EF. This paper also contributes to the discussion of using market-based solutions in the form of price mechanisms to limit unsustainable consumption and, thus, reduce individuals’ EFs. This is a global debate that is highly policy-relevant—the efficacy of implementing a tax on carbon emissions as a mitigation strategy.
Using survey data from a representative sample of the Netherlands population, the results reveal significant variation in EFs and WTP across different socio-demographic groups and personality traits. We find that higher-income individuals significantly have higher EFs. We also find that females and individuals with at least a high school degree have lower EFs.
From a consumption perspective, most environmental impacts arise from transportation, housing, and food (for example, see Druckman and Jackson, 2016). Therefore, this paper also shows important results regarding WTP for more environment-friendly goods in these three consumption categories. In general, respondents were willing to pay a price premium for environment-friendly meat and household energy. Additionally, demand was responsive to increasing prices for meat consumption, household energy, and air travel. However, demand for car travel was unresponsive to increasing the price of fuel.
Supplemental Material
sj-pdf-1-enj-10.5547_01956574.45.1.ddes – Supplemental material for Ecological Footprint and Willingness to Pay for Green Goods: Evidence from the Netherlands
Supplemental material, sj-pdf-1-enj-10.5547_01956574.45.1.ddes for Ecological Footprint and Willingness to Pay for Green Goods: Evidence from the Netherlands by Dakshina G. De Silva, Tiffany Head, Rachel A. J. Pownall and Anita R. Schiller in The Energy Journal
Footnotes
Appendix A
Acknowledgements
We would like to thank four anonymous referees for their valuable comments.
1.
2.
Li, Mu, Schiller, and Zheng (2016) have examined the WTP pay for energy-efficient and environmentally friendly goods in general in China.
3.
The Netherlands was one of the founding members of the Benelux, the NATO, Euratom and the European Coal and Steel Community, which would evolve into the EEC (European Common Market) and later the European Union.
4.
See Steg and Vlek (2009), Swami et al. (2011), Moser and Kleinhückelkotten (2018), Gatersleben et al. (2002), Van Liere and Dunlap (1980), and ![]() .
.
5.
See Abrahamse and Steg (2009), Frederiks et al. (2015), and ![]() .
.
6.
Abrahamse and Steg (2009) and ![]() also use self-reported survey data to estimate household energy use.
also use self-reported survey data to estimate household energy use.
7.
See Yiqing et al. (2012), Curry et al. (2011), and ![]() .
.
8.
See Nyhus and Pons (2005) and ![]() .
.
9.
See Hendriks et al. (1999) and ![]() .
.
11.
13.
See Abrahamse and Steg (2009), Bruderer-Enzeler and Dickmann (2015), Csutora (2012), Diekmann and Jann (2000), Moser and Kleinhückelkotten (2018), and ![]() .
.
14.
See Bruderer-Enzler and Dickmann (2015), Kennedy et al. (2015), Notter et al. (2013), Csutora (2012), and ![]() .
.
16.
While the consumption of “green” goods appears to be increasing and many researchers report a WTP for climate change mitigation in various contexts, there still exists a gap in the literature between the consumer’s expressed preferences for “green” products and their actual purchases (Vermeir and Verbeke, 2008). Also see Mazar and Zhong (2010), Brécard et al. (2009), Schwirplies and Ziegler (2016), Choi and Ritchie (2014), Tobler et al. (2011), Oliver et al. (2011), and ![]() .
.
17.
See Kotchen (2005), Choi and Ritchie (2014), and ![]() .
.
18.
See Frey and Stutzer (2006), Griskevicius et al. (2010), and ![]() .
.
19.
For example, see Andreoni (1990) and ![]() .
.
20.
The data have not been made available for academic use until recently, and since their release this is the first research paper, to our knowledge, that has been able to utilise this interesting data set. As noted by Kennedy et al. (2015) the use of self-reported survey data to estimate the actual environmental impact of individuals, as we do in this study, is scarce. Further, as a person’s personality traits are stable over time (see Nyhus and Pons, 2005 and Clark and Schurer 2012), we used this data with great interest, even though the survey data were conducted in 2010 and 2011.
21.
![]() note that, compared to the official demographic statistics for the Netherlands—the Statistics Netherlands (CBS)—the CentERpanel is very similar across the dimensions of age, gender, education level, household size, and average disposable income. It is a highly reputable survey that has been used extensively for research in the literature; see for example the work on financial literacy, Lusardi and Mitchell (2014).
note that, compared to the official demographic statistics for the Netherlands—the Statistics Netherlands (CBS)—the CentERpanel is very similar across the dimensions of age, gender, education level, household size, and average disposable income. It is a highly reputable survey that has been used extensively for research in the literature; see for example the work on financial literacy, Lusardi and Mitchell (2014).
23.
For example, the Global Footprint Network estimates that, in 2009, there was, on average, 2.1 hectares of land available for each person on Earth. However, we are currently using 2.7 hectares. Therefore, we are, on average, over capacity by 30 percent. By 2019, there were 1.6 hectares available (GFN, 2020) while, in 1996, the US was already averaging around 4.5 hectares per person (Bazan, 1997).
24.
Cronbach’s alpha is a measure of internal consistency—how closely related a set of items are as a group. It is a measure of scale reliability. Note that Cronbach’s alpha is not a statistical test but a coefficient of reliability (or consistency).
25.
See, John (1990) and John & Srivastava (1999) for more details on Big Five Personality Traits.
26.
The quadratic effect of age is also included in these empirical models to account for the non-linear effect of age on an individual’s EF.
27.
The 95 percent confidence interval is between 0.221 and 0.637.
28.
We compute the sample size required to detect a change in the EF by 40 percent per 1 percent change in income, with 90 percent power using a 5 percent-level two-tailed independent samples t-test. Using values obtained from the sample, we specify a standard deviation of 0.416 for log of personal income and 0.636 for EF. The minimum n required is 148. For log of age, which has the smallest standard deviation of 0.326, the minimum n required is 991 to detect a 20 percent change. The rule of thumb is to use 80 percent power and, in this case, the corresponding ns’ are 111 and 741 for log of personal income and log of age respectively.
29.
We estimate these using the ordered logit regression technique and the results are similar.
30.
See Oliver et al. (2011) and ![]() .
.
References
Supplementary Material
Please find the following supplemental material available below.
For Open Access articles published under a Creative Commons License, all supplemental material carries the same license as the article it is associated with.
For non-Open Access articles published, all supplemental material carries a non-exclusive license, and permission requests for re-use of supplemental material or any part of supplemental material shall be sent directly to the copyright owner as specified in the copyright notice associated with the article.