
Abstract
Background
In renal cell carcinoma (RCC) of the clear cell type, inactivity of the VHL gene induces overexpression of HIF1 α and its targets, the tyrosine kinase receptors, promoting RCC development and progression. The discovery of tyrosine kinase inhibitors (TKIs) changed the treatment of these tumors. Other molecular pathways involved in the TKI mechanisms of action have not been described in the literature. The aim of our study was to elucidate alternative mechanisms of action of sunitinib in tumor tissue after neoadjuvant treatment of RCC.
Methods
The gene expression profile was accessed using microarray (Affymetrix Human Genome U133 Plus 2.0 platform) and frozen RCC tissues collected from 5 patients with locally advanced non-metastatic tumors who underwent nephrectomy after being treated with 2 cycles of neoadjuvant sunitinib. The results were compared with matched controls comprising 6 patients with no neoadjuvant intervention.
Results
There was underexpression of the majority of genes after sunitinib treatment. The lower expression levels of IGFBP1, CCL20, CXCL6 and FGB were confirmed by qRT-PCR in all cases. The downregulation of gene expression leads us to search for methylation as a mechanism of action of the TKI. IGFBP1 was shown to be methylated by methylation-sensitive high-resolution melting technique.
Conclusions
The ultimate genetic effects of sunitinib may explain its actions as an antitumor drug that apparently suppresses the expression of important genes related to cell survival, adhesion, invasion and immunomodulation. The methylation of gene promoters was shown to be part of the mechanism of action of this class of drugs.
Keywords
Introduction
The treatment of renal cell carcinoma (RCC) has been revolutionized due to the understanding of tumor biology resulting from the elucidation of the role of the VHL tumor suppressor gene (1, 2) and the HIF pathway in its pathogenesis (3). Antiangiogenic therapy with anti-VEGF monoclonal antibodies or oral tyrosine kinase inhibitors (TKIs) has become the standard of care for patients with metastatic RCC and is considered the first line of treatment. Tyrosine kinase receptors are transmembrane proteins; they contain an extracellular ligand-binding domain that receives their cognate ligands, and an intracellular catalytic domain responsible for initiating the signal transduction of the respective downstream pathways (4–6).
Treatment with bevacizumab (a monoclonal antibody targeting VEGF) in association with interferon-alpha, sunitinib, sorafenib, pazopanib and cabozantinib (TKIs) (7–11) has led to improved survival of RCC patients in pivotal phase III trials. These are now the mainstay treatments in the management of metastatic RCC of the clear cell type in patients with good or intermediate-risk disease. These drugs all have the VEGF signaling pathway as their main target. Angiogenesis involves a complex interplay between different cells, soluble factors and extracellular matrix (12, 13). VEGF-A induces vascular permeability, cell migration, proliferation and survival through its binding to VEGFR-2 (14). In in vivo tumor models, sunitinib reduces the tumor microvessel density by inhibiting neovascularization (15).
The previous success of elaborating on the molecular intricacies of gene expression related to angiogenesis appears to be of great value, and thus the search for additional therapeutic targets should continue. Gene expression profiling has been investigated recently to identify specific features of tumors versus normal tissues. Few different methodologies have been pursued to identify baseline patterns that might help elucidate the mechanisms of carcinogenesis and find potential biomarkers to be targeted in interventional studies.
Some studies have attempted to discover which genes are activated in tumors so that endothelial cells can proliferate and promote tumor growth. The mediators known to activate endothelial cells include growth factors, proteins such as collagens and fibronectin, proteases and cytokines (16–19).
The aim of the present study was to elucidate alternative mechanisms of action of sunitinib in tumor tissue after neoadjuvant treatment of RCC. From August 2009 to December 2010, patients with locally advanced RCC were invited to participate in an open-label trial that examined the results after 2 cycles of neoadjuvant sunitinib treatment. The trial's main endpoint was to identify tissue biomarkers by detecting specific alterations promoted by the drug and trying to discover alternative mechanisms of action.
Patients and Methods
Patients
The study was approved by the institutional ethics committee (0828/07). Initially, our aim was to accrue 27 patients. The inclusion criteria were i) renal cell tumor larger than 7 cm without distant metastasis; ii) renal cell tumor smaller than 7 cm but with distant, resectable metastases; iii) normal renal function; iv) normal blood test results; v) normal liver function. The exclusion criteria were i) use of anticoagulants; ii) abnormal kidney function; iii) coagulopathy; iv) presence of active bleeding.
After an informed consent document was given to the initial 18 patients, 13 were deemed eligible and 5 were ineligible. Of the 13 eligible patients, 7 agreed to take the medication. These 7 patients received 2 cycles of neoadjuvant sunitinib 50 mg/day for 4 weeks; the remaining 6 patients underwent upfront radical nephrectomy and made up the control group. One patient who had received neoadjuvant treatment had more advanced disease and died from abdominal complications out of our institution; the tissue was unavailable for molecular study. In another patient, the tissue specimen was inadequate for molecular study, so we ended up with 5 treated patients to be analyzed. The characteristics of the study and control groups are shown in Table I.
Summary of the cohort of patients who took part in the study
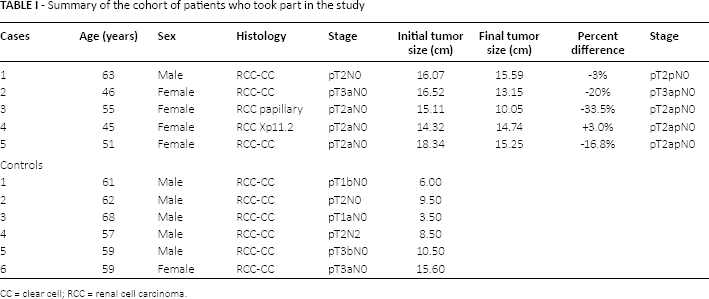
CC = clear cell; RCC = renal cell carcinoma.
Tissue samples of RCC obtained from open nephrectomy were immediately sent to the laboratory and frozen at −170°C in liquid nitrogen within 15 minutes of excision.
Microarray experiment
Frozen tissue samples were mechanically disrupted in liquid nitrogen and total RNA was extracted with the TRIzol reagent according to a pre-established protocol (Invitrogen Life Technologies). Ten micrograms of total RNA from each tissue sample was distributed between 3 pools. Double-stranded cDNA was synthesized from 10 μg of total RNA using the SuperScript Choice double-stranded cDNA synthesis kit from Invitrogen according to the manufacturer's protocol. The cDNA was purified by phenol-chloroform extraction and ethanol precipitation. Biotin-labeled cRNA was synthesized by an in vitro transcription reaction using the BioArray HighYield RNA transcript labeling kit (Enzo Diagnostics). cRNA was purified from the in vitro transcription reaction using an RNeasy Mini Kit (Qiagen). Biotin-labeled cRNA was generated from each sample following the manufacturer's protocol. cRNA was hybridized onto an Affymetrix Human Genome U133 Plus 2.0 platform containing 54,675 probes, and the washed and hybridized cRNA species were detected using Cy5-streptavidin (Amersham). Slides were scanned using a GenePix Personal 4100A microarray scanner (Axon Instruments) and analyzed with the Affymetrix console.
Statistical analysis of the microarray data
Statistical analysis of the microarray slides was performed using the publicly available R statistical environment (http://www.r-project.org). Normalization and background correction were performed using the LIMMA package (Linear Models for Microarray Analysis), a part of the Bioconductor microarray suite (www.bioconductor.org). The background noise was corrected using the normEXP algorithm, and the values were normalized by a cyclic LOESS smooth function with 100 interactions using an adjusting parameter of 1.0. The normalized data were organized locally, then using a Perl (www.perl.org) script; we determined the minimum variation (fold-change) threshold to be accepted as significant. Datasets for each histological group were compared in a pairwise fashion. For each comparison performed, the fold-change for a given spot was calculated. These values were determined as the mean and standard deviation (SD) values of expression. The variations of all genes were determined. A gene was accepted as differentially expressed if its expression variation was greater than the mean plus 1 SD or lower than the mean minus 1 SD. Finally, only genes accepted as showing a significant change in the comparison between treated and untreated patients were selected. This group of candidate genes was identified and organized locally. The gene lists were numerically sorted, and the top upregulated and downregulated genes were determined for the comparison. Functional classification of these genes was performed using the Gene Ontology Consortium 2000. The microarray data were deposited in the NCBI Gene Expression Omnibus under accession number GSE68629 (http://www.ncbi.nlm.nih.gov/geo).
Quantitative real-time PCR and gene expression
Based on the level of differential expression and their possible role in carcinogenesis, IGFBP1, CCL20, CRP, FGB, TFPI, SCN9A, CXCL6 and MMP9 were chosen to be validated by qRT-PCR. Total RNA was extracted using the TRIzol reagent as mentioned previously. The purity and concentration of the RNA were measured in a spectrophotometer (260/280 nM) (Nanodrop ND-1000, Thermo Fisher Scientific). The cDNA synthesis was performed from at least 5 μg of total RNA with the M-MLV reverse transcriptase and random primers (Invitrogen Life Technologies) in the following conditions: 65°C for 5 minutes, 37°C for 1 hour, 95°C for 5 minutes. The cDNA samples were diluted in 100 μL of nuclease-free water (Invitrogen Life Technologies). The expression of IGFBP1, CCL20, CRP, FGB, TFPI, SCN9A, CXCL6 and MMP9 was analyzed by qRT-PCR on an ABI 7500 platform using the TaqMan protocol (Applied Biosystems).
DNA extraction and bisulfite modification
The tissue genomic DNA was extracted using the QIAamp DNA mini kit (Qiagen). DNA purity was assessed by the OD260/280 ratio using a Nanodrop ND-1000 spectrophotometer. Bisulfite conversion was carried out using the Cells-to-CpG Bisulfite Conversion Kit (Applied Biosystems) with 500 ng of DNA per reaction according to the manufacturer's protocol.
Methylation-sensitive high-resolution melting point analysis
MS-HRM analysis was used to determine the methylation status along the CXCL6 and IGFBP1 promoters and was carried out using the ABI 7500 Fast Real-Time PCR system (Applied Biosystems) with the HRM Analysis software program v.3.0.1.
MeltDoctor™ HRM Master Mix (Applied Biosystems) was used according to the specified protocol, with 20 ng of bisulfite used to convert the DNA in each reaction. A Cells-to-CpG Methylated & Unmethylated cDNA Control Kit (Applied Biosystems) was used for the dilution of standard samples with varying methylation rates (0%, 10%, 25%, 50%, 75% and 100%).
Primer design was performed as described previously (20). The 124-bp amplicon of CXCL6 MS-HRM 1 with 6 CpG dinucleotides was amplified with sense primer 5′-GCGTGTTTTAGAGAAGTTAG-3′ and antisense primer 5′-AAACATTTTAACCCCGCCC-3′; CXCL6 MS-HRM 2 with a 191-bp amplicon and 3 CpG dinucleotides was amplified with sense primer 5′-ATCGCGGGGCGGGGTTAAAATG-3′ and antisense primer 5′-TACATTCATCCCTCCCGACTA-3′. For IGFBP1, an amplicon of 180 bp with 16 CpG dinucleotides was amplified using the sense primer 5′-TTGTGTTTAGCGAGTATCGG-3′ and antisense primer 5′-CTCCAAACGCGAACAACAAAC-3′.
A standard curve with known methylation ratios was included in each assay. All reactions were run in triplicate.
Results
Two of the 7 treated patients developed moderate to severe hypertension, which was well controlled. There was 1 death, which we attribute to the drug. The patient had massive lymphadenomegaly and might have had an abdominal complication. The toxicity was restricted to mild fatigue and nausea. One patient presented grade 2 hand-foot syndrome and 3 patients had grade 1, 2 and 3 high blood pressure. No abdominal pain or hematological complications occurred. Except for patient number 4, whose tumor histology was Xp11.2 translocation related, all others had a reduction of tumor size following treatment, with a mean of −12% (range −3% to −33.5%).
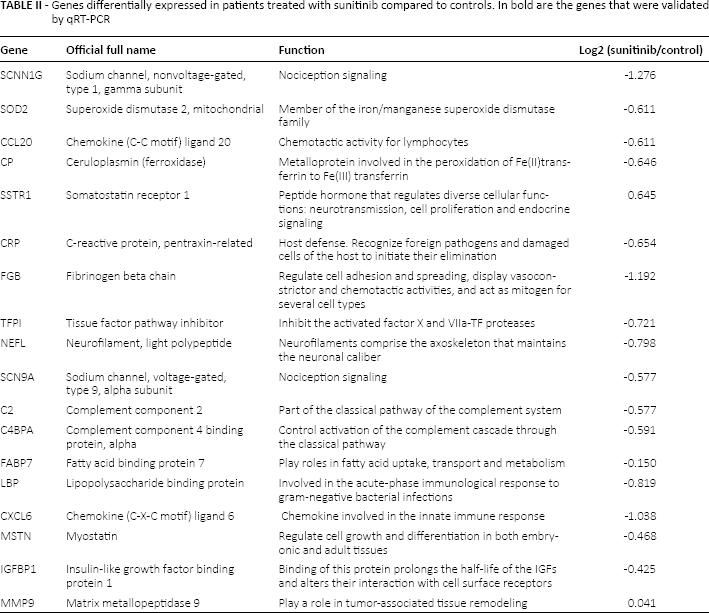
Microarray analysis showed that there was prevalent underexpression of genes in the group of patients treated with sunitinib compared with the controls. The genes that were significantly downexpressed are shown in Table II. The qRT-PCR study confirmed the lower expression of these genes, as indicated in Figure 1.
Genes differentially expressed in patients treated with sunitinib compared to controls. In bold are the genes that were validated by qRT-PCR
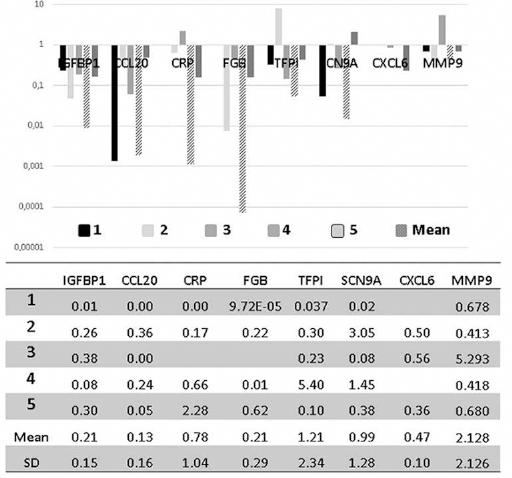
Validation by qRT-PCR of microarray results considering the expression of genes in patients treated with neoadjuvant sunitinib.
In order to verify the mechanism underlying the downregulation of these genes by the target treatment, we proceeded with a methylation study of CXCL6 and IGFBP1. IGFBP1 was methylated in 1 (case #5) of 2 cases (Fig. 2). CXCL6 was not methylated in any of the cases.
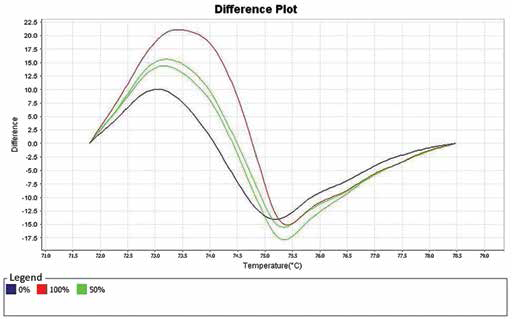
Melting curve generated by the MS-HSM assay showing methylation of the promoter of the IGFBP1 gene in case number 5 (green lines), with controls representing 0% and 100% of gene methylation (blue and red lines, respectively).
Discussion
Angiogenesis is the ultimate target of a new class of TKIs as well as some monoclonal antibodies directed against the extracellular binding domain of these receptors. Angiogenesis involves a series of processes mostly affecting the endothelial cells and pericytes. These cells lead this pathological process through the initial basement membrane degradation by proteases followed by the formation of vessel sprouts leading to loops, which will further support the migration of endothelial cells, creating a chaotic network of new vessels and newly formed basement membrane supported by the growth factors secreted by these same endothelial cells. This is part of what is known as the “angiogenic switch” (21). Upregulation of cadherin-11 at the protein level was detected in patients with RCC after exposure to 50 mg/day of sunitinib.
In vitro studies and xenograft tumor models have identified molecular markers of sunitinib activity using mRNA, which were sometimes well correlated with protein level changes that could be measured in clinical practice. For instance, Morimoto et al (22) found a correlation between gene overexpression and an increased level of the cadherin-11 protein in animal models as well as in biopsies from archived solid tumors of patients previously treated with sunitinib. Other authors have performed studies to provide reliable clinical biomarkers of antiangiogenic activity in different cancers against which these medications are being used (23). Due to the difficulty of obtaining fresh frozen tissue for more detailed analyses, studies have mainly focused on the phosphorylation status of the different targets for TKIs including sunitinib in cell lines or animal models, or on measuring the levels of ligands such as VEGF as a soluble by-product of these angiogenic pathways in human sera (24).
The effects of these TKIs were also indirectly evaluated with regard to the antitumor effects by measuring microvessel density or vascular permeability (25, 26); ultimately, the antitumor effects were assessed by measuring tumor size before and after exposure to these drugs.
The present study aimed to explore the ultimate effects of sunitinib treatment on gene expression in human RCC. Sunitinib is an antiangiogenic and antiproliferative drug that is known to inhibit VEGFR1, VGEFR2, VEGFR3, PDGFR-beta, PDGFR-alpha, KIT, FLT3 (wild-type), RET and CSF1R (27). So far, there has been a lack of experiments looking at the changes in gene expression in human tumors treated with sunitinib or other antiangiogenic drugs. In our study we observed decreased expression of 8 different genes in patients exposed to sunitinib compared with controls; the genes were IGFBP1, CCL20, CRP, FGB, TGFPI, SCN9A, CXCL6 and MMP9.
IGFBP1 (insulin-like growth factor binding protein 1), the first gene most strongly repressed by sunitinib treatment, is a metabolically regulated gene whose protein appears to play an important role in glucose homeostasis. Its expression appears to be influenced by the subject's nutritional status, increasing during fasting, malnutrition and diabetes. Studies have shown that under hypoxia, IGFBP1 is overexpressed as part of an evolutionarily conserved mechanism. Its biological importance appears to be to maximize the binding of IGF to its receptor, increasing the effects of glucose on pathways essential for survival (28). Therefore, overexpression of IGFBP1 appears to be an adaptive response to hypoxia and nutrient restriction, promoting proliferation under these circumstances. In epigenetic studies with RCC cell lines, however, the IGFBP1 gene promoter appeared to be methylated, and showed overexpression when cells were treated with 5-aza-2 deoxycytidine, a demethylating drug (29). Interestingly, we found the same mechanism in vivo. There is evidence that the response rates could be influenced by the methylation status of VEGFR (30), but there are no published data about this alternative mechanism of action for this class of target drugs.
The second gene found to be downregulated in our study was CCL20. This gene is overexpressed in a variety of tumors (31). It is a chemokine primarily responsible for the directional migration or chemotaxis of lymphocytes to specific lymphoid tissues or to sites of infection or tissue damage. It is also implicated in other biological events including angiogenesis (32). CCL20 has been shown to be directly involved in tumor proliferation in models of colon cancer, glioma, liver, pancreatic and prostate cancer (33–36). With regard to RCC, Oldham et al (37) demonstrated an interesting role of the selective recruitment of T regulatory lymphocytes (Tregs) promoted by the CXCR6/CCL20 axis in the immunophenotyping of infiltrating T lymphocytes in nephrectomy specimens. Based on those findings, one could speculate that sunitinib may be able to help activate the immune system response against a tumor by reducing the immunosuppressive effects of Tregs in the tumor milieu. Tsaur et al (38) studied the chemokines in RCC and showed that CCR6 gene expression (the receptor for CCL20) appears to be positively correlated with tumor size and stage. A comparison between the clear cell and non-clear cell types suggested that tumors of a chromophobe type showed significantly downregulated expression of the CCR6, CCL20 and CXCL12 genes, in contrast to those with clear cell histology.
CXCL6, another gene suppressed in our cases, was previously found to promote tumor growth as an inducer of angiogenesis and by activating the AKT/mTOR signaling pathway (39). Verbeke et al (40) treated mice with melanoma with a monoclonal antibody against CXCL6 and induced tumor regression. CXCL6 and its receptor synergize with other endothelial cell-derived chemokines and promote angiogenesis in gastrointestinal tumors. The precise role of chemokines in neovascularization is still under debate. However, it appears that it is related to the function of molecules such as CCR6/CCL20 or CXCL6, which are chemoattractants for neutrophils loaded with proteases capable of degrading the extracellular matrix, and therefore help to prepare the field for the neovessels to sprout (41).
The last gene found to be suppressed in the present study was MMP9 (matrix metalloproteinase 9). This gene transcribes a protein that is part of a family of molecules involved in degrading the extracellular matrix in the normal physiological processes of tissue remodeling. Therefore, it is often studied in the metastasis and invasion of cancer cells. The roles of MMPs are well established. Our previous in vitro studies using northern blot analyses of total RNA isolated from endothelial cells grown in 3D collagen matrices showed that exogenous VEGF induced the expression of 5 known regulators of angiogenesis (KDR, alpha-2 integrin, VE-cadherin, MMP1 and MMP2) (42). For endothelial cells to be activated during tumor angiogenesis, the extracellular matrix needs to be digested by MMP1, MMP2 and MMP9 (43, 44). MMPs are secreted as inactive compounds that are activated when cleaved by extracellular proteases. MMP9 in particular is responsible for the degradation of type IV and type V collagens, and studies have shown that it triggers the angiogenic switch during carcinogenesis (45). Studies in gastric, prostate and ovarian carcinoma and RCC have shown decreased survival in patients with tumors harboring overexpression of MMP9 (46–48). Qiao et al (49) tested 76 specimens of RCC and compared them with normal renal tissue in terms of their expression of MMP9. The mean mRNA level of MMPs (including MMP9) was significantly higher in the tumor specimens. In a study conducted by Perez-Gracia et al (50), 174 cytokines were measured by ELISA in patients with metastatic RCC treated with sunitinib. In the entire group of patients, the baseline levels of TNF-alpha and MMP9 were significantly higher in nonresponders than responders. That study also showed that sunitinib significantly decreased the MMP9 levels in all patients, regardless of whether they had a good or bad response to sunitinib. Therefore, in that study, MMP9, SDF1 and BDNF all seemed to be cytokines specifically modulated by sunitinib (50). This study is in line with the reduced expression of MMP9 at the gene level in our study.
Although we have found methylation of the gene promoter region to be a mechanism that could explain the downregulation of gene expression, we should mention that tumor death as a result of the target drug action could also explain it. In addition, other epigenetic phenomena should be studied, such as the expression of microRNAs that have been recently reported as important in the pathogenesis, prognosis and response to therapy in RCC (51).
In conclusion, this is the first study to show the effects of sunitinib on gene expression in human tumor specimens, suggesting the involvement of new pathways that could be explored in the future for the development of new drugs. Although a limited number of cases were treated and analyzed, our results shed additional light on the mechanisms of action for this class of drugs, as schematically illustrated in Figure 3.
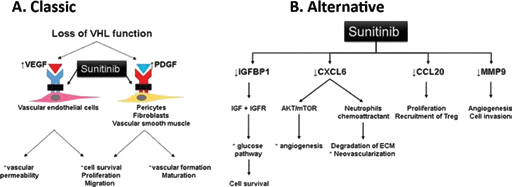
Sunitinib's mechanisms of action in renal cell carcinoma. Illustration of the classical pathway of genes inhibited by TKIs and an alternative pathway proposed by this study based on gene expression evaluation using a microarray platform.
Footnotes
Abbreviations
Financial support: This study was funded by FAPESP 12/50140-0. Conflict of interest: I, Katia Ramos Moreira Leite, on behalf of all authors declare that my coauthors and I have no conflict of interest related to this study.