
Abstract
Background
New molecular markers related to prognosis and/or clinical outcome have been extensively studied in breast cancer. In particular, microRNA (miRNA) has attracted the interest of both basic and clinical investigators as one of the promising molecular markers of breast cancer patients. MiRNAs are a class of short noncoding RNAs that regulate mRNAs at posttranscriptional level and are deregulated in various human malignancies. Previous studies have reported that miRNAs were stably conserved in 10% formalin-fixed paraffin-embedded tissues without significant degradation, in contrast to more fragile RNA.
Methods
Therefore, in this study, we examined 21 surgical breast cancer specimens using the Human Cancer microRNA PCR Array system (QIAGEN) to explore potential molecular targets of miRNAs.
Results
Profiling of miRNA expression in archival materials demonstrated that a group of deregulated miRNAs was associated with clinicopathological parameters of the patients, such as Ki-67, HER2, ER and PR. For instance, an abundant expression of multiple let-7 miRNA family, also known as tumor suppressor, was detected in low Ki-67 and HER2 groups. Elevated expression of 8 miRNAs overlapped between Ki-67+/HER2+/ER+/PR+ groups, including several known oncogenic miRNAs such as miR-148b, miR-15b, miR-200c, miR-150, miR-191, miR-96, miR-25 and miR-21.
Conclusions
These results all indicated that when analyzing miRNAs in surgical pathology specimens of breast cancer as a biomarker, they should be examined as a cluster through miRNA profiling, rather than relying on the analysis of a single miRNA.
Introduction
Gene expression analysis has become more readily available in routine clinical practice due to the development of a few pioneering diagnostic tools. One of the first DNA microarray profiling pioneers, Perou and colleagues, utilized microarray analysis to subclassify breast cancer into 5 different groups: luminal A, luminal B, human EGFR-related 2 (HER2) and basal-like, in addition to unclassified types (1). Their work has been cited repeatedly since, with numerous studies verifying a statistically significant correlation with immunohistochemical (IHC) findings in large numbers of the patients (Tab. I) (2, 3).
Comprehensive results for age, ERα LI, PR LI, HER2 and Ki-67 LI in 21 10% formalin-fixed and paraffin-embedded (FFPE) breast cancer tissues
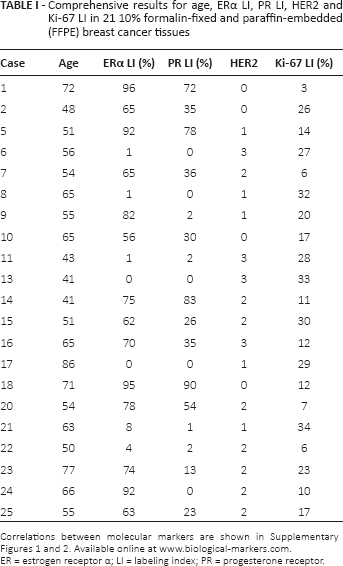
Correlations between molecular markers are shown in Supplementary Figures 1 and 2. Available online at www.biological-markers.com.
ER = estrogen receptor α; LI = labeling index; PR = progesterone receptor.
For clinical applications of DNA expression analysis, MammaPrint (Agenda, Amsterdam, Netherlands) and Oncotype DX (Generic Health, Red Wood City, CA, USA) are well-known commercialized tools in both the United States and Japan (4, 5). The 70-gene classifier, MammaPrint DNA profiling provides predictions of distant metastasis risk for early-stage breast cancer patients (4). Oncotype DX uses 21 genes to estimate risk of recurrence for early breast cancer patients. The accuracy of both DNA array-based disease outcome predictions has been validated across countries for node-negative or early-stage breast cancer patients (6–8). To conduct, employ, or proceed the array, MammaPrint requires fresh tissue samples, whereas Oncotype DX evaluates target genes with quantitative real-time polymerase chain reaction (qRT-PCR) in 10% formalin-fixed and paraffin-embedded (FFPE) tissue samples. Human tissue specimens are often frozen to avoid RNA degradation, but limitations of storage are considered to make this unsuitable for retrospective analysis. Thus FFPE is frequently used for storage of the tissue specimens, which enables us to perform relatively larger scale retrospective studies. However, highly degraded RNAs in FFPE specimens make it almost impossible to perform or interpret data from conventional retrospective DNA microarrays.
Accumulated evidence has indicated that correlations of microRNA (miRNA) between FFPE and fresh frozen samples exceeds those of total RNA (9, 10). MiRNAs are a class of noncoding small RNAs that were highly conserved across species. Nucleic primary miRNA transcript is processed by Drosha to shorter precursor miRNA, and exported to cytoplasm by Exportin. After cytoplasmic processing of precursor miRNA by Dicer, 20-25 nucleotide lengths of mature miRNA bind to complementary mRNAs for posttranscriptional regulation via degradation or inhibition of translation (11, 12). A number of publications in past decades have suggested diverse miRNAs as new molecular targets and explored their potential for clinical applications in oncogenic regulations. A variety of miRNAs have been proposed as new molecular targets in past decades. Our previous study identified miRNAs in association with breast cancer drug treatment, as well as miRNA expression changes under estrogen-deprived conditions using breast cancer cell lines and FFPE specimens (13). In this study, we collected a breast cancer we collected a breast cancer clinical database at Tohoku Kosai hospital clinical database at Tohoku Kosai hospital, to construct breast cancer miRNA expression profiles (miRNA profiles) based on Ki-67, HER2, estrogen receptor α (ER) and progesterone receptor (PR) status using miRNA microarrays. Based on miRNA profiles, we suggest a cluster of oncogene-related miRNAs to provide further insights into the biological and/or clinical profiles of breast cancer patients.
Materials and Methods
Preparation of breast cancer tissue samples
A total of 21 primary breast cancer specimens were retrieved from Japanese female patients who underwent surgical treatment from 2004 to 2010 at the Tohoku Kosai Hospital (Sendai, Japan) and were available for examination in this study. All of the cases were diagnosed as invasive ductal carcinoma, with age ranging from 41 to 86 years (median 58.6 years). Clinicopathological characteristics of the patients are summarized in Table I. Tissues were fixed in 10% formalin for 24-48 hours at room temperature and embedded in paraffin. The research protocol for this study was approved by the ethics committee of both the Tohoku University Graduate School of Medicine (2010-572) and Tohoku Kosai Hospital (H17.8.5).
Immunohistochemistry of molecular markers
A Histofine SAB PO kit (Nichirei Co Ltd., Tokyo, Japan) was used in combining each primary antibody. The following primary antibodies were used in this study: monoclonal antibodies for ER (ER1D5; Immunotech, Marseille, France), PR (MAB429; Chemicon International Inc., Temecula, CA, USA) and Ki-67 (MIB-1; DakoCytomation Co. Ltd., Kyoto, Japan), as well as rabbit polyclonal antibody for HER2/neu (AO485; DakoCytomation).
The Hercep test was performed to study HER2 status of breast carcinoma (0 to 3+) and classified as follows: negative for 0 and 1+, equivocal for 2+ and positive for 3+, according to the American Society of Clinical Oncology (ASCO) guidelines of 2013 (14). For ER, PR and Ki-67 immunoreactivity, at least 1,000 cells were counted to calculate the ratio of positive cells to determine the labeling Index (LI) (15).
RT2 miRNA PCR array
Human cancer microRNA PCR array: MAH-102A (RT2 miRNA PCR Array System; QIAGEN, Mannheim, Germany) was used to evaluate expression of 88 cancer-related miRNAs quantitatively in isolated breast carcinoma cells, as described in previous reports(13). This semicomprehensive miRNA array analysis included miRNAs of 4 internal control miRNAs, a reverse transcription control miRNA and a positive control miRNA, and has been validated by individual studies (16). To isolate carcinoma cells from 8-μm FFPE tissue sections, MMI CellCut (Molecular Machines and Industries, Glattbrug, Switzerland) was used to carry out laser capture microdissection. Approximately 5,000 carcinoma cells were obtained from individual tissue sections. These isolated carcinoma cells were deparaffinized at 60°C for 3 hours. Extraction of miRNA was performed as instructed using the Pure Link miRNA Isolation Kit (Invitrogen, Carlsbad, CA), and followed by cDNA synthesis using the RT2 miRNA First Strand Kit (QIAGEN). qRT-PCR was employed with the ABI7500 real-time PCR system (Applied Biosystems, Forster city, CA, USA) to determine expression levels of miRNAs.
RT2 Profiler PCR Array Data Analysis
The Web-based profiler RT2 Profiler PCR Array Data Analysis (QIAGEN) was used to complete the hierarchical clustering analysis and scatterplot analysis for miRNA expression and its relationship with established molecular markers. (http://pcrdataanalysis.sabiosciences.com/pcr/arrayanalysis.php). Ki-67 LI and HER2 status were analyzed by nonsupervised hierarchical clustering to visualize groups of coregulated miRNAs with U6 miRNA internal control normalization. For ER- and PR-associated miRNA expression, a scatterplot was formulated with normalization of global housekeeping miRNAs.
Statistical Analysis
JMP Pro 11 (SAS Institute Inc., Cary, NC, USA) was used to evaluate findings of clinicopathological features in the cases examined. The significance of each value was set as a p value less than 0.05. Associations between molecular markers such as Ki-67, HER2, ER and PR were determined by ANOVA. Fold differences and p values for miRNA expression changes in relation to ER and PR were calculated by RT2 Profiler PCR Array Data Analysis.
Results
Comparisons between Ki-67 and Endogenous up-/down-regulated miRNA Profiles
In this study, the Ki-67 LI results were categorized into 3 groups based on several cutoff values reported in previous studies (17–19): 0-14% as control, 15%-24% as intermediate (group 1) and >25% as high (group 2) for clustering analysis (Fig. 1 and Tab. II). There were 20 up-regulated miRNAs in the high Ki-67 group, derived from 3 subclustered groups (Fig. 1, sections A-C). Particularly, hsa-miR-191 in group A (4.062-up, p = 0.080) was identified as an oncomiR in hepatocellular and breast cancer (20, 21) (Fig. 1, section A). In group B (Fig. 1, section B), hsa-miR-7 resulted in the highest fold regulation (7.467-up) with the lowest p value (p = 0.051), in concordance with our previous report that miR-7 contributes to breast cancer malignancy via regulation of EGFR, among endocrine therapy resistant patients (13). In addition, up-regulation of hsa-miR-15b in group C (3.759-up, p = 0.020) was also consistent with previous reports in colon and hepatocellular carcinoma patients (22, 23). In contrast, there were 10 highly expressed miRNAs in the low Ki-67 group (Fig. 1, section D), including several tumor-suppressing miRNAs known from previous reports. For example, hsa-let-7a, hsa-let-7b and hsa-let-7e belong to a family of tumor-suppressing let-7 miRNA in various cancers (24, 25).
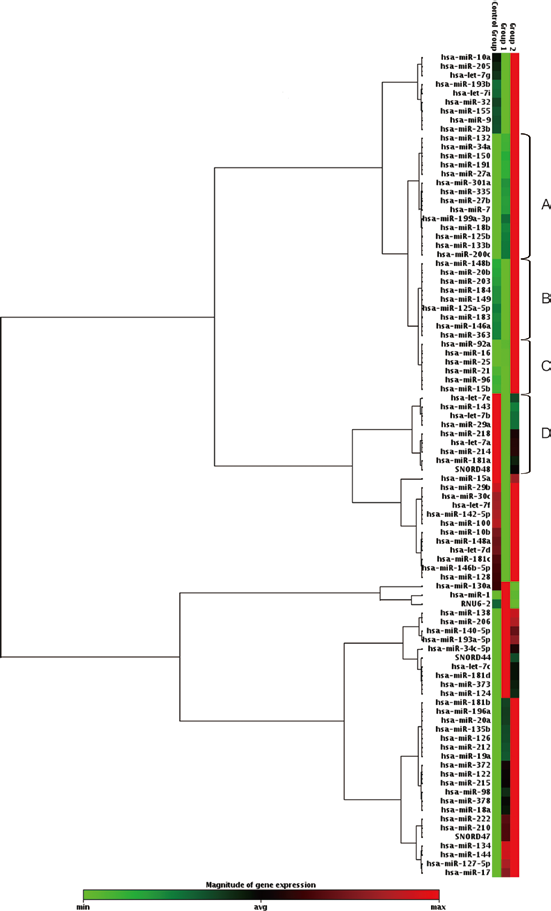
Cluster analysis of oncogene-related miRNAs for Ki-67 expression status. Control group = low Ki-67 group (0-14%); Group 1 = intermediate Ki-67 group (15%-24%); Group 2 = high Ki-67 group (>24%). Magnitude of miRNA expression is represented by the heat map: red indicates high expression, and green indicates low expression. Three subclusters (sections A-C) identified 20 up-regulated miRNAs in the high Ki-67 group (groups 1 and 2), as shown in Table II, and 10 up-regulated miRNAs in the low Ki-67 group (section D).
The list of up- or down-regulated miRNAs accroding to Ki-67 status (Fig. 1)
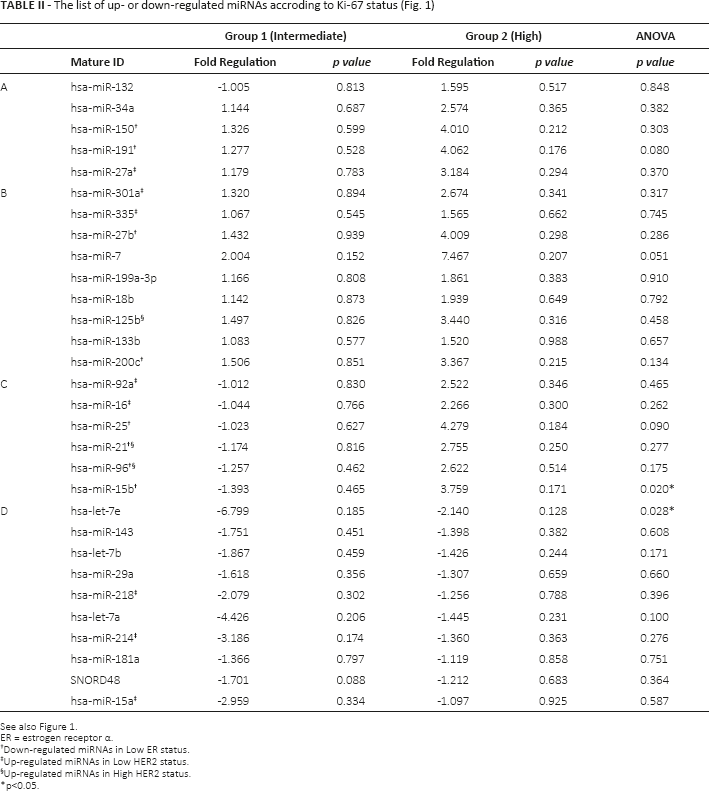
See also Figure 1.
ER = estrogen receptor α.
Down-regulated miRNAs in Low ER status.
Up-regulated miRNAs in Low HER2 status.
Up-regulated miRNAs in High HER2 status.
p<0.05.
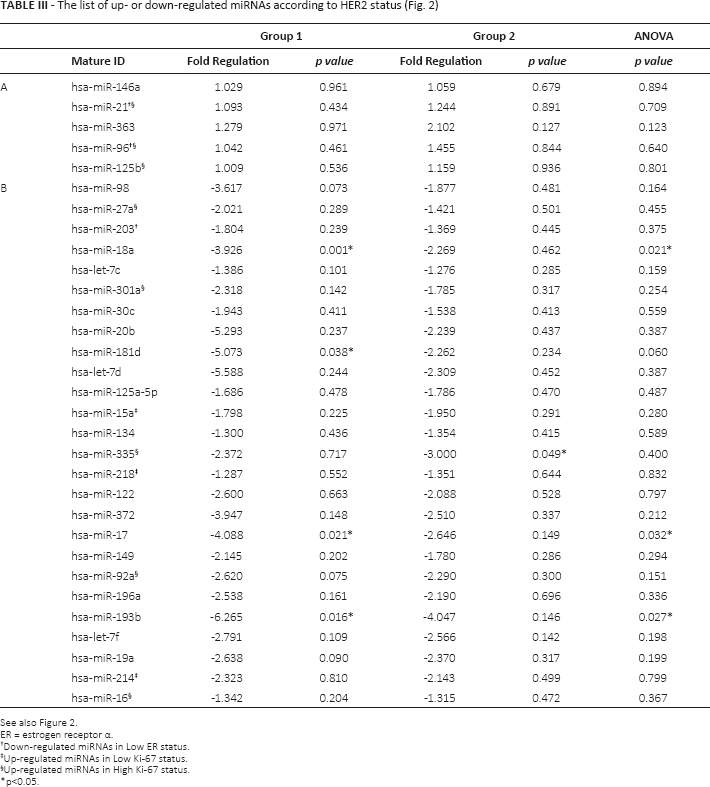
Comparisons between HER2 Status and Endogenous up-/down-regulated miRNA Profiles
Expression of HER2 was evaluated based on IHC results from 0 to 3+, and classified into 3 groups as described in “Materials and methods,” to employ cluster analysis. We identified 5 miRNAs (Fig. 2, section A and Tab. III) that were significantly up-regulated as HER2 expression increased. Of interest, hsa-miR-21, hsa-miR-96 and hsa-miR-125b were also overexpressed in the high Ki-67 group, which is consistent with the fact that hsa-miR-21 was enlisted above as oncogenic miRNA in breast cancer (26). On the other hand, 26 miRNAs were dysregulated in the low HER2 group, including hsa-let-7c, hsa-let-7d and hsa-let-7f (Fig. 2, section B). Among these reverse-correlated miRNAs, hsa-let-214 and hsa-miR-15a were also detected in the low Ki-67 group (Tab. II), and both miRNAs have been reported as tumor suppressors in breast cancer (27, 28). However, miRNAs positively correlated with Ki-67 status, such as hsa-miR-27a, hsa-miR-92a, hsa-miR-301a, hsa-miR-335a and hsa-miR-16 were also abundant in the low HER2 group, indicating that this group contained heterogeneous oncogene-related miRNAs.
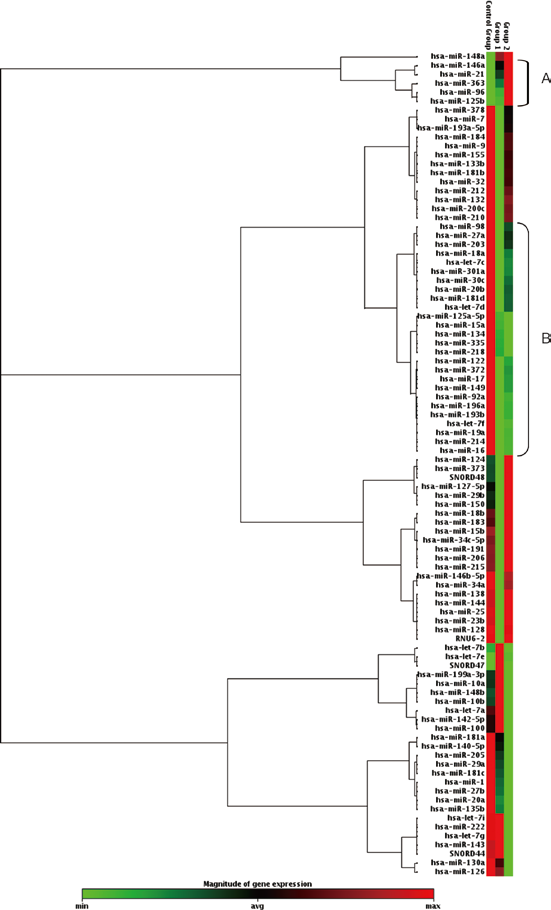
Cluster analysis of oncogene-related miRNAs for HER2 expression status. Control group: low HER2 group (immunohistochemistry [IHC] score 0, 1); Group 1: intermediate HER2 group (IHC score 2); Group 2: high HER2 group (IHC score 3). Magnitude of miRNA expression is represented by the heat map; red indicates high expression, and green indicates low expression. Section A: up-regulated miRNAs in the high HER2 group; section B: up-regulated miRNAs in the low HER2 group.
The list of up- or down-regulated miRNAs according to HER2 status (Fig. 2)
See also Figure 2.
ER = estrogen receptor α.
Down-regulated miRNAs in Low ER status.
Up-regulated miRNAs in Low Ki-67 status.
Up-regulated miRNAs in High Ki-67 status.
p<0.05.
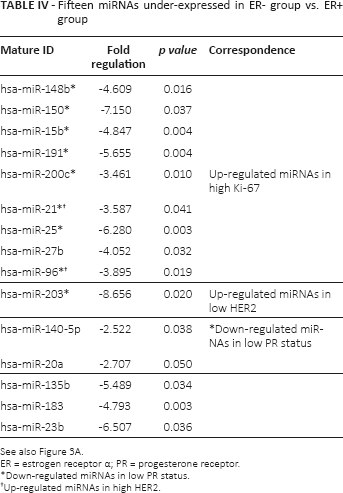
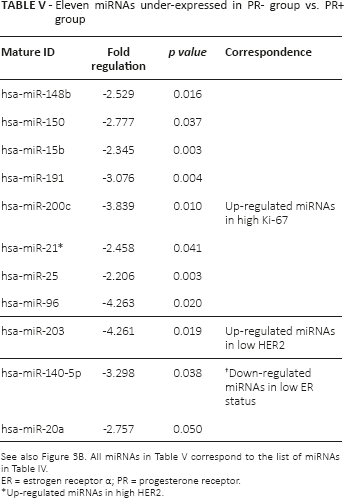
Identification of down-regulated miRNAs based on ER and PR Status
In this study, 4 cases were categorized as part of the ER- group (0-8%), whereas the rest of the 17 cases were ER+ (56%-96%). For PR status, 10 samples were PR- (0-13%), and 11 were PR+ (23%-90%). Normalization was performed using global housekeeping genes (SNORD44, SNORD47 and SNORD48). RNU6 was excluded since its expression was not necessarily consistent between the ER+ and ER- groups, as previously reported (29).
There were 15 down-regulated miRNAs significantly correlated with ER- status, while 11 miRNAs significantly underexpressed in cases of PR- status exhibited a similar trend to that of the ER- group, as shown in Figure 3 (Tabs. IV and V). Of those, 8 miRNAs were also detected in a group of up-regulated miRNAs in Ki-67 positive cases. Previous studies have indicated that hsa-miR-15b and hsa-miR-200c were dysregulated in ER+ breast cancer, using cell lines in vitro (30). Notably, hsa-miR-21 and hsa-miR-96 were identified to be positively correlated with Ki-67, HER2, ER and PR status.
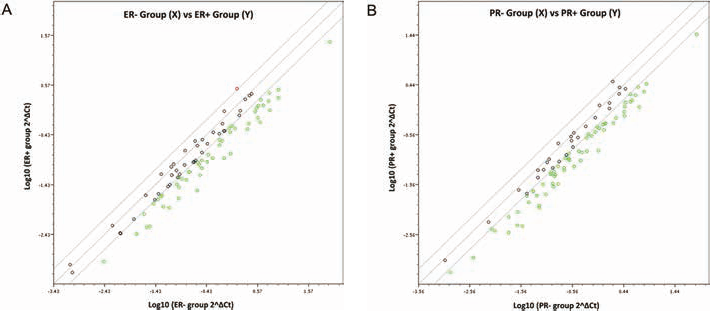
Scatterplot analysis of miRNA expression based on ER/PR expression in 21 human breast cancer patients. Normalization was performed with global housekeeping genes. Solid lines indicate a 2-fold increment or decrement of miRNA expression levels. A) Estrogen receptor α (ER) expression was categorized into ER- (0-8%, n = 4) and ER+ (56%-96%, n = 17) groups. B) Progesterone receptor (PR) expression was categorized into PR- (0-13%, n = 10) and ER+ (23%-90%, n = 11) groups.
Fifteen miRNAs under-expressed in ER- group vs. ER+ group
See also Figure 3A.
ER = estrogen receptor α; PR = progesterone receptor.
Down-regulated miRNAs in low PR status.
Up-regulated miRNAs in high HER2.
Eleven miRNAs under-expressed in PR- group vs. PR+ group
ER = estrogen receptor α; PR = progesterone receptor.
Up-regulated miRNAs in high HER2.
Discussion
Possible roles of miRNAs in human cancer development have emerged in the results of numerous studies. In fact, a phase II clinical trial using miRNA as a molecular target was completed in the United States (31). Yet, clinically relevant profiling of miRNAs is still demanded to proceed to therapeutic intervention. A number of array-based analyses have shown that miRNA expression in FFPE tissues is consistent with fresh frozen samples, whereas total RNA expression in FFPE tissues tends to be changed due to degradation and modification during the fixation process (9). In this study, miRNA expression of breast cancer related biomarkers was profiled from the same FFPE tissues that were evaluated for IHC of Ki-67, HER2, ER and PR. The number of the cases examined in our study was limited, but statistical analysis of pathological parameters among the breast cancer tissues was reasonably consistent with larger scale analyses in the past. Consequently, ER LI and PR LI were positively correlated (p = 0.0002; Suppl Fig. 1A), while both ER LI and PR LI were reverse-correlated with Ki-67 LI (p = 0.0005, p = 0.0088; Suppl Fig. 1B, C).
Hierarchical cluster analyses have demonstrated that expression patterns of the let-7 family (especially, hsa-let-7a-f) were negatively correlated with Ki-67 and HER2 in the cases examined. Other miRNA profiling analyses using breast cancer cell lines and tissues have also suggested that the let-7 family were significantly under-regulated comparing with normal mammary epithelial cells (32, 33). A family of let-7 miRNAs was one of the first miRNAs discovered during terminal differentiation of Caenorhabditis elegans in 2000 (34). In human, let-7 is well known to be involved in differentiation, development, cell cycle and gene regulation (32). In particular, let-7 expression was reported to be down-regulated in various cancers, and restoration of its expression was also reported to suppress carcinoma cell growth (35). We have previously reported that let-7f may repress an estrogen-synthesizing enzyme, aromatase, and let-7f and let-7d were down-regulated in Lin28-positive breast cancer (36, 37). These results were all consistent with earlier studies in which let-7 was suggested as a therapeutic target for suppressing cancer cell proliferation (35, 38, 39).
Among the 15 down-regulated miRNAs in the ER+ group, 9 miRNAs were abundantly expressed in the high Ki-67 group (Tab. III, group A). Of those, 5 miRNAs (hsa-miR-191, hsa-miR-15b, hsa-miR-200c, hsa-miR-21, hsa-miR-25) are known to be involved in ER activation in breast cancer (40–42). In particular, accumulated reports have shown that expression of miR-21 is markedly elevated in glioblastoma and lung and breast cancer, and promotes tumor progression by inhibiting apoptosis or regulation of epithelial-mesenchymal transition (43–46). Furthermore, miR-150 was suggested to have opposite roles depending on cell types. In gastric cancer, miR-150 inhibits proapoptotic factors and promotes cancer progression (47). Conversely, decreased expression of miR-150 was significantly associated with poor survival rate and worse response to adjuvant chemotherapy in colorectal cancer (48). These opposite effects toward carcinogenesis imply that miRNAs may be influenced by other regulatory factors according to cellular characteristics.
Our results indicated that miRNAs may be involved in the development of HER2 overexpression (Fig. 2). HER2 overexpression was reported to be correlated with effectiveness of chemotherapy (49, 50). For 2+ HER2 groups, the FISH test is commonly used for further evaluation to determine sensitivity to additional chemotherapy. Figure 2, section A, summarizes commonly up-regulated miRNAs in 2+ and 3+ HER2 groups, whereas Figure 2, section B, summarizes similar expression levels between negative and 2+ HER2 groups. Therefore, the analysis of several miRNAs could further subclassify the group of patients with 2+ HER2. Results of our study indicated that the possible evaluation of miRNAs in the same archival materials in which IHC was performed could contribute to further refining the interpretation of immunostaining results. The fact that this approach could identify the abnormalities in protein and miRNAs in the same groups of carcinoma cells is considered especially pivotal in light of recent controversies regarding intratumoral heterogeneity among breast cancer patients.
It is also true that detection of single miRNA expression may not necessarily provide clinically relevant information, as our study illustrated. This could be due to the fact that miRNA expression may be reflected in multiple factors, and detection of endogenous underexpressed miRNA can often be challenging. It is highly possible that improper expression of miRNAs could be identified if miRNAs were epigenetically modulated in heterogeneous cancer cells. Thus, observation of miRNA clusters rather than single miRNAs is desirable for the application of miRNA diagnosis to achieve accuracy in the results. Here, we provide evidence that a group of distinctive miRNAs in accordance combination with established molecular markers such as ER, PR, HER2 and Ki-67 could be a novel diagnosis tool for breast cancer. In our study, there were 8 miRNAs that were significantly associated with Ki-67, HER2, ER and PR status: namely, miR-148b, miR-15b, miR-200c, miR-150, miR-191, miR-96, miR-25 and miR-21 could be novel candidates as a group of deregulated miRNA markers that occur among hormone therapy-resistant patients. Evaluation of collective miRNA expression patterns can lead to the development of a more stable molecular biology based diagnostic tool (51). There are many reports of similar experiments, but the results were based on in vitro cell lines. In our study, we successfully extracted RNAs from tissue specimens and performed miRNA PCR array to compare the results with their steroid receptor status. This is the first study to show comprehensive miRNA expression patterns in relation to clinical markers such as ER, PR, HER2 and Ki-67. MiRNA studies of cancer have investigated various miRNA targets in past decades, and therefore, we believe that this comprehensive miRNA analysis could be useful to narrow down research to focus on more reliable markers in hormone-dependent cancers. In addition, the aim of our study was partly to suggest a new method of more detailed classification for each breast cancer phenotype by profiling groups of miRNA expression patterns. It is expected that introduction of an miRNA profiling method can contribute to early noninvasive detection of breast cancer risk as well as oncomiR-targeted therapy for patients with drug treatment resistance.
Footnotes
Acknowledgement
We would like to thank Mr. Katsuaki Ono, our lab technician, for generous advice regarding tissue sample preparation.
Financial support: This research was supported by a Grant-in-Aid for Challenging Exploratory Research, Japan Society for the Promotion of Science (JSPS) KAKENHI grant number 23659183.
Conflict of interest: The authors declare they have no conflicts of interest in this study.