
Abstract
Background
The aim of this study was to explore the mechanism of chemotherapy resistance and to screen biomarkers of pancreatic ductal adenocarcinoma (PDAC).
Methods
MicroRNA (miRNA) expression profile data for GSE38781 were downloaded from the Gene Expression Omnibus database. Differentially expressed miRNAs between short–overall survival (OS) and long-OS patients were screened with the limma package in R. The function and protein–protein interaction (PPI) network of the miRNA target genes were further investigated. Finally, multivariate statistical analysis was performed to verify the significant miRNAs obtained in our work.
Results
In total, 66 miRNAs were identified to be differentially expressed. Gene ontology (GO) and pathway enrichment analysis showed that 163 miRNA target genes were mainly enriched in heart function, cancer development and angiogenesis. Ten nodes, including TGFBR1, TGFBR2, ACVR1 and SHC1, were found to be hub nodes in the PPI network. Multivariate statistical analysis showed 8 of the most significant miRNAs could completely distinguish the 2 groups of samples. Seven target genes (i.e., RET, ETS1, RHOA, NUMB, TIAM, ITGA5 and YY1) of the 8 significant miRNAs were found to be associated with control of cell fate decisions, T-cell lymphoma invasion and angiogenesis enhancement.
Conclusions
The heart function–related pathway, cell cycle, immune system and angiogenesis may be dysregulated in patients with poorer prognosis. The significant nodes (e.g., TGFBR1, TGFBR2, ACVR1 and SHC1) in the PPI network may be potential biomarkers for predicting outcomes for patients with pancreatic cancer. The significant miRNAs and gene targets may be potential biomarkers or therapeutic targets for PDAC.
Keywords
Introduction
Pancreatic cancer is the fourth leading cause of cancer-related death in Western countries (1, 2). Pancreatic adenocarcinomas characterized by glandular architecture accounted for 95% of all pancreatic tumors in 2011 (3). Pancreatic adenocarcinoma can result in various symptoms, such as abdominal pain, significant weight loss, poor appetite and jaundice. Patients with pancreatic adenocarcinoma are commonly found to have a poor prognosis, which partly results from the absence of symptoms in its early stages. It is reported that the median survival time of pancreatic adenocarcinoma patients is less than 6 months, and 5% of patients have a dismal, 5-year survival (4, 5).
At present, the general treatments for pancreatic adenocarcinoma primarily include surgery, radiation and chemotherapy. Radiation and chemotherapy are used for patients not suitable for resection with curative intent, or as adjuvant treatment to increase the survival of patients with surgical resection (6). However, the prognosis of patients after complete resection is poor, with a 3-year disease-free survival rate of 27% and median overall survival (OS) of 15-19 months (7). Therefore, an increasing number of studies have attempted to make contributions to discovering novel biomarkers with good sensitivity for adjuvant therapy and prognosis prediction.
MicroRNAs (miRNAs) are a group of small noncoding RNA molecules, which possess functions related to transcription and posttranscriptional regulation of gene expression (8). The miRNAs are expressed differentially in normal and malignant tissues, and tumor-associated miRNAs are detectable in patient circulation (9). Investigations of miRNAs have provided additional insights for the exploration of new therapies and prognosis information for cancers. It is reported that microRNA-26b targeting ubiquitin-specific peptidase 9 (USP9X) can prevent hepatocellular carcinoma by inhibiting the epithelial-mesenchymal transition (10). MiRNA-15b has been found to be a potential biomarker for predicting the antitumor effect of rosemary in colorectal and pancreatic cancers (11). However, information regarding miRNAs in pancreatic adenocarcinoma is insufficient.
In the present study, we downloaded the miRNA expression profiling of patients with pancreatic ductal adenocarcinoma (PDAC) from the Gene Expression Omnibus (GEO) database. The differentially expressed miRNAs between patients with short OS and long OS were investigated. The purpose of this paper was to explore the relationship of tumor-associated miRNAs with chemotherapy sensitivity and prognosis.
Materials and Methods
Affymetrix Microarray data and Differentially Expressed miRNA Analysis
The miRNA expression profiling of GSE38781 was downloaded from the publicly available GEO database (12), which had been deposited by Giovannetti and his colleagues (7). Patients with PDAC who underwent radical surgical resection with curative intent (pancreaticoduodenectomy, total pancreatectomy and distal pancreatectomy) and who were treated with 3 cycles of standard gemcitabine adjuvant regimen were carefully selected. A total of 26 tumor tissues were collected from patients with PDAC, among which, 19 samples were unsuitable for miRNA analysis and were used for the microarray development. The 19 samples were divided into 2 groups including a short-OS group (from PDAC patients dying within 1 year of diagnosis) and long-OS group (from patients who had survived more than 30 months). The raw data were downloaded for further studies based on the platform of GPL14903 (3D-Gene Human miRNA V16_1.0.0).
After the raw data were preprocessed, the differentially expressed miRNAs between the short-OS and long-OS group were analyzed with the limma package in R (13). A multiple testing correction was performed using the Benjamini-Hochberg false discovery rate (HB FDR) (14). An FDR <0.05 and |log FC (fold change)| >1 were used as the threshold for identifying differentially expressed miRNAs.
Hierarchical Clustering Analysis
Hierarchical clustering has been widely applied in analyzing gene expression patterns (15, 16). With hierarchical clustering, the most similar expression patterns can be clustered in a hierarchy of nested subsets. The expression values of differentially expressed miRNAs were selected according to the probe information from the downloaded files. The hierarchical clustering analysis for differentially expressed miRNAs was performed with Cluster software (17), and the results were visualized on a heatmap with Treeview software (18).
MiRNA Target Gene Prediction and Function Enrichment Analysis
To analyze the role of miRNAs in biological mechanism in response to chemotherapy, a gene ontology (GO) function analysis was performed for target genes of the differentially expressed miRNAs. The target genes for differentially expressed miRNAs were collected based on the databases of miRecord (19), miRTarBase (20) and Tarbase 6.0 (21). GO and Kyoto Encyclopedia of Genes and Genomes (KEGG) pathway enrichment analysis for the miRNA target genes were performed using the Database for Annotation, Visualization and Integrated Discovery (DAVID) tool (22). A p value <0.05 was defined as the cutoff value.
Construction of Protein–Protein Interaction Network
To further analyze the function of miRNA target genes in PDAC patients, we performed a protein–protein interaction (PPI) network analysis. The miRNA target genes which were enriched in at least 1 pathway or GO term were input into the Human Protein Reference Database (HPRD; http://www.hprd.org/) (23), and the protein pairs involved with the target genes were obtained. The miRNA target genes and those normal genes that were interacting with at least 3 target genes were mapped into the PPI network using the Python program (24). The PPI network was visualized with the Cytoscape package (25).
Furthermore, to identify the significant nodes, topological characteristics of the PPI network were examined by a Cytoscape plug-in, including for node degree, average shortest path length (ASPL), clustering coefficient (CC) and centrality. The significant node genes were further analyzed based on the automatically selected weighting method with the GeneMANIA tool (26).
Multivariate Statistical Analysis
To verify the significance of the miRNAs identified in this paper, we performed logistic regression analysis for the differentially expressed miRNAs, using 2 multivariate statistical methods: logistic regression analysis and discriminant analysis.
Logistic regression analysis was performed on the miRNA expression values in 19 patients to identify the miRNAs that could effectively distinguish the samples from the 2 groups (short-OS vs. long-OS groups). Discriminant analysis, also known as “resolution,” is a multivariate statistical analysis to identify the type ascription according to various characteristic values of a study in certain conditions. Two kinds of multivariate statistical analysis were performed using SPSS 19.0 software with a threshold of p<0.05.
Results
Identification of Differentially Expressed miRNAs and Hierarchical Clustering Analysis
To find the differentially expressed miRNAs between the short-OS group and long-OS group, we obtained the publicly available microarray dataset GSE38781 from the GEO database. Total 66 miRNAs were identified to be differentially expressed between the short-OS and long-OS groups based on the cutoff value of FDR <0.05 and |log FC| >1.
After the expression values of the 66 differentially expressed miRNAs were preprocessed, hierarchical clustering of 63 miRNAs in 19 samples was performed. As shown in Figure 1, the samples from the short-OS group and long-OS group are clearly distinguished based on the expression profiling of the differentially expressed miRNAs. Meanwhile, the expression patterns of miRNAs are clustered into 2 subclusters. In subcluster 1, 33 miRNAs show high expression levels in the short-OS group and low expression levels in the long-OS group. A total of 30 miRNAs show low expression levels in the short-OS group and high expression levels in the long-OS group (subcluster 2).
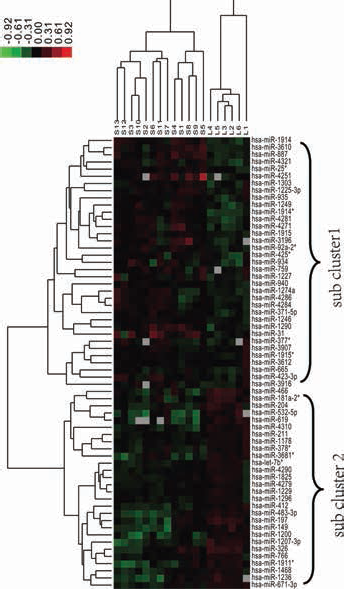
Hierarchical clustering heatmaps of the differentially expressed miRNAs. The gradient of colors from blue to orange represents expression values from low to high. *represents the miRNA expressed from the mature miRNA or the miRNA with relatively low-abundance.
Function Enrichment Analysis
After searching in the databases of miRecord, miRTarBase and Tarbase 6.0, we obtained 163 target genes for 11 differentially expressed miRNAs. GO enrichment and KEGG pathway analysis were performed for these genes with DAVID.
As shown in Table I, the significantly enriched pathways were mainly related to cancer processes and cardiac function, such as colorectal cancer, pancreatic cancer, arrhythmogenic right ventricular and hypertrophic cardiomyopathy. The most significant pathway was the hsa05210:colorectal cancer pathway (p = 2.47E-04). The overexpressed GO terms were relevant for regulation of transcription, regulation of RNA metabolic process, cell motion, cell migration and blood vessel development (Tab. I).
Function enrichment analysis of target genes for differentially expressed miRNAs
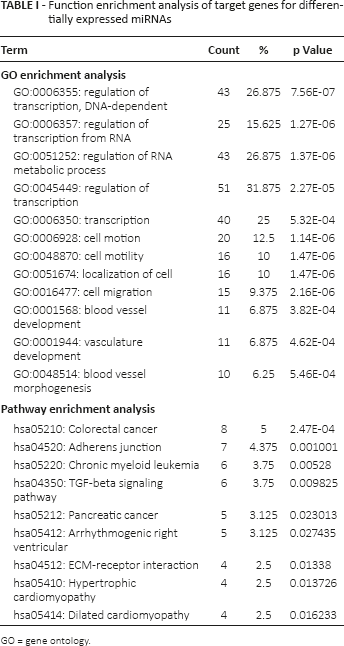
GO = gene ontology.
PPI Network of Target Genes
Based on the information from the HPRD database, we collected the protein pairs involved with the 163 miRNA target genes. A PPI network with 222 nodes and 562 edges was constructed using the Cytoscape software (Fig. 2). After further analyzing the topological characteristics of the PPI network, we obtained 10 hub nodes, including transforming growth factor, beta receptor 1 (TGFBR1), SMAD family member 4 (SMAD4), Src homology 2 domain containing transforming protein 1 (SHC1), activin A receptor type I (ACVR1) and transforming growth factor beta receptor II (TGFBR2). The topological characteristics for the 10 significant nodes are listed in Table II. Then the biological functions of the 10 genes were further analyzed with the GeneMANIA tool. According to the annotation information recorded in GeneMANIA, a PPI network involved with the 10 target genes and 20 normal human genes was established (Fig. 3). GeneMANIA functional annotation for the 10 hub genes showed that the 10 genes were mainly involved in the pathway-restricted SMAD protein phosphorylation, the transforming growth factor beta receptor signaling pathway and transforming growth factor beta binding (Tab. III).
Top 10 gene nodes with high node degrees in the network and the corresponding topology parameters
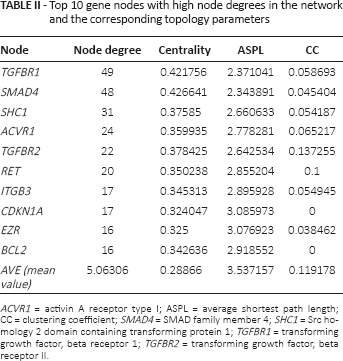
ACVR1 = activin A receptor type I; ASPL = average shortest path length; CC = clustering coefficient; SMAD4 = SMAD family member 4; SHC1 = Src homology 2 domain containing transforming protein 1; TGFBR1 = transforming growth factor, beta receptor 1; TGFBR2 = transforming growth factor, beta receptor II.
GeneMANIA functional annotation
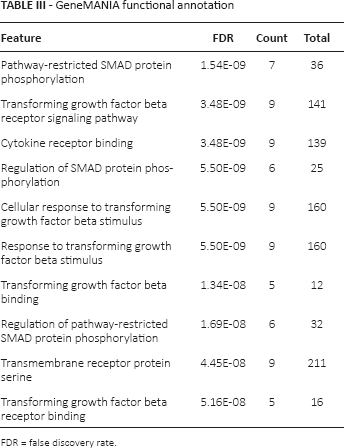
FDR = false discovery rate.
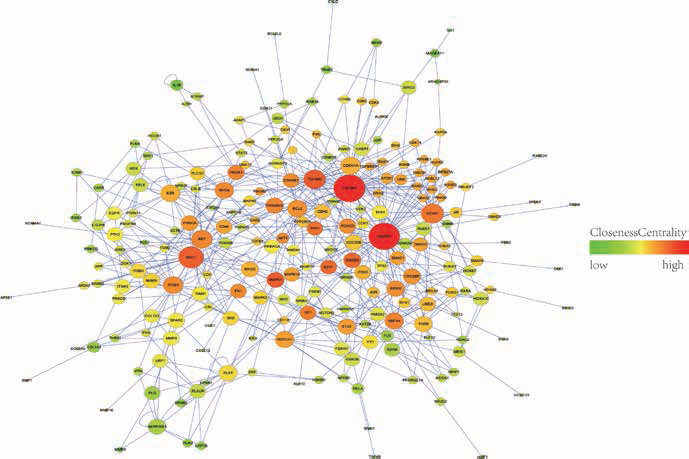
Protein–protein interaction (PPI) network for miRNA target genes and some normal interactional proteins. The size of the nodes represents the node degree in the network – the higher the degree, the bigger the node. The color of the nodes represent the centrality, the higher the centrality, the deeper the color (red) and the lower the centrality, the lighter the color (green).
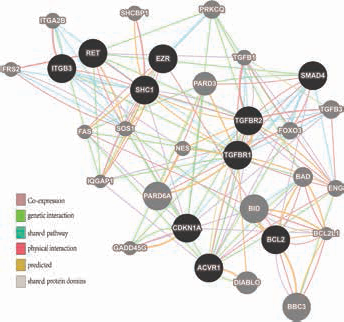
A network was constructed from GeneMANIA annotation information for 10 important genes, including physical interaction, genetic interaction, co-expression and shared pathways and protein structure domain. Black nodes represent 10 important genes, and gray nodes represent gene interactions with the black nodes. The network also contains 20 normal human proteins.
Multivariate Statistical Analysis
To verify the significance of the differentially expressed miRNAs through a statistical analysis, we used 2 kinds of multivariate statistical methods to analyze these miRNAs.
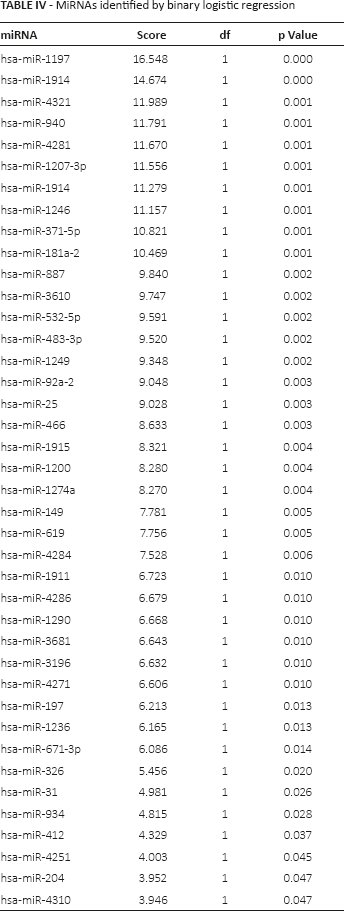
A binary logistic regression model (27) was applied to calculate the expression values of 66 significant miRNAs and the correlations of the 2 classified groups of patients. As shown in Table IV, 40 miRNAs were found to effectively distinguish the short-OS and long-OS patients in the binary logistic regression model (p<0.05). A discriminant analysis model (28) was also applied to analyze the significance of 66 miRNAs. Based on the expression values of the 66 miRNAs in 19 patients, 8 miRNAs (i.e., hsa-miR-1914, hsa-miR-4281, hsa-miR-1274a, hsa-miR-1249, hsa-miR-1207-3p, hsa-miR-466, hsa-miR-1290 and hsa-miR-31) were identified to be significant (p<0.05; Tab. V), which was consistent with the results of the binary logistic regression model. Discriminant analysis suggested that the 8 miRNAs could completely distinguish the short-OS and long-OS patients (accuracy 100%).
MiRNAs identified by binary logistic regression
MiRNAs identified by discriminant analysis
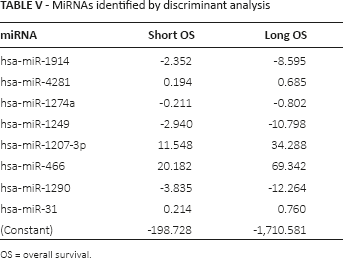
OS = overall survival.
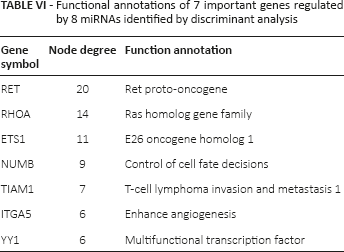
From the miRecord, miRTarBase and Tarbase 6.0, we obtained 26 target genes of the 8 significant miRNAs. Based on the information from the HPRD, 19 target genes were mapped into the PPI network, among which 7 target genes were found to have high node degrees and were mainly involved in control of cell fate decisions, E26 oncogene homolog 1 and enhancing angiogenesis (Tab. VI).
Functional annotations of 7 important genes regulated by 8 miRNAs identified by discriminant analysis
Discussion
As the mortality rate for pancreatic cancer patients is almost 0.99 (29), there is an urgent need for understanding the molecular mechanisms underlying this disease to develop better detection, diagnostic and prognostic markers as well as therapeutic targets that could improve clinical management and therapeutic outcomes for these patients. In this study, we downloaded the miRNA expression profiles from PDAC patients with similar clinicopathological characteristics and chemotherapy but different clinical outcomes (short-OS vs. long-OS groups). Poor prognosis had an association with chemotherapy resistance (30). The miRNAs that showed different expression levels between the short-OS and long-OS groups were selected. The relevant miRNA target genes were collected, and the functions for significant genes were further investigated. The purpose of this paper was to explore the chemotherapy sensitivity–related mechanism and the potential biomarkers for prognosis prediction.
Our results showed that 66 miRNAs were differentially expressed, and hierarchical cluster analysis for these miRNAs showed a good separation of the samples from the short-OS and long-OS groups. A total of 163 target genes for the differentially expressed miRNAs were collected. Pathway enrichment analysis for the 163 miRNA target genes revealed that the significant pathways were mainly involved with cancer development and heart function such as arrhythmogenic right ventricular, hypertrophic cardiomyopathy and dilated cardiomyopathy. As outlined in previous reports, the cardiovascular disease can lead to various pathophysiological changes which may affect pharmacokinetics such as drug absorption, distribution, metabolism and excretion (31). The cardiac dysfunctions may result in hypoperfusion to the drug clearance site, a decline in the volume of drug distributed and impairment of drug clearance (32). The limited distribution of anticancer drug in tumor tissue is related to the resistance of cancers to chemotherapy (33). In addition, compelling evidence shows that the arachidonic acid (AA) cascade, which is important in cardiovascular disease, is involved in the development of pancreatic adenocarcinomas (34). The treatment and prevention of cardiovascular disease with therapies such as β-blockers, inhibitors of AA-metabolizing enzymes and a low-fat diet for cardiovascular disease are also effective for PDAC. Although there is no direct association between heart disease and PDAC, heart functions may be related to drug resistance and may influence the survival of PDAC patients.
In addition, the target genes of differentially expressed miRNAs in PDAC patients were mapped into a PPI network. Ten genes were identified to be the hub nodes, including TGFBR1, TGFBR2, SMAD4, ACVR1 and SHC1. TGFBR1 and TGFBR2 encode transforming growth factor, beta receptor I and transforming growth factor, beta receptor II, respectively, which are members of the transforming growth factor beta (TGFB) receptor subfamily. TGFBR1 and TGFBR2 are TGF-beta receptors and play roles in transducing the TGF-beta signal. TGF-beta modulates many aspects of cellular function, and the disruption of the activity of TGFB super members (such as TGFBR1 and TGFBR2) contributes to a variety of diseases such as various cancers and pulmonary hypertension (35, 36). SMAD family member 4 (SMAD4), encoded by the SMAD4 gene, is a member of the Smad signal transduction protein family. Smad proteins are phosphorylated and activated by transmembrane serine-threonine receptor kinases in response to TGF-beta signaling (37). Previous evidence has implied that the mutation of the SMAD4 gene is correlated with the outcomes of patients with pancreatic cancer (38). SMAD4 inactivation has close associations with shorter OS in pancreatic cancer patients with resected surgeries (39). ACVR1 encodes the Activin A receptor type I, which is a signaling protein belonging to the TGF beta superfamily. Mutations of ACVR1 have been found in patients with pancreatic cancer (40). Src homology 2 domain containing transforming protein 1 (SHC1), encoded by SHC1, is reported to have functions in regulation of apoptosis and drug resistance in mammalian cells (41). Recent evidence shows that SHC1 regulated by mi-365 is associated with gemcitabine resistance in patients with pancreatic cancer (42). Therefore, the significant gene nodes in the PPI network may play key roles in the mechanism of chemotherapy resistance and may be potential genetic biomarkers for the prognosis of patients with pancreatic cancer. However, a large number of further studies are warranted.
In addition, by multivariate statistical methods, 8 of 66 differentially expressed miRNAs were found to be the most significant and could completely distinguish the samples from the 2 groups (short-OS and long-OS). Seven target genes of the 8 significant miRNAs were proven to have higher node degrees in the PPI network (i.e., RET, ETS1, RHOA, NUMB, TIAM, ITGA5 and YY1).
RET and ETS1 are important proto-oncogenes associated with tumorigenesis (43, 44). RHOA and NUMB are involved in the important process of cell cycle and regulate cell proliferation and apoptosis (45, 46). TIAM1 and ITGA5 regulate invasion and metastasis of immune cells and angiogenesis, which are closely associated with tumorigenesis, metastasis and chemotherapy resistance (47, 48). YY1 is a kind of multifunctional transcription factor controlling complex biological processes (49). The 7 important genes regulated by 8 miRNAs affect the biological processes of cell cycle, immune system and angiogenesis, and drug resistance of pancreatic cancer. So the 8 significant miRNAs (hsa-miR-1914, hsa-miR-4281, hsa-miR-1274a, hsa-miR-1249, hsa-miR-1207-3p, hsa-miR-466, hsa-miR-1290 and hsa-miR-31) may play key roles in regulating the resistance of patients with pancreatic cancer.
In conclusion, the differentially expressed miRNAs between PDAC patients with short-OS and long-OS affected their resistance by regulating their target genes. Heart function related pathway, cell cycle, immune system and angiogenesis may be dysregulated in patients with poorer prognosis. The significant nodes (such as TGFBR1, TGFBR2, ACVR1 and SHC1) in the PPI network may be potential markers for predicted the outcomes of patients with pancreatic cancer. Although some significant genes and miRNAs were found to be related to prognosis of pancreatic cancer, lack of the experimental evidence was a limitation of our work. Our findings may prompt further prospective studies and research into the predicted and therapeutic role of the significant genes and differentially expressed miRNAs. However, extensive further studies should be conducted to verify the findings of our work.
Footnotes
Financial support: No grants or funding have been received for this study.
Conflict of interest: All authors declare that they have no conflict of interest to state.