
Abstract
Background
Carbohydrate antigen (CA) 19-9 is used as a clinical tumor marker of pancreatic cancer; recent studies report that CA 19-9 is also associated with changes in blood glucose levels. The aim of the present study was to investigate the relationship between serum CA 19-9 levels and early-phase insulin secretion in nondiabetic individuals.
Methods
We enrolled 269 normoglycemic participants and 172 prediabetic participants who had undergone the 75-g oral glucose tolerance test during their annual health examination. Insulin secretion was estimated using the disposition index (DI) [(Δinsulin(0-30 min)/Δglucose(0-30 min) × (1/HOMA-IR)], which is an adjusted measure of relationship between β-cell sensitivity and insulin sensitivity.
Results
Serum CA 19-9 level was significantly higher in the prediabetic participants than in the normoglycemic participants. Simple linear regression analysis showed a negative correlation between CA 19-9 levels and DI for all participants and prediabetic participants (r = -0.126, p = 0.009, and r = -0.189, p = 0.002, respectively). However, in the normoglycemic participants, CA 19-9 levels did not correlate with DI. For all participants, and prediabetic subjects, multivariate linear regression analysis revealed that serum CA 19-9 levels were one of the independent predictors of DI (adjusted β = -0.098, p = 0.025, and adjusted β = -0.177, p = 0.004, respectively).
Conclusions
Serum CA 19-9 levels significantly correlate with early-phase insulin secretion in the prediabetic individuals. Our results indicate that CA 19-9 may be involved in the endocrine function of pancreas.
Introduction
Carbohydrate antigen (CA) 19-9 is one of the tumor markers most widely used in cancer diagnosis. Increased CA 19-9 level is known to be associated with pancreatic cancer, with a sensitivity from 70% to 90% and specificity from 68% to 91%; the levels of this antigen also increase in many malignant diseases such as upper gastrointestinal tract, ovarian, hepatocellular and colorectal cancers (1). Increased CA 19-9 level is also observed in benign conditions such as inflammation of the hepatobiliary system (2), thyroid disease, pancreatitis (3) and bronchiolitis (4).
Type 2 diabetes mellitus (T2DM) is also one of the benign conditions associated with elevated CA 19-9 levels. Gul et al compared 340 T2DM patients and 214 age-, sex-, and body mass index (BMI)–matched healthy controls and found that the median CA 19-9 level was significantly higher in the T2DM patients than in the controls (19.5 U/mL, range 0-214.8 U/mL; vs. 7.4 U/mL, range 0.4-47.0 U/mL; p<0.001) (5). In Japanese T2DM patients, serum CA 19-9 concentration was correlated with fasting plasma glucose (FPG) and HbAlc levels (r = 0.341, p<0.01, and r = 0.437, p<0.005, respectively) (6). Furthermore, in the prediabetic participants, CA 19-9 levels were higher compared with those in the normoglycemic participants, even after adjustment for age, sex and BMI (7). CA 19-9 is expressed in normal and malignant ductal cells of exocrine pancreas but not in endocrine islet cells (8). Nevertheless, a correlation between the exocrine and endocrine pancreatic functions has been demonstrated (9). Therefore, although CA 19-9 is mainly used in the diagnosis of pancreatic cancer, this antigen is also a biomarker of pancreatic tissue damage that may lead to the progression of β-cell dysfunction.
Impaired β-cell survival is a major contributor to the progression of T2DM, and a decrease in early-phase insulin secretion is evident before the onset of this disease. To the best of our knowledge, there are no previous studies associating serum CA 19-9 levels with early-phase insulin secretion. Disposition index (DI) is an adjusted measurement of β-cell function, taking into account variations in insulin sensitivity. The present study was undertaken to examine the correlation between serum CA 19-9 levels and DI in normoglycemic and prediabetic participants following a 75-g oral glucose tolerance test (OGTT).
Materials and Methods
Subjects
Between January 2005 and December 2012, 746 subjects with no known history of diabetes underwent a 75-g OGTT as part of a routine health examination at Iida Municipal Hospital. In the morning following a fasting period (>12 hours), a standard 75-g OGTT was conducted for each subject. Blood samples were collected at 0 minutes (FPG), 30 minutes and 2 hours (postchallenge plasma glucose [2h-PG]) after glucose administration.
Normoglycemic subjects were defined using the criteria of the American Diabetes Association published in 2013: FPG <100 mg/dL, 2h-PG <140 mg/dL and HbA1c <5.7% (10). Prediabetes was identified using the same criteria: FPG of 100-125 mg/dL, 2h-PG of 140-199 mg/dL or HbA1c at 5.7%-6.4%. Newly diagnosed diabetics (according to the following definition: HbA1c ≥6.5%, FPG ≥126 mg/dL or 2-h PG ≥200 mg/dL) were excluded from the study. Subjects who were taking antidiabetic agents were also excluded.
All patients underwent an upper gastrointestinal endoscopy and abdominal ultrasonic tomography to exclude those suffering from gastrointestinal malignant diseases. Informed consent was obtained from all participants.
Biochemical Measurements
Plasma glucose levels, serum total cholesterol (TC), triglycerides (TG), high-density lipoprotein cholesterol (HDL-C), low-density lipoprotein cholesterol (LDL-C), creatinine (Cr) and uric acid (UA) levels were determined using standard methods (Hitachi 47 automatic analyzer; Hitachi, Japan). Serum insulin levels were measured using a chemiluminescent enzyme immunoassay (Chemilumi Insulin; Kyowa Medics, Tokyo, Japan). Serum CA 19-9 levels were measured using a chemiluminescence assay (ARCHITECT; Abbott Japan Co., Matsudo, Japan).
Calculations
The homeostasis model assessment of insulin resistance (HOMA-IR) was computed as follows: (FPG × fasting insulin)/ 405, where FPG was in mg/dL and fasting insulin in μIU/mL. The homeostasis model assessment for β-cell function (HOMA-β) was calculated using the following formula: (360 × fasting insulin) / (FPG -63), where FPG was in mg/dL and fasting insulin in μIU/mL (11). The insulinogenic index (IGI), which determines the early insulin response during OGTT, was calculated as the ratio of the change in insulin levels to the change in glucose levels during 0 to 30-minute intervals (Δinsulin(0-30)/Δglucose(0-30)) (12). However, as the amount of insulin secreted by β-cells is strongly dependent on the prevailing degree of insulin sensitivity, DI, to account for variations in insulin sensitivity, was calculated as the ratio of IGI to HOMA-IR (IGI/HOMA-IR) (13).
Estimated glomerular filtration rates (eGFR) were calculated using the formula of the Japanese Society of Nephrology: 194 × serum Cr−1.094 × (age−0.287) mL/min per 1.73 m2, and further multiplied by 0.739 for female subjects (14).
Statistical Methods
Statistical analyses were performed using SPSS software version 21.0 (SPSS Inc., Chicago, IL, USA). Student's t-test or the Mann-Whitney U test was used to compare continuous variables for normoglycemic and prediabetic subjects. Normal distribution of variables was checked using the Kolmogorov-Smirnov test. Pearson's correlation coefficients were calculated to evaluate the relationships between DI and several clinical and metabolic variables (age, BMI, systolic/diastolic blood pressures, eGFR, UA, TC, TG, LDL-C, FPG, HbA1c and fasting insulin level). The distributions of TG, IGI, DI and CA 19-9 were skewed; therefore, we computed Pearson's linear correlation using the log-transformed values instead of the raw data. To assess independent relationships between DI and the clinical variables, a multiple linear regression analysis was performed. Data were expressed as means ± standard deviation. A p value <0.05 was considered statistically significant.
Results
Following the inclusion and exclusion criteria, 441 subjects (269 normoglycemic and 172 prediabetic subjects) were enrolled in the present study. The clinical and metabolic characteristics of both subgroups, normoglycemic and prediabetic, are summarized in Table I. In brief, the prediabetic subjects were significantly older and had higher BMI, blood pressure, UA and TG, but lower HDL-C and fasting insulin level, compared with the normoglycemic subjects. Regarding glycemic profiles, FPG and HbA1c levels were higher in the prediabetic subjects as had been expected. HOMA-IR was significantly higher, and indices of insulin secretion (IGI and DI) were lower in the prediabetic subjects than in the normoglycemic subjects. Moreover, serum CA 19-9 level was significantly higher in the prediabetic subjects.
Demographic and metabolic characteristics of study participants
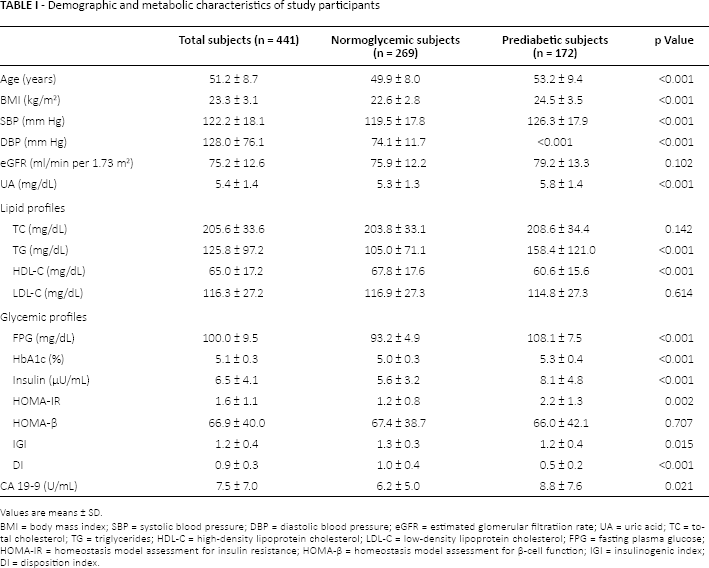
Values are means ± SD.
BMI = body mass index; SBP = systolic blood pressure; DBP = diastolic blood pressure; eGFR = estimated glomerular filtratiion rate; UA = uric acid; TC = total cholesterol; TG = triglycerides; HDL-C = high-density lipoprotein cholesterol; LDL-C = low-density lipoprotein cholesterol; FPG = fasting plasma glucose; HOMA-IR = homeostasis model assessment for insulin resistance; HOMA-β = homeostasis model assessment for β-cell function; IGI = insulinogenic index; DI = disposition index.
The results of simple linear regression analysis testing the correlation between the indices of insulin secretion and different covariates are reported in Table II. In all subjects and prediabetic subjects, the indices were significantly and negatively correlated with CA 19-9 levels. However, no significant correlations were found in the normoglycemic group (Tab. II).
Pearson correlation coefficients between the indices of insulin secretion and ca 19-9 and clinical variables
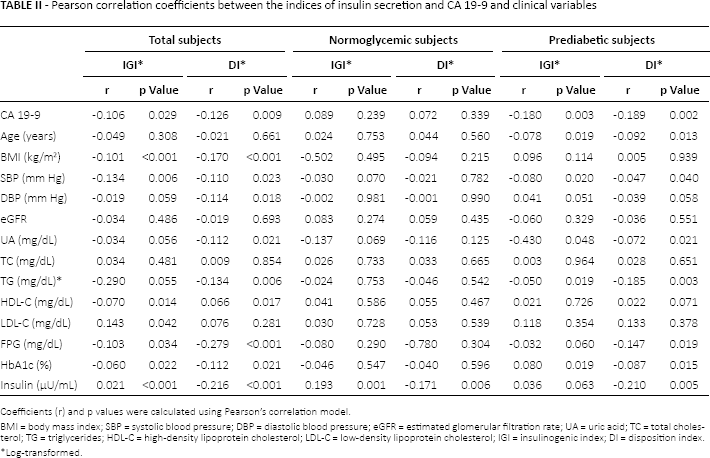
Coefficients (r) and p values were calculated using Pearson's correlation model.
BMI = body mass index; SBP = systolic blood pressure; DBP = diastolic blood pressure; eGFR = estimated glomerular filtration rate; UA = uric acid; TC = total cholesterol; TG = triglycerides; HDL-C = high-density lipoprotein cholesterol; LDL-C = low-density lipoprotein cholesterol; IGI = insulinogenic index; DI = disposition index.
Log-transformed.
A multiple linear regression model with stepwise selection was employed to determine the independent predictor of DI for all subjects and prediabetic subjects. In this model, variables that showed a p value <0.05 for simple linear correlation for all subjects or/and prediabetic subjects were used as explanatory variables. Although FPG and HbA1c levels significantly correlated with DI in the simple linear regression analysis for the prediabetic subjects, we included only FPG in the multivariate linear regression model, to avoid multicollinearity with HbA1c. When assessing all subjects, CA 19-9, FPG and TG were found to be independent predictors for DI. Moreover, in the prediabetic subjects, CA 19-9 and FPG were significantly negative explanatory variables for DI (Tab. III).
Multiple linear regression analyses conducted to assess independent relationships between di and clinical variables
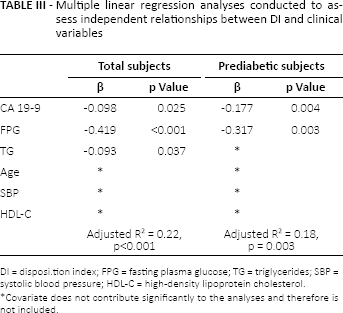
DI = disposi.tion index; FPG = fasting plasma glucose; TG = triglycerides; SBP = systolic blood pressure; HDL-C = high-density lipoprotein cholesterol.
Covariate does not contribute significantly to the analyses and therefore is not included.
Discussion
Type 1 diabetes (T1DM) is a chronic progressive autoimmune disease, which leads to pathological destruction of pancreatic β-cells. Yu et al have reported higher CA 19-9 levels in T1DM than in T2DM subjects; nevertheless, they have not found a significant difference between HbA1c levels in the 2 groups (15). Using multiple stepwise regression analysis, the authors have shown that T1DM is an independent contributor to CA 19-9. Their results suggest that an increased serum CA 19-9 level may well be a biomarker of damaged pancreatic β-cell function.
Pancreatic exocrine insufficiency is a phenomenon frequently observed in T2DM. Taking into account that the exocrine and endocrine pancreatic functions are closely related, the use of CA 19-9 in subjects with T2DM is controversial. Some small sample size studies have demonstrated that CA 19-9 levels are significantly higher in T2DM patients than in normoglycemic subjects (5, 16); however, others have not found significant associations (17). Uygur-Bayramicli et al showed a positive correlation between T2DM and CA 19-9 levels, independently of age, sex, FPG and HbA1c levels (16). On the other hand, Kim et al reported that the CA 19-9 level was positively correlated with FPG (r = 0.24) and HbA1c (r = 0.22) in T2DM patients (18). Gul et al also showed that a significant increase in CA 19-9 levels was maintained in T2DM patients in comparison with normoglycemic controls after adjustment for age, sex, BMI and smoking status (5). Recently, Yu et al evaluated the correlation between CA 19-9 levels and insulin secretion among 886 subjects with T2DM. They demonstrated that ΔCP120-0 (the difference between C-peptide levels at 120 minutes [CP120] and at 0 minutes [CP0]) during OGTT is strongly correlated with serum CA 19-9 levels (15). Moreover, according to CA 19-9 level quartile, the upper quartile had significantly higher FPG and HbA1c and lower CP0, CP120 and ΔCP120-0 compared with the lower quartile group.
In the present study and in accordance with previous studies, we found that CA 19-9 levels were positively correlated with HbA1c and FPG levels in the prediabetic participants. Furthermore, we found that early-phase insulin secretion was negatively correlated with serum CA 19-9 levels. Using multivariate analysis, we demonstrated that CA 19-9 and FPG were significant, explanatory variables for insulin secretion in the prediabetic group. In the normoglycemic subjects, there was no significant association between early-phase insulin secretion and CA 19-9 levels. These results suggest that serum CA 19-9 may be a biomarker of pancreatic β-cell function in prediabetic individuals.
The exact mechanism of the increase in serum CA 19-9 levels associated with decreased insulin secretion in prediabetic individuals remains unclear. One of the possible explanations is a paracrine effect of insulin on exocrine activity of the pancreas. After binding to its acinar receptors, insulin regulates many functions such as protein synthesis and the number of cholecystokinin receptors (19). Therefore, the rise in serum CA 19-9 levels may only reflect cellular dysfunction due to insulin deficiency. At the initial step of CA 19-9 biosyntheses, N-acetylglucosamine galactosyltransferase transfers galactose to N-acetylglucosamine. In an animal experiment, insulin may have been partly responsible for the natural regulation of intestinal galactosyltransferase activities (20). Therefore, another hypothesis for the increase in serum CA 19-9 levels in prediabetic individuals is that decreased insulin secretion affects the expression of galactosyltransferase, resulting in an increase in serum CA 19-9 levels.
Glucose intolerance can be a long-standing cause of pancreatic cancer (21), and T2DM onset may be an early manifestation of pancreatic β-cell damage caused by pancreatic cancer (22). In our study, all participants underwent an upper gastrointestinal endoscopy and ultrasonic tomography of the abdomen to exclude gastrointestinal malignant diseases such as pancreatic cancer. However, the study had some limitations. The primary limitation lay in the very nature of cross-sectional studies, which preclude conclusions regarding the association between CA 19-9 levels and the natural course of β-cell function over time. Another limitation was the possibility of selection bias. The 75-g OGTT was performed as part of a health checkup rather than for any specific research, and there were no predetermined criteria for undergoing this test. In addition, most subjects were from urban communities, and all subjects were Japanese. Therefore, a duplicate study with different populations should be undertaken to confirm our results.
In conclusion, an increase in serum CA 19-9 levels may reflect the extent of insulin secretion disorders among prediabetic individuals. Our study provides new insights into the pathophysiological association between CA 19-9 levels and insulin secretion.
Footnotes
Financial support: No grants or funding have been received for this study.
Conflict of interest: None of the authors has any financial interest related to this study to disclose.