
Abstract
Background
Methods
Results
Conclusions
Introduction
According to the 2007 World Health Organization Classification of Tumors of the Central Nervous System (1), the incidence of tumors of neuroepithelial tissue is the highest among neurologic tumors, and 50% of those are gliomas. At present, surgery accompanied with other adjuvant therapy is the major treatment for gliomas. However, malignant glioma especially glioblastoma multiforme (GBM) has a high degree of recurrence, and the median survival is less than 1 year. Most patients will die within 2 years after diagnosis (2, 3). With the rapid development of medical biology and technology in recent years, new treatment methods such as gene therapy have entered the clinical setting, and their therapeutic effects have been observed. These methods have been used to control tumor growth, reduce blood supply to the tumor, shrink the tumor volume and provide the opportunity for surgery, radiotherapy and chemotherapy (4). Adenovirus-mediated delivery of the conditional gene has been proposed as an adjuvant gene therapy approach for the treatment of gliomas (5).
Rat hyperplasia suppressor gene (rHSG), also named mitochondrial mitofusin-2 gene (Mfn2), was first verified with low expression in vascular smooth muscle cells (VSMCs) of spontaneously hypertensive rats. The overexpression of rHSG can inhibit the growth of neointima and remolding of vessel wall in balloon injury vascular (6). rHSG is located on human chromosome band 1 p36.3, where tumor mutations are frequently observed in cancer patients (7, 8). Therefore, in the preliminary study, we first considered the expression of rHSG in glioma cells and studied the correlation between its expression level and the growth of gliomas. We used the stereotaxic method to establish the glioma animal model by injecting C6 cells into rat caudate nucleus, and observed the change in growth of intracranial glioma at different time points. We found that the tumor size gradually increased, and the expression of rHSG and rHSG mRNA was significantly reduced correspondingly, which indicated down-regulation of rHSG might be associated with the occurrence and growth of rat malignant gliomas (9). However, whether rHSG contributes to the inhibition of C6 glioma cell proliferation remains unclear. Moreover, the potential of the rHSG gene as a therapeutic target in glioma cells is still only imperfectly understood.
In this study, a recombinant adenoviral system was produced by a double-recombination event between cotransformed adenoviral backbone plasmid vector, pAdxsi and a shuttle vector pShuttle-CMV-EGFP carrying the rHSG gene. We established the rat C6 glioma model injected with Adv-rHSG-GFP in vivo and cultured C6 cells infected with Adv-rHSG-GFP in vitro. The role of rHSG and its potential tumor suppression mechanism was investigated in the in vitro and in vivo studies.
Materials and Methods
Culture of Rat Glioma C6 Cells
The human embryonic kidney cell line HEK293 (Biosea Biotechnology, Beijing, China) and rat glioma C6 cells were cultured in Dulbecco's modified Eagle's medium (DMEM) supplemented with 10% fetal bovine serum (FBS; Hyclone, USA). All cells were maintained in an incubator at 37°C with a humidified atmosphere of 5% CO2.
Adenovirus Construction
DH5 containing plasmids of pGM-T-rHSG, pShuttle-CMV-EGFP and pAdxsi was recovered separately, and plasmids were extracted with an extraction kit (Biosea Biotechnology, Beijing, China). The forward and reverse primer contained EcoRV and Bg1II restriction sites, respectively, which facilitated the cloning of the gene to the transfer vector pShuttle-CMV-EGFP. The plasmid pShuttle-CMV-EGFP was linearized with EcoRV and Bg1II, and was afterward dephosphorylated with alkaline phosphatase (CIAP), which was then ligated to a rHSG gene segment by T4 DNA ligase. The linearized pShuttle-GFP-rHSG was transformed into the competent BJ5183 strain which was transformed with pAdxsi. The identification of recombinant adenoviral plasmid pAdxsi-GFP-rHSG was performed by polymerase chain reaction (PCR). pAdxsi-GFP-rHSG were linearized with PacI digestion and subsequently cotransformed into HEK293 cells with Lipofectamine 2000 (Life Technologies, USA). Adenoviral vectors were purified with 3 rounds of CsCl density gradients, and the viral titer was determined by optical density and standard plaque assay (10).
Application of Adenovirus Infection in C6 Cells
The cultured glioma C6 cells were divided into 3 groups and infected with the adenovirus: the uninfected group (control group), Adv-rHSG-GFP group and the Adv-GFP group. Subsequently, the infected cells were collected at 24 hours, 48 hours, 72 hours and 96 hours. To detect the best multiplicity of infection (MOI) for the adenovirus-mediated gene transfer, after adherence to the walls and synchronization for 24 hours with DMEM containing 0.2% FBS, the C6 cells were infected with Adv-rHSG-GFP and Adv-GFP at concentrations of 0, 10, 50, 80 and 100 MOI. The virus was absorbed after 24 hours of infection, and the medium was replaced with fresh growth medium of 10% FBS. Fluorescence microscopy was used to observe the green cells, which represented successful infection. Green fluorescence cells of over 90% indicated a relatively high infection efficiency of adenovirus. The flow cytometry method (FCM) was used to detect the percentage of GFP-positive cells for evaluation of virus infection efficiency.
Implantation of Adenovirus C6 Cells in Rats for Tumor Inoculation
Adult male Sprague Dawley rats age 8-12 weeks (approximately 250-350 g) were supplied by the Center for Experimental Animals at Ningxia Medical University, China (Certificate No. SCXK [Ning] 2009-0001). After being anesthetized by intraperitoneal injection of 10% chloral hydrate (400 mg/kg), the rats were fixed in a stereotactic instrument in the supine position, and a sagittal incision was made through the skin to expose the cranium. Approximately 1×10⁶ cells/10 μL were stereotaxically implanted into the right forebrain of each rat using the following coordinates: 1.0 mm anterior and 3.0 mm lateral to bregma, at a depth of 5.0 mm from the brain surface (11). A total of 108 glioma-bearing rats were equally divided into 3 groups and respectively injected with 20 μL of 0.9% sodium chloride (blank control group), 1×10⁸ plaque-forming units (pfu)/μL Adv-rHSG-GFP (Adv-rHSG-GFP group) and 1×10⁸ pfu/μL Adv-GFP (Adv-GFP group) on days 4 and 11 after tumor inoculation. The animals were sacrificed on days 9, 15 and 21 posttumor inoculation for brain tissue harvest and volume measurement. The total tumor volume was calculated according to the formula: Tumor volume=a2×b×π/6, where “a” is the minimum diameter of the tumor and “b” is the maximum diameter.
Total Protein Expression of rHSG, p21Cip1, p27Kip1 and proliferating Cell Nuclear Antigen Measured by Western Blot Analysis
The adenovirus-infected glioma C6 cells were harvested at 24 hours, 48 hours, 72 hours and 96 hours. The 3 groups of infected rat tumor tissues were collected and homogenized. The total protein of both the cells and tumor tissues was extracted and measured with purchased kits, and protein samples of 37.5 μg were denatured and separated by sodium dodecyl sulfate–polyacrylamide gel electrophoresis (SDS-PAGE), and transferred onto polyvinylidene fluoride (PVDF) membranes. After blocking nonspecific binding sites, the membranes were incubated overnight at 4°C with a primary antibody of 1:1,000 of β-actin, 1:400 of rHSG, 1:500 of p21Cip1 and p27Kip1 (Bioworld Technology, Nanjing, China), and 1:200 of proliferating cell nuclear antigen (PCNA; Boster, Wuhan, China). After incubating with a secondary antibody, immunoreactive bands were visualized by membrane-enhanced chemiluminescence and captured in an imaging analyzer (Image-Pro Plus 6.0). Mouse anti-rat β-actin PcAb, goat anti-mouse IgG antibody, goat anti-rabbit IgG antibody, immunohistochemistry (IHC) staining kit and 3,3’-diaminobenzidine (DAB) coloration solution were purchased from ZSGB-bio (Beijing, China).
Immunohistochemistry of rHSG
Glioma C6 cells were inoculated on a coverslip in a 24-well plate with medium at a proportion of 3×10⁴ cells/well, then cultured as cell slides, infected and harvested at 24 hours, 48 hours, 72 hours and 96 hours. The 3 groups of rat tumor tissues were collected, fixed and made into a paraffin block. Immunochemistry was performed with an IHC kit following the manufacturer's instructions (ZSGB-bio, Beijing, China). A ratio of 1:400 diluted mouse primary anti-rat of rHSG (Abcam, USA) was incubated at 4°C overnight. A secondary antibody was incubated for 20 minutes at 37°C. DAB was subsequently added for color development. The slides were viewed under ×400 magnification, and the cells were imaged (Olympus BH2-RFC microscope) and analyzed (Image-Pro Plus 6.0). The average optical density (IOD/area) was calculated as an evaluation indicator of positive signal strength (12). Cells with cytoplasm containing claybank or tanned colored cytoplasm indicated rHSG positive cells.
Reverse Transcriptase PCR
Total RNA from the 3 groups of rat tumor tissues was isolated with Trizol reagent, with the reaction conditions: 1 cycle at 48°C for 45 minutes; 1 cycle at 94°C for 2 minutes, followed by 35 cycles at 94°C for 30 seconds, 61°C at 45 seconds, and 72°C at 80 seconds; and 1 cycle at 72°C for 7 minutes. The primer for the β-actin standard was designed by Premier 5.0 Software, and the primer for the rHSG gene was adopted from previous research. The sequence of the upstream primer β-actin was 5’-CGTAAAGACCTCTATGCCAA-3’, and sequence of downstream primer was 5’-GCTCCAGTAACAGTCCGCCTA-3’. The PCR amplified product was 278 base pairs (bp) (13); the sequence of upstream primer rHSG was 5’-GGAGCTGGACAGCTCGATTGAT-3’, the sequence of downstream primer was 5’-AGCTCCAGCTGCTGCTTGTCCATGA-3’. The PCR amplified product was 609 bp. The products of the PCR reaction were separated by agarose gel electrophoresis and analyzed by Quantity One 4.4.0 (Bio-Rad, Richmond, CA, USA). The relative expression of rHSG was calculated.
Measurement of Cell Proliferation
At 24, 48, 72 and 96 hours, the glioma C6 cells were inoculated in a 96-well plate at a proportion of 3×10³ cells/well, then cultured and infected. After each time point of harvest, 3-(4,5-dimethylthiazol-2-yl)-2,5-diphenyl tetrazolium bromide (MTT) solution was added to individual wells, and the plate was incubated at 37°C for 4 hours until crystallization. The dark blue, crystal metabolized products of MTT were extracted with dimethyl sulfoxide (DMSO), and absorbance at 490 nm was measured using a microplate reader for the proportion of surviving cells.
Clone Formation Assay
At each time point, the 3 C6 cell groups were digested with 0.25% trypsin protease (HyClone, USA) to prepare for single-cell suspension; cell density was adjusted adequately. All cells were inoculated into 60-mm petri dishes at a proportion of 500 cells/dish. The cells were evenly distributed in the dishes before being placed in the incubator for 14 days at 37°C and in 5% CO2. The culture solution was then discarded, and the cells were fixed with methanol and stained with crystal violet. Sequentially, staining solution was flushed away with flowing water, and the dishes were dried at room temperature. The number of colonies was counted under a microscope at ×40 magnification, and clone formation efficiency was calculated by the formula: clone formation efficiency = (numbers of colonies/cell numbers inoculated)×100%.
FCM Analysis
The 3 groups of C6 cells were inoculated in a 60-mm petri dish at a proportion of 5×10⁵ cells/dish, then cultured and infected at the predetermined time points. After harvest, the cell groups were digested with 0.25% trypsin protease and collected, and a single-cell suspension was prepared. The cells were fixed with 70% ethanol (v/v) staying overnight, digested with RNA enzyme for 30 minutes at 37°C, filtrated with 400 meshes, stained with povidone-iodine for 30 minutes at 4°C and analyzed by flow cytometry (BD Biosciences).
Statistical Analysis
Data from independent experiments were expressed as the mean ± standard deviation (SD)) of 3 repeated experiments. Comparisons between groups were analyzed by 1-way ANOVA. A p value of less than 0.05 was considered to be statistically significant. Statistical analyses were performed using SPSS 19.0 for Windows.
Results
Construction and purification of recombinant adenovirus
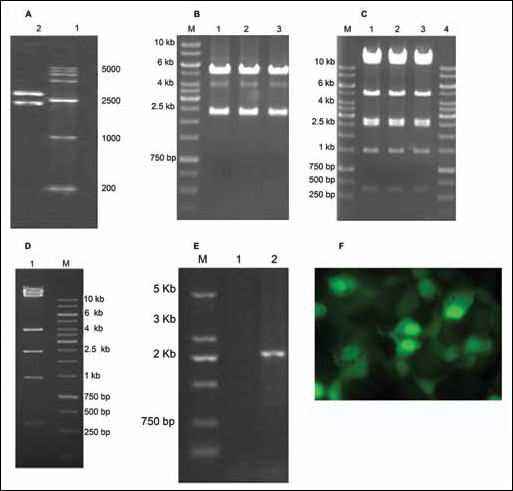
By restriction digestion of Bg1lI and EcoRV, the fragments of pGM-T-rHSG produced were rHSG target gene (2,309 bp) and pGM-T (3,002 bp), while pShuttle-GFP-rHSG yielded fragments of 2.3 kb (target gene) and 5.1 kb. The bands of products identified by 1% agarose gel electrophoresis were consistent as expected (Fig. 1A, B).
Construction of recombinant Adv-rHSG-GFP.
Digestion of XhoI, pAdxsi-GFP-rHSG yielded the following 7 fragments: 14 kb, 11.8 kb, 4.9 kb, 2.66 kb, 2.47 kb, 1.45 kb and 0.6 kb. The fragment of 2.66 kb was the target gene, whereas the pAdxsi digestion yielded the following 6 fragments: 14 kb, 11.8 kb, 4.0 kb, 2.47 kb, 1.45 kb and 0.6 kb. The bands of products identified by 1% agarose gel electrophoresis were consistent as expected (Fig. 1C, D).
The products of PCR were identified by 1% agarose gel electrophoresis, which showed the fragment was about 2,309 bp. An absence of fragment produced by pAdxsi demonstrated that pAdxsi-GFP-rHSG was constructed correctly (Fig. 1E).
Adenovirus carrying rHSG was produced in HEK293 cells, and the progress of the infection was observed by fluorescence microscopy (Fig. 1F). The titer of Adv-rHSG-GFP was approximately 1.0×10¹¹ pfu/mL.
Analysis of Infection Efficiency of Adenoviral Vector
Adv-rHSG-GFP and Adv-GFP were used to detect the capability of adenovirus vector on infecting C6 cells (Fig. 2A,B), and the infection efficiency was determined as the percentage positive GFP cells among all C6 cells. An MOI of 0, 10, 50, 80 and 100 corresponded to infection efficiency of Adv-rHSG-GFP at 0.1%±0.10%, 45.63%± 6.59%, 84.31%±1.88%, 90.08%±1.10% and 96.3%± 1.00%, respectively. The infection efficiency of Adv-GFP was 0.36%±0.13% at a MOI of 0, 44.04%±2.55% at a MOI of 10, 77.19%±3.86% at a MOI of 50, 80.94%± 2.48% at a MOI of 80, and 91.21%±0.40% at a MOI of 100 (Fig. 2C). The optimum infection efficiency appeared at the time point of 24 hours and MOI of 100 (Fig. 2D).
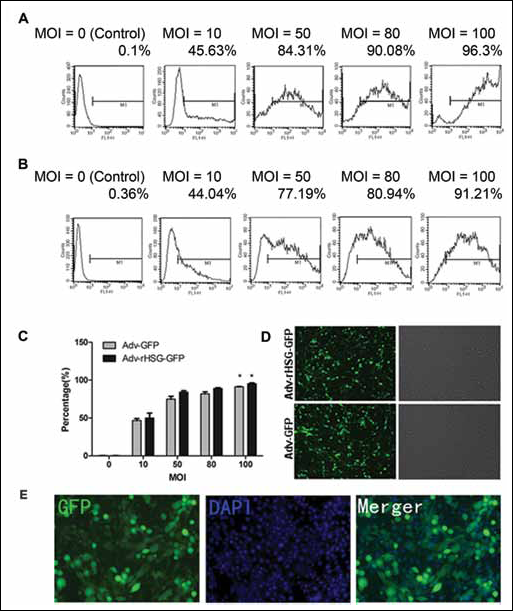
Infection efficiency assay of the adenoviral vector to C6 cells. C6 cells were infected with recombinant Adv-rHSG-GFP and Adv-GFP, the percentage of expressed GFP was analyzed via FCM. The percentage of infection efficiency increases rapidly along with multiplicity of infection (MOI).
Expression of rHSG in Vitro
Detection of rHSG protein by IHC showed that the rHSG protein located in the cytoplasm was stained with brown, in which, integral optical density in positive area (IOD/area) of the Adv-rHSG-GFP group was higher than that of the Adv-GFP and the uninfected groups (p<0.01, n=6). This demonstrated that the related protein can be highly expressed after infection with Adv-rHSG-GFP (Fig. 3A, B).
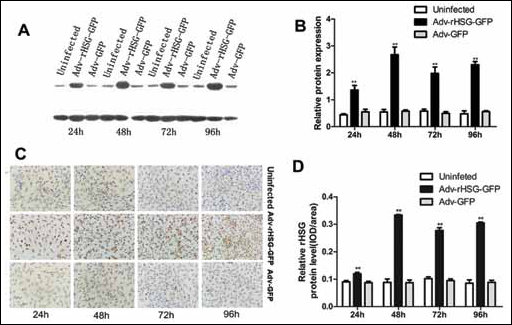
Detection of the expression level of rHSG in vitro.
Western blot analysis showed the rHSG specific band was involved in each time point of the respective groups, whereas the Adv-rHSG-GFP group was significantly enhanced compared with the Adv-GFP and the uninfected groups (p<0.01, n=3) (Fig. 3C, D) The maximum percentage of GFP-positive cells infected with Adv-rHSG-GFP (MOI=100) was then stained with DAPI (Fig. 2E).
Expression of rHSG in Vivo
Similar to in vitro testing, detection of rHSG protein by IHC showed the Adv-rHSG-GFP group to be higher than the Adv-GFP and blank control groups (p<0.01, n=6) (Fig. 4A, B). This demonstrated that the related protein can be highly expressed after injection with Adv-rHSG-GFP.
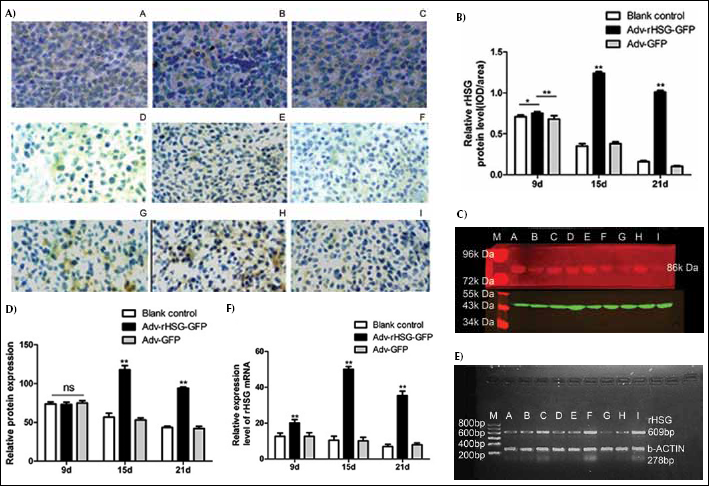
Detection of the expression level of rHSG in vivo.
Western blot analysis showed that the expression of rHSG at 15 days and 21 days of the Adv-rHSG-GFP group was significantly enhanced compared with the Adv-GFP group and a blank control group (p<0.01, n=3) (Fig. 4C, D). Moreover, relative expression of rHSG mRNA in glioma tissue of the Adv-rHSG-GFP group was significantly higher than that of the Adv-GFP and blank control groups (p<0.01, n=3) (Fig. 4E, F).
In Vitro Antitumor Efficacy of rHSG
MTT demonstrated that the number of C6 cells in the Adv-rHSG-GFP group was obviously reduced compared with the Adv-GFP and uninfected groups, which showed that cell proliferation was remarkably suppressed. However, no significant difference was observed between the Adv-GFP group and the uninfected group (p>0.05, n=3) (Fig. 5A, B).
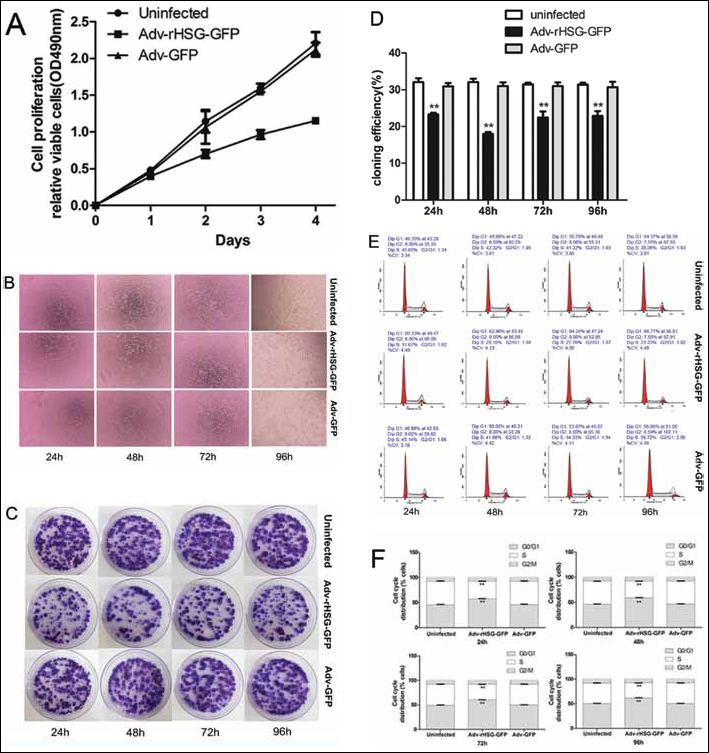
Overexpression of rHSG inhibits cell proliferation in C6 cells. Cells were infected with PBS control, Adv-rHSG-GFP and Adv-GFP for 24, 48, 72 and 96 hours, and then subjected to the following experiments.
Cell clone formation efficiency of Adv-rHSG-GFP at each time point was less than the Adv-GFP and uninfected groups (p<0.01, n=3), whereas no significant difference was observed between Adv-GFP and uninfected groups (p>0.05, n=3) (Fig. 5C, D).
FCM analysis for the effect on cell cycle showed that C6 cells of the Adv-rHSG-GFP group were obviously impacted. Compared with the other 2 groups, the proportion of C6 cells of the Adv-rHSG-GFP group in the G0/G1 phase was markedly increased with statistical significance (p<0.01, n=3), which indicated the cell cycle was arrested in the G0/G1 phase. In contrast, no significant difference was found in the Adv-GFP and uninfected groups (Fig. 5E, F).
In vivo Antitumor Efficacy of rHSG
On the ninth day after treatment, all rats in each group were in good condition, and there was no significant difference in tumor volume between groups. However, by the 15th day, rats of the blank control group and the Adv-GFP group had reduced ingestion and shaggy hair, and became unresponsive. Most of the rats in these 2 groups were congested in the conjunctiva, but rats of the Adv-rHSG-GFP group only had the symptom of appetite loss. By the 21st day, rats of the blank control group and the Adv-GFP group become hair-dried, emaciated, congested in bulbar conjunctiva, and curled up in a head down position. Most rats in these 2 groups had the symptoms of hemiplegia, inability to stand, and inability of intake, of which 5 died prematurely; ingestion and movement reduction of different degrees was confirmed in rats of the Adv-rHSG-GFP group, and only a few rats were confirmed with conjunctiva congestion, with no rats dead or confirmed with hemiplegia.
From the beginning to the ninth day of the experiment, the tumor of each group grew slowly, with no significant difference observed between groups (p>0.05, n=6). From the 15th day to the end, tumor growth rates of the blank control group and the Adv-GFP group were relatively higher. However, the tumor growth rate of the Adv-rHSG-GFP group significantly decreased from the 15th day, in which the tumor suppressing rate reached 45%, and there were statistically significant differences in comparing the Adv-rHSG-GFP group with the other groups (p<0.01) (Fig. 6A-B-C).
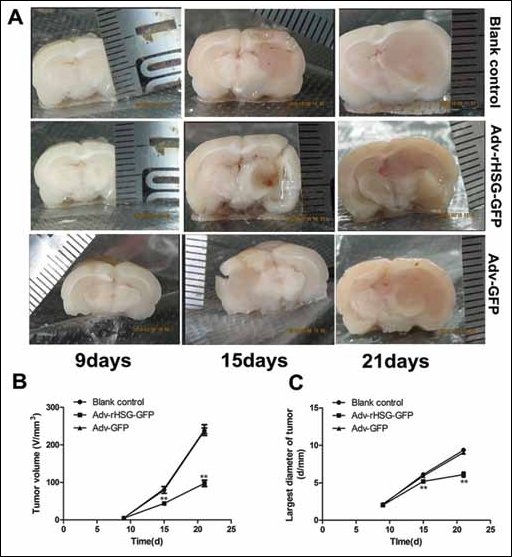
Overexpression of rHSG suppressed rat C6 glioma growth in vivo.
rHSG and its Intracellular Mechanisms
Western blot was used to explore the intracellular mechanism of antitumor efficacy in vitro by rHSG, which demonstrated that the expression of p27Kip1 and p21Cip1 increased while PCNA decreased (p<0.01, n=3) when overexpression of rHSG occurred at time points of 24, 48, 72 and 96 hours (Fig. 7A, B).
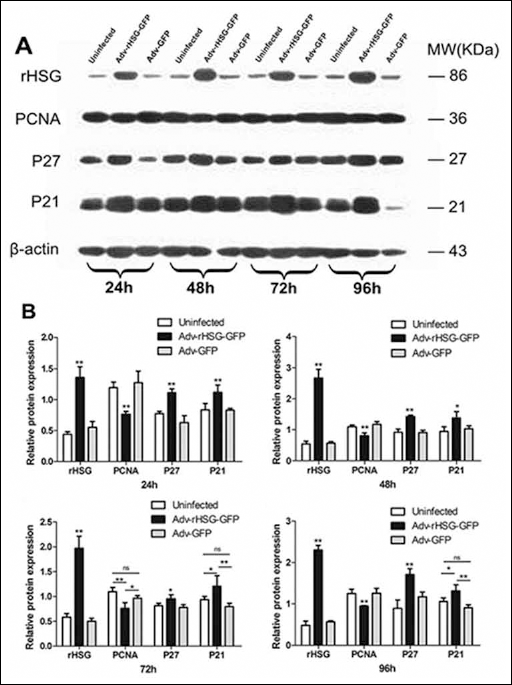
Protein expression of rHSG, PCNA, p27Kip1 and p21Cip1 after infection in C6 cells.
Discussion
The main aim of gene therapy is selection of vector to introduce the therapeutic gene into target cells safely and efficiently (14-15-16-17). Adenovirus has been widely used as vectors in gene therapy, especially in tumor treatment. Using adenovirus to carry genes which can inhibit glioma growth or induce glioma apoptosis has recently become a research topic of much interest, such as in carrying HSV-tk/GCV, p53 and ING4 (14-15-16-17). In this study, the pAdxsi system – a replication-defective adenovirus vector system – was applied, in which the foreign gene can be freely expressed and not integrated into host cells. Thus, there is no risk of insertion mutation which activates oncogene. In addition, the short-time effect of expression caused by nonintegration of adenovirus does not exceed 2-4 weeks (18).
In the present study, multiple injections were conducted to maintain an effective expression of target gene protein in animal models. Injection at the caudal vein was previously used to study the antitumor effect of the foreign gene with adenovirus used as a vector by Sauter et al (18) in 2000, but direct injection into the tumor could avoid poor targeting, reduce side effects in other nontarget organs and require a smaller injection volume (19). Moreover, the functions of pAdxsi are limited and have high affinity to receptors on the glioma cell surface, so as to avoid damage of surrounding brain tissues (20). Consequently, direct tumor injection of Adv-rHSG-GFP was used to introduce rHSG into tumor tissue in this study.
Currently, rHSG has been defined as a cell hyperplasia suppressor gene. Recent studies have shown that cell proliferation was markedly inhibited after infection with Adv-rHSG in some malignant tumor cell lines, such as lung cancer cell line A549 and colon cancer cell line (21, 22). However, similar studies on glioma tumors have not been reported. In the present study, the adenovirus vector Adv-rHSG-GFP was used to carry the target gene to infect rat C6 glioma tumor models and cells. In vivo and in vitro studies were performed to study the antitumor effect of rHSG. This study demonstrated that rHSG protein was expressed at a higher level in the Adv-rHSG-GFP group than in the uninfected and Adv-GFP groups. The high infection efficiency and stable expression of rHSG carried by adenovirus in tumor and cells formed the basis of the subsequent study. From in vivo and in vitro studies, rHSG was proven to inhibit the growth of tumor and proliferation of C6 cells. The DNA analysis of FCM showed that the overexpression of rHSG in C6 cells resulted in cell cycle arrest at the G0/G1 phase, which interrupted the cell cycle progress and inhibited the proliferation of C6 cells. These results demonstrated that rHSG might play a significant role against the growth of glioma.
Dysregulation of cell cycle is a hallmark of carcinogenesis. Recent studies have shown that several cell cycle regulation genes were altered in tumor cells. In addition, cell proliferation, differentiation, senescence and apoptosis are all cell cycle-independent in tumors with progressive destruction of cell cycle regulation mechanism (23, 24). Hence, research on the regulation mechanism of the tumor cell cycle has great significance in the understanding of tumor occurrence, clinical diagnosis and therapy. Cell cycle regulation-related genes p21 and p27 have obvious homology at the amino acid level and belong to cyclin-dependent kinase (CDK) inhibitors (CKI) capable of inhibiting the activity of the CDK-cell-cycle protein complex to arrest cell cycle at the G1 phase (25-26-27). Functionally, the reduction or the absence of p21 expression probably alters the rate of cell proliferation, and thus results in increasing chance of tumorigenesis (28). p27 negatively regulates the cell cycle by inhibiting cell division and proliferation, and thus facilitates cell differentiation and apoptosis (29). The expression of p27 is also related to tumor differentiation and tumor-node-metastasis (TNM) classification, and its expression level might affect the infiltration and apoptotic ability of tumor cells (30). Down-regulation or deletion of p27 is involved in almost all human tumors, and patients with p27-negative tumor were strongly correlated with poor clinical outcome and prognosis (31).
Proliferating cell nuclear antigen is the kernel component of the replication complex of eukaryotic organisms. It has been established that PCNA plays a role in cell cycle regulation by binding to cell cycle regulation–related proteins (32). For instance, PCNA binding to p21 and p27 can form the PCNA-p21 complex, which can form a tetramer with varieties of COK/cyclin. The tetramer inhibits CDK activity and thus affects Rb protein phosphorylation and releases transcription factor combined with Rb protein. Thereby, cells are unable to pass the G1 checkpoint and go into the S phase (33). Furthermore, PCNA is closely related to DNA synthesis and markedly affects the initiation of cell proliferation (34); it is also one of the reliable markers in the present tumor proliferation–related research (35). The current study showed that the C6 cell cycle was arrested in the G0/G1 phase and the expression of p27 and p21 increased, while PCNA decreased in the Adv-rHSG-GFP group. The significant inhibitory role of rHSG in cell proliferation and cell cycle regulation in glioma was further supported by this in vivo study.
Conclusions
rHSG can markedly inhibit of the growth of rat glioma cells. The suppression mechanism of rHSG was proven to be related to cell cycle regulation, which showed that rHSG is a potential therapeutic target of glioma tumor. This preclinical study supports further in-depth study on the effect of rHSG on cell proliferation, migration and the change of extracellular matrix component in glioma cells. Future research should also focus on the mechanism by which rHSG affects the Ras/Raf/Mek/Erk signaling pathway in glioma cells.