
Abstract
Keywords
Introduction
Nomograms are a standard computational method that integrates multiple clinical and pathological variables. They predict the likelihood of a phenotype, such as an outcome of treatment or disease status. Recently introduced biomarkers can potentially enhance the accuracy and specificity of nomograms. Nomograms function like biomarkers, but without any cost or invasiveness.
Nomograms use multivariate analysis algorithms. Multiple logistic regression (MLR) is usually used, and therefore there is no limitation in its application. Many nomograms have been developed for breast cancer diagnosis and treatment. Examples include the prediction of sensitivity to neoadjuvant chemotherapy (NAC) (1, 2), the metastasis of non-sentinel lymph nodes for patients with positive sentinel lymph node (SLN) metastasis (3-4-5-6-7) and the metastasis of SLNs (8).
Data mining or machine learning is an alternative technology to predict a continuous or binary outcome from multiple variables (9). Many studies have indicated such methods possess higher accuracy, even though relationships used in the model are more complex. Clinical information collected retrospectively often contains missing values, so such methods, which are more robust against missing values, are preferable. We have developed a new data mining methodology, using an alternative decision tree (ADTree) (10, 11) and ensemble technique (12, 13). It predicts axillary lymph node (AxLN) metastasis and the likely response to NAC in patients with primary breast cancer. The methodology is highly sensitive and robust against missing values (14, 15).
We have developed websites to use these tools. To facilitate the evaluation of the tools, the websites also function as a database, designed for versatile use. The nomogram and Web tools for data mining will facilitate the combined use of molecular and clinicopathological information, to assist decisions by oncologists.
Materials and Methods
Summary of Data Mining Model
The study protocol was approved by the institutional review board at Kyoto University Hospital. All patient data were anonymized and allocated numbers, according to Japanese ethical guidelines for epidemiologic research. The details of the AxLN prediction (AxLN model) and the pathological complete response (pCR) after NAC prediction (NAC model) were described previously (14, 15). Here, we summarize these models.
Patient Information for the AxLN Model
We collected 3 datasets for training, testing and validation. The prediction model was first developed using the training dataset, and parameters were optimized based on the test dataset. The model developed was then validated using the validation dataset. Consecutive patients who were treated at 2 institutions in Japan contributed to the training and test datasets. Patients with histologically confirmed primary invasive breast cancer who underwent SLN biopsy or AxLN dissection without prior treatment were eligible for this study. Only patients whose maximum tumor size was ≤4 cm were included. Two groups of 148 and 143 patients were identified from the Tokyo Metropolitan Cancer and Infectious Diseases Centre (Komagome Hospital) and Kyoto University Hospital, respectively.
The external validation dataset was collected from the Seoul National University Hospital, Republic of Korea. One hundred seventy-four patients who underwent SLN biopsies and met the same eligibility criteria as those for the training dataset were identified. All data were collected after establishing the SLN biopsy methodology.
Patient Information for the NAC Model
Patients who had participated in the Organisation for Oncology and Translational Research (OOTR) N003 trial (UMIN ID: C000000322, http://www.umin.ac.jp/ctr/index.htm), and patients who received the same chemotherapy regimen in clinical practice were included. Patients with a tumor size of ≤5 cm and who had completed 75% of the planned courses of NAC were included. Patients’ information (n=58) was consecutively collected from the Tokyo Metropolitan Cancer and Infectious Diseases Centre of Komagome Hospital. Remaining patient information (n=92) was collected from the Osaka National Hospital and Tsukuba University Hospital. One hundred fifty patients were used for the training dataset, and of these, 89 participated in the OOTR N003 trial. Validation data (n=173) were collected from OOTR N003 trials at the Niigata Cancer Centre Hospital, National Kyushu Cancer Centre and the Aichi Cancer Centre.
All patients included in this study received the same treatment protocol, consisting of 4 courses of 5-fluorouracil + epirubicin + cyclophosphamide (FEC; 5-fluorouracil 500 mg/m2, epirubicin 100 mg/m2, cyclophosphamide 500 mg/m2, intravenous [i.v.], every 3 weeks) followed by 4 courses of docetaxel (75 mg/m2, i.v., every 3 weeks) with or without capecitabine (1,650 mg/m2 per day, oral administration, for 14 days every 3 weeks). As an out of NAC model, pCR was defined as the absence of residual invasive cancer cells in the breast and AxLNs (ypT0/is + ypN0).
Data Mining Methods
The development and validation of the data mining methods (14, 15) are summarized here. The ADTree method (16) is an analog development of the if-then type decision tree, and was used as a core calculation algorithm. To predict the accuracy and robustness against missing values, we also used an ensemble technique (12), using the mean of multiple ADTree models as a predicted outcome. Ensemble is a common technique used in data mining, to enhance the accuracy and robustness against missing values.
AxLN model Development and Validation
The AxLN model was developed in 3 steps. A new dataset was first generated, by randomly selecting individuals and allowing for redundant selection from training datasets. This process was controlled so that the new dataset consisted of an approximately equal ratio of negative and positive patients for AxLN. The ADTree-based model was then trained using the training dataset, and its prediction performance evaluated using the test dataset. The parameters of the model were optimized during evaluation, using the test dataset. The trained model was then further evaluated, using an independent validation dataset not used during the training process. The accuracy was evaluated from the best value of the area under the receiver operating characteristic curve (AUC).
NAC Model Development and Validation
The NAC model was developed in 2 steps. The model was first trained using training data, and parameters were optimized by a 10-fold cross validation (CV). In each CV, training data were randomly split into 90% and 10% patients. The former was used for training, and the latter was used for validation. This procedure was repeated 10 times, until all patients had been selected for validation data. The predicted values for each validation data were collected, and the AUC value was calculated. This CV was repeated 200 times, and the mean AUC was used for the prediction performance. The optimized model was then further evaluated using the independent validation dataset.
Implementation of the Web system
The Web service was developed using freely available open-source libraries. The structure and design of the Web systems was a very common one. Apache (ver. 2.2.3) was used for the main service. PHP (ver. 5.1.6) was used as the implementation language to generate the HTML file. For example, it was used to visualize the data entry form, register entered data into the database, and generate and parse input and output files of Weka software. MySQL (ver. 5.0.77) was used for the database. JRE (ver. 1.6.0) was used for performing Weka, because Weka was implemented in the Java language. Weka software (ver. 3.6.3; University of Waikato, Hamilton, New Zealand) was used as a calculation engine. These programs were run on a virtual private server, which could allocate a maximum memory of 1 GB. We tested the Web system using Internet Explorer (ver. 8 or later), Firefox, Google Chrome and Safari as clients. When the Web server received the request from the user's client, the server executed the trained model of Weka software. Predicted results were displayed on the browser on the user's client.
Results
The websites developed included 2 tools to predict pCR after NAC, and the probability of AxLN metastasis. The user interfaces for these tools are shown in Figures 1 and 2 (https://www.brca-pm.net/model/entrance.php). The keyword, “guest” can be used tentatively for both of the login account and password.
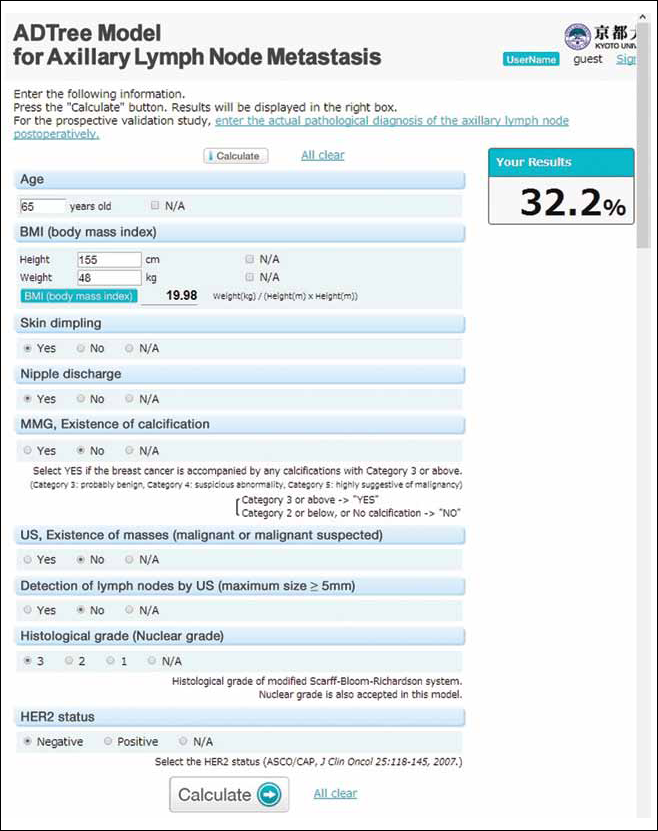
Website for the axillary lymph node (AxLN) model. A user inputs patient features on the left. Body mass index (BMI) is automatically calculated from the height and weight. Several input fields are automatically shown or hidden, depending on inputted selections. Pressing “calculate” gives a prediction of the probability of AxLN metastasis, which is displayed on the upper right. Random values are shown as an example. HER2 = human epidermal growth factor receptor 2; MMG = mammography; N/A = not available; US = ultrasound.
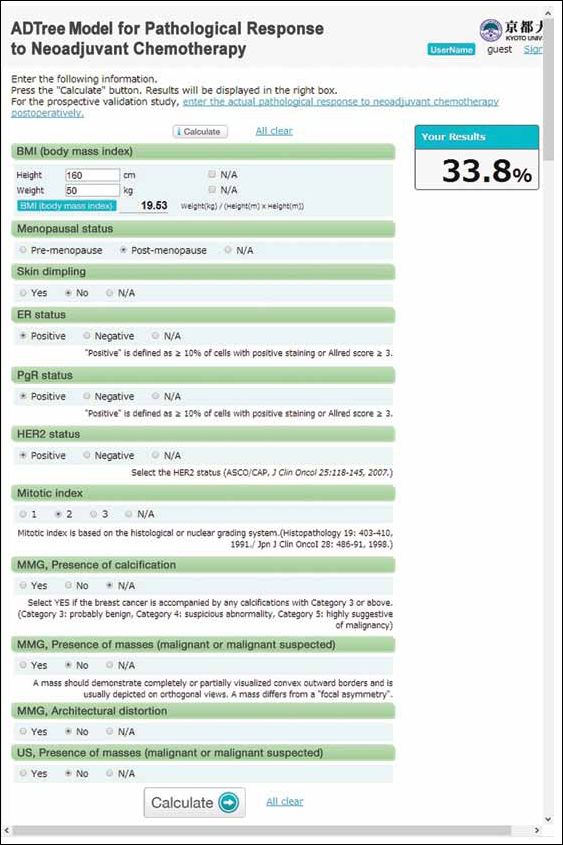
Website for the neoadjuvant chemotherapy (NAC) model. The operating instructions are the same as those in Figure 1. Random values are shown as an example. ADTree = alternative decision tree; ER = estrogen receptor; HER2 = human epidermal growth factor receptor 2; MMG = mammography; N/A = not available; PgR = progesterone receptor; US = ultrasound.
Website for the Prediction of AxLN Metastasis
The AxLN metastasis prediction model required the input of up to 18 variables, including age (no. 1), body mass index (BMI) (no. 2), 2 physical examination variables (skin dimpling [no. 3] and nipple discharge [no. 4]), 2 pathological variables (histological/nuclear grade [no. 5] and human epidermal growth factor receptor 2 [HER2] status [no. 6]), existence of calcification of mammography (MMG) (no. 7), existence of masses on ultrasound (US) (no. 8) and detection of lymph nodes by US (no. 9).
For variable no. 5, histological/nuclear grade, the histological grade of the modified Scarff-Bloom-Richardson system was used. The nuclear grade was also accepted in this model. HER2 status (no. 6) followed the rules detailed by Wolff et al (17).
The existence of calcification of MMG (no. 7) was defined as breast cancer calcification of category 3 or above. Here, category 3 is probably benign, category 4 is a suspicious abnormality and category 5 strongly suggests malignancy. When “existence” choices were selected for the MMG variable (no. 7), inputs for 2 mammographic variables (figure [no. 10] and distribution of calcification [no. 11]) were required. The figure variable (no. 10) included four choices: fine branching or casting, pleomorphic, amorphous or indistinct, or small round. Distribution variables (11) included 3 choices: linear or segmented, grouped or clustered, or regional or diffuse.
The existence of masses of US (no. 8) was defined by the perception of a malignant or suspected malignant tumor. When “existence” choices were selected for the variable masses on US (no. 8), inputs of 5 US variables (maximum tumor size [no. 12], tumor depth to width ratio [no. 13], multifocality [no. 14], echogenic halo [no. 15] and interruption of the anterior border of the mammary gland [no. 16]) were required.
The detection of lymph nodes by US (no. 9) was defined by the maximum size being ≥5 mm. The maximum size of lymph nodes (no. 17) and a loss of hilum in lymph nodes (no. 18) variables were required.
Website for the Prediction of pCR after NAC
The pCR after NAC prediction model required up to 16 variables, including 3 general variables (BMI [no. 1], menopausal status [no. 2] and the presence of skin dimpling [no. 3]), 4 pathological variables (the status of estrogen receptor [ER]; no. 4], progesterone receptor [PgR; no. 5] and HER2 [no. 6], and mitotic index [no. 7]), 3 MMG variables (the presence of calcifications [no. 8], the presence of a mass [no. 9], and architectural distortion [no. 10]), and the presence of mass on US (no. 11).
Here, a positive value for ER (no. 4) or PgR (no. 5) was defined as ≥10% of cells with positive staining, or an Allred score ≥3. HER2 status results were also given in an earlier report (17). Mitotic index (no. 7) was based on the histological or nuclear grading system (18, 19). The presence of calcification (no. 8) was defined by any calcifications of category 3 or above. Again, category 3 is probably benign, category 4 is a suspicious abnormality and category 5 strongly suggests malignancy.
When the positive choice was selected for the presence of a mass on US (no. 11), 5 US variables (maximum tumor size [no. 12], tumor depth to width ratio [no. 13], echogenic halo [no. 14], interruption of the anterior border of the mammary gland [no. 15] and posterior acoustic features [no. 16]) were also required as inputs. Echogenic halo (no. 14) was defined as no sharp demarcation between the mass and surrounding tissue bridged by an echogenic transition zone.
Common Features for Both Models
To facilitate user inputs, the minimum variables were displayed in the initial stage. For example, if the variable of existence of calcification of MMG had not yet been selected, or a negative choice was selected, the 2 MMG variables were hidden. When a positive choice was selected, these variables automatically appeared. Accommodating missing values by selecting “not available” (n/a) was possible for all variables. After inputs of the above-mentioned variables, the “calculate” button was pressed, and the Web server produced a prediction using the training model and Weka. The probability (%) of AxLN metastasis or pCR after NAC was displayed.
The websites facilitate the use of these tools, and serve as a database for accumulating new datasets. Most of the websites provide only the calculation tools. To facilitate the evaluation of the tools developed, we developed the websites as a database to store the data used and the predictions. The list of patient features and predicted probabilities are displayed as a list below the calculation tool. Actual results – i.e., the metastasis of lymph node for the AxLN prediction model and pCR for NAC prediction model – can be input later. To realize these functions, the websites is currently accessed by a login process using an appropriate user account. The data matrix can be exported as a comma-separated value (CSV) file from the administrator account.
Discussion
Numerous nomograms are currently available for predicting breast cancer diagnosis and treatment. The model development and validation methods are well established. In contrast to nomograms, data mining tools show larger AUC values and are more robust against missing values (14, 15). However, data mining tools require more features. Therefore, we implemented a website that dynamically shows/hides input fields, based on the input by the user. However, the considerable input effort required are a disadvantage compared with nomograms. While data mining tools are robust against missing values, we evaluated robustness for 1 missing variable (14, 15). More data are preferable for accurate predictions.
In fact, MLR can deal with more variables. However, the generalization ability – i.e., the prediction accuracy for independent data – will dramatically decrease when variables have a positive correlation (i.e., multicollinearity among variables). Therefore, only independent parameters can be used, which limits the resulting prediction accuracy. Few input variables also result in the models’ greater sensitivity toward missing values. Therefore, the number of variables and the performance of prediction tools including accuracy and robustness against missing values, is a trade-off. Although the data mining methods developed require more input variables, a well-designed user interface will minimize this problem.
The AxLN and NAC models yielded AUC values of 0.768 (95% confidence interval [95% CI], 0.763-0.774) and 0.787 (95% CI, 0.716-0.858), respectively, using validation data (14, 15). There remains much room for improvement of their accuracy. Gene signature–based mathematical models have also been developed as new molecular biomarker sets (20, 21). However, a comparative study between clinicopathological factors and gene signature–based models suggested no clear advantage of the latter (22). Nomograms incorporating clinicopathological factors and new biomarkers, such as Ki-67 expression, have recently been developed (23). Our method is not limited by the integration of these new markers.
Our tools were developed and validated by multiple institute datasets. Therefore, the ratio of outcomes – e.g., metastasis of AxLN or not – was different in each dataset. For the AxLN model, this ratio was controlled in approximately 50% of the training datasets. Fifty percent of predicted probability indicates the half possibility of AxLN metastasis. There was no such proportion control in the NAC model. Therefore, the probability of pCR after NAC depends on the ratio of pCR in the training dataset.
In future work, the clustering algorithm should be implemented, and the patients with similar features should be displayed simultaneously with the predicted results as references. This would aid the oncologist in understanding which features contribute to the prediction result. Developing a system to share input data with electronic medical records will facilitate the use of these prediction tools.
The website is available at https://www.brca-pm.net/model/entrance.php. A user account and password are currently required to use the system. To create an account, please contact
Conclusion
The websites incorporating prediction tools for AxLN metastasis (AxLN model) and pCR to NAC (NAC model) in primary breast cancer patients was developed. ADTree was used for the calculation engine, and an unknown option for each variable can be inputted. The website also functions as a database for accumulating patient information, and can report accumulated user results.
Footnotes
List of Abbreviations
Acknowledgements
We thank Drs. Hyeong-Gon Moon, Wonshik Han and Dong-Young Noh, Department of Surgery, Seoul National University College of Medicine, Seoul, Republic of Korea; Dr. Masahide Kondo, Department of Health Care Policy and Management, Graduate School of Comprehensive Human Sciences, University of Tsukuba, Ibaraki, Japan; Dr. Katsumasa Kuroi, Department of Surgery, Tokyo Metropolitan Cancer and Infectious Diseases Center, Komagome Hospital, Tokyo, Japan; Dr. Hironobu Sasano, Department of Pathology, Tohoku University Hospital and School of Medicine, Miyagi, Japan; Dr. Takashi Inamoto, Department of Breast Surgery, Tenri Hospital, Nara, Japan; Drs. Yasuhiro Naito and Masaru Tomita, Institute for Advanced Biosciences, Keio University, Yamagata, Japan; Dr. Sinji Ohno, Department of Breast Oncology, National Kyushu Cancer Centre, Fukuoka, Japan; Dr. Nobuaki Sato, Department of Surgery, Niigata Cancer Centre Hospital, Niigata, Japan; Dr. Hiroko Bando, Department of Breast and Endocrine Surgery, Faculty of Medicine, University of Tsukuba, Tsukuba, Ibaraki, Japan; Dr. Norikazu Masuda, Department of Surgery, Breast Oncology, Osaka National Hospital, Osaka, Japan; and Dr. Hiroji Iwata, Department of Breast Oncology, Aichi Cancer Centre, Nagoya, Aichi, Japan.