
Abstract
Obesity is associated with breast cancer in postmenopausal women, and breast density is a marker of breast cancer risk. Leptin is produced by the adipose tissue, acts through receptors that are polymorphic in nature, and is considered a cancer growth factor. The relationship between body mass index, leptin, leptin receptors and breast density is not well studied. A cross-sectional analysis in 392 post-menopausal healthy women was conducted; participants provided permission to obtain copies of their most recent screening mammogram. Non-fasting plasma leptin levels were determined using a commercially available leptin ELISA kit. Analysis of the Q223R genotypes of the LEPR gene were performed by PCR followed by restriction fragment length polymorphism analysis using DNA extracted from buffy coat samples.
A statistically significant positive relationship was observed between leptin levels and body mass index (p<0.0001); leptin was significantly positively associated with mammography total breast area and non-dense breast area (p<0.0001), while it was inversely associated with percent breast density (p<0.0001). Leptin levels varied across the LEPR Q223R polymorphism, and were higher in women homozygous for the AA variant. Percent breast density decreased across the LEPR Q223R genotype, with lower percent density in women with the AA genotype. When dense area was considered according to quartiles of leptin and stratified by LEPR Q223R, a significant inverse trend between leptin levels and dense breast area was observed only among women with the G/G genotype (p-trend<0.001). After adjustment for possible confounders, leptin levels were significantly inversely associated with percent breast density (p=0.01). A significant interaction between body mass index and leptin levels on percent breast density was observed (p=0.03).
These findings suggest that the association between leptin and breast density may vary by LEPR Q223R genotype, and that body mass index and leptin may act in an interactive way in determining breast density.
Introduction
Mammographic density is one of the known and strongest risk factors for breast cancer (1). Women with the highest absolute and/or relative breast density have 2 to 6 times higher risk of developing breast cancer than women with lower density (2-6). Despite these findings, the underlying biological mechanisms by which breast density increases breast cancer risk remains unclear. Hormonal, genetic, and environmental factors may play a role in determining a woman's breast density.
Increasing body mass index (BMI) is consistently inversely associated with percent breast density (7, 8), and is directly associated with the non-dense area of the breast, which is mostly constituted of fat. However, obesity is an independent risk factor for breast cancer among postmenopausal women (9), a paradox that has yet to be understood. Body mass and body composition are under a multi-factorial endogenous and exogenous control. Thus, it is possible that obesity-related hormones may play a role in explaining this disparate relationship. Although studies have evaluated obesity in relation to percent breast density, limited research has evaluated the role of obesity-related hormones, including adipokines such as leptin, a potential cancer growth factor, on breast density (10).
Leptin is a hormone produced primarily by white adipose tissue that regulates appetite and energy expenditure, as well as reproductive and immune functions (11). It is suggested to promote angiogenesis and pro-inflammatory responses (13-15), to stimulate the proliferation of normal and malignant breast epithelial cells (16) and to be associated with cancer of the breast and of other sites (10, 17, 18). An inverse association between leptin levels and percent breast density has been reported, but it is considered to be mediated by BMI since it disappears after statistical adjustment (19-21); a direct effect of leptin on percent density has not been demonstrated so far.
Several genes are involved in leptin function and regulation (12); polymorphisms in these genes may modify leptin levels and/or activity at the receptor site. Among the others, the LEPR polymorphism Q223R (rs1137101) is a common variant with functional significance, and is thought to be associated with an impaired signaling capacity of the leptin receptor (12). The homozygous variant AA has been associated with higher mean circulating levels of leptin (22-24). To date, no prior studies have evaluated leptin receptor polymorphisms in relation to breast density.
Given the complex relationship between BMI, leptin and breast density, we conducted a cross-sectional analysis in post-menopausal healthy women in order to understand the role of leptin on breast density, and to study the potential modifying effect of BMI and LEPR polymorphism on such association.
Materials and Methods
Study population
This is a cross-sectional analysis using controls from the Mammograms and Masses Study (MAMS). MAMS was initially designed to assess hormones in relation to mammographic density; details have been described elsewhere (25, 26). Women were enrolled through the Magee Women's Hospital Mammographic Screening and Diagnostic Imaging Program in greater Pittsburgh area, PA, USA. Briefly, eligible women were aged 18 years or older and were visiting Magee-Womens Hospital (Pittsburgh, PA, USA), or a Magee Womancare Center in the greater Pittsburgh area, between September 2001 to May 2005 for one of the following reasons: (i) a breast biopsy, (ii) an initial surgical consultation after breast cancer diagnosis, or (iii) a routine screening mammogram. Women who reported a prior cancer history other than non-melanoma skin cancer, who consumed more than 5 alcoholic beverages per day, or weighed less than 110 lb (49.9 Kg) or more than 300 lb (136 Kg) were excluded. The MAMS study population consists, in total, of 1,133 women, 869 of which with a negative screening mammogram, or with benign breast disease; the University of Pittsburgh Institutional Review Board reviewed and approved the study protocol, and all study participants provided written informed consent.
This cross-sectional analysis was restricted to post-menopausal women (n=647). Women were classified as post-menopausal if they did not report periods in the year before enrollment, had ever used menopausal hormone therapy (MHT), had a bilateral oophorectomy, or were 50 years or older at enrollment. Women who reported a hysterectomy without bilateral oophorectomy were considered to be postmenopausal if they had ever used MHT in the past or were 50 years or older at hysterectomy. Subsequently, women who were using MHT at the time of enrollment (n=165), lacking a mammogram (n=35), had their blood drawn more than 4.5 months after the mammogram (n=16), whose questionnaire and/or blood sample were not available (n=23) or who reported a previous history of cancer (n=16) were excluded, leaving a total sample of 392 women eligible for this analysis. Additionally, laboratory data were incomplete for 27 women, thus the final sample consisted of 365 women.
Participants completed a self-administered questionnaire on demographics, medical and reproductive history, lifestyle factors, medication use, and family history of breast cancer. A non-fasting, 40 mL sample of peripheral blood was collected from the study participants at enrollment.
Mammogram
Participants provided permission to obtain copies of their most recent screening mammogram. The assessment of mammographic measures has been described in detail elsewhere (25). One expert reader, masked to the identity status (benign control, well control) and demographic and risk factor characteristics of the subject, read all mammograms. Total breast area and all dense regions were measured using a compensating polar planimeter (LASICO) on the craniocaudal view with the side of breast (right or left) randomly chosen for each participant. Non dense breast area was calculated by subtracting dense breast area from total breast area. Percent density was calculated by dividing dense breast area by total breast area * 100. The expert reader also provided a subjective measure of film quality (excellent, good, fair, poor, very poor, extremely poor). A reproducibility study (n=28 MAMS participants) showed intra-class correlation coefficients for dense breast area, total breast area and percent density of, respectively, p=0.86, p=0.99, and p=0.89 (24).
Laboratory measurements
Leptin hormone levels were measured using refrozen plasma samples (1 previous freeze-thaw cycle). Non-fasting plasma leptin levels were determined using a commercially available leptin ELISA kit (Biosource International, Camarillo, Ca, USA). Batches were made using 96-well plates, which included 38 samples, 8 leptin standards and quality controls. Forty blinded duplicates (10%) were included as a means of assessing the reliability of the assay. Each sample was run in duplicate within the same plate and a coefficient of variation (CV) was calculated. All CVs greater than 15% were repeated. The average of the 2 leptin measurements was used for this analysis.
The genotypes for the sequence variants in the Q223R of the LEPR gene were performed by PCR followed by restriction fragment length polymorphism analysis (PCR-RFLP) using DNA extracted from buffy coat samples. Genotyping was performed using a 7300 RT-PCR system (Applied Biosystem, Foster City, CA, USA). The methods used for the genotyping of LEPR Q223R were based on those described by Gotoda et al (27), in which a PCR was followed by MspI restriction digestion to detect the A-to-G transition polymorphism at codon 223 of the LEPR gene. Two sequence-specific oligonucleotide primers were used (primer 5′: AAACTCAACGACACTCTCCTT; primer 3′: TGAACTGACATTAGAGGTGAC). The specific genotypes were identified by gel electrophoresis based on the following molecular weights of the PCR product: wild type (80 bp), homozygote variant (58 bp+22 bp), and heterozygote (80 bp+58 bp+22 bp). As a means of preventing cross-contamination of the PCR product, the DNA extraction and PCR set up were performed on different benches in the laboratory.
Statistical analysis
Continuous variables are presented as mean ± standard deviation or median (25th, 75th percentiles) whereas discrete variables are presented as percentages. Wilcoxon rank-sum test was performed for comparison of medians. Pearson correlation coefficients were estimated for the associations between leptin, BMI, and mammographic density outcomes (total breast area, dense area, non-dense area, percent density). Analysis of variance allowed for comparison of leptin levels and breast density across categories of the LEPR Q223R genetic polymorphism and of BMI; multiple linear regression was performed to assess the association between plasma leptin levels and percent breast density; covariates considered in the model were: age (years), time since fasting, BMI (Kg/m2), batch, education (≤high school/post-secondary education), race (white/other), smoking status (never/ever), family history of cancer (yes/no) and previous breast biopsy (yes/no). All multivariate analyses were adjusted for mammography film quality and time of blood draw. Breast density outcomes were square root transformed; leptin levels were transformed using the natural logarithm in order to reach normality of the distribution. Tests for linear trend were assessed by modeling the leptin exposure as an ordinal variable. Analyses were performed using SAS version 9.2; all p values are two-sided.
Results
A general description of the study population (Tab. I) shows that this is a sample of prevalently white, educated post-menopausal women, two thirds of which had a BMI greater that 25 Kg/m2. More than 80% of the women had at least 1 pregnancy and 78% of women had at least 1 live birth. Roughly 18% of the women reported a previous breast biopsy. Median leptin levels were 34.3 ng/mL. The average percent breast density was 27%.
Descriptive Characteristics Of The Study Population (N=365)
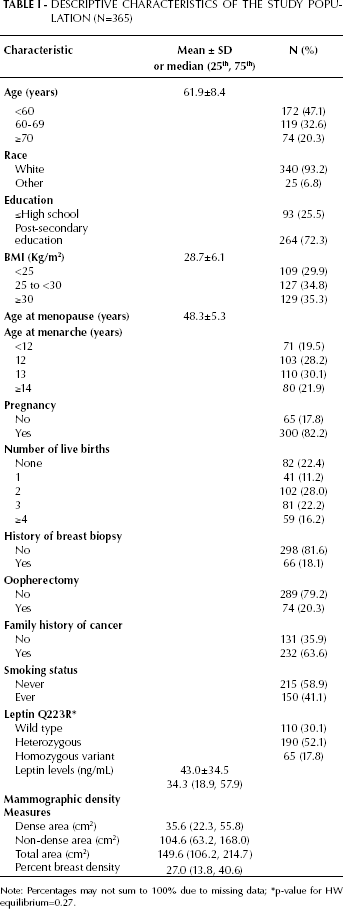
Note: Percentages may not sum to 100% due to missing data; *p-value for HW equilibrium=0.27.
A statistically significant positive relationship was observed between leptin levels and BMI (p<0.0001; Tab. II); leptin was significantly positively associated with total breast area and non-dense breast area as measured by mammography (p<0.0001; Tab. II). Conversely, the relationship between leptin and percent breast density was inverse and statistically significant (p<0.0001). Similar results were observed when BMI was considered in relation to breast density (Tab. II).
Correlation Coefficients Between Leptin Levels, Body Mass Index And Mammographic Patterns
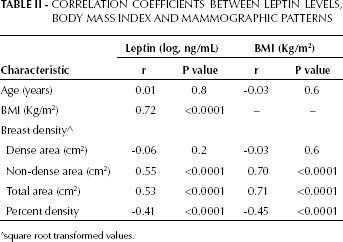
square root transformed values.
Leptin levels varied across the LEPR Q223R polymorphism (Fig. 1), and were higher in women homozygous for the AA variant. Percent breast density decreased across the LEPR Q223R genotype, with lower percent density in women with the AA genotype. These differences, however, were not statistically significant (tests of trend according to LEPR Q223R genotype: leptin p=0.17; percent density p=0.15). No variation of dense area across LEPR Q223R genotype was observed (test of trend, dense area p=0.23).
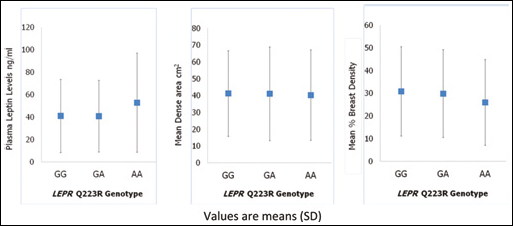
Relationship between LEPR Q223R polymorphism, leptin levels and breast density. Values are means (SD).
When the dense area was considered according to quartiles of leptin and stratified by LEPR Q223R (Fig. 2), a significant inverse trend between leptin levels and dense breast area was observed only among women with the G/G genotype (p<0.001).
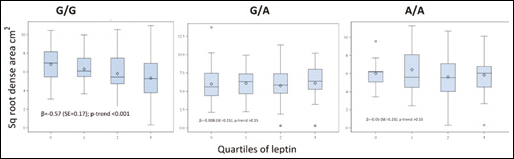
Dense breast area for quartiles of leptin by LEPR Q223R.
After adjustment for possible confounders, leptin levels were significantly inversely associated with percent breast density (p=0.01; Tab. III). Similar results were obtained when BMI was considered, with a significant inverse trend in the association of percent breast density with increasing tertiles of BMI (p=0.01). When an interaction term was included in the model, a significant interaction between BMI and leptin levels on percent breast density was observed (p=0.03). Further analysis of such interaction suggests that the association between BMI and breast density/percent breast density is present in women in the lower leptin quartile; on the other hand, leptin levels are inversely associated with breast density and percent breast density in women in the higher BMI category (data not shown).
Multivariable Associations Between Percent Breast Density And: Leptin, LEPR Q223R, AND BMI (Kg/m2)
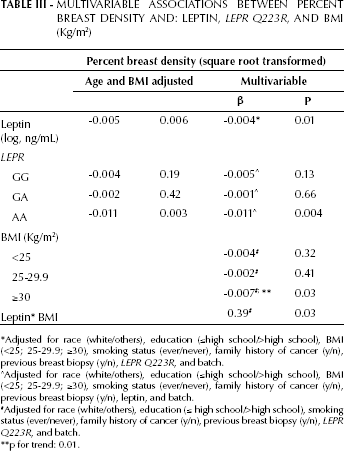
Adjusted for race (white/others), education (<high school/>high school), BM (<25; 25-29.9; ≥30), smoking status (ever/never), family history of cancer (y/n), previous breast biopsy (y/n), LEPR Q223R, and batch.
Adjusted for race (white/others), education (≤high school/>high school), BM (<25; 25-29.9; ≥30), smoking status (ever/never), family history of cancer (y/n), previous breast biopsy (y/n), leptin, and batch.
Adjusted for race (white/others), education (≤ high school/>high school), smoking status (ever/never), family history of cancer (y/n), previous breast biopsy (y/n), LEPR Q223R, and batch.
p for trend: 0.01.
The LEPR Q223R polymorphism was inversely associated with percent breast density, with similar associations observed across levels of the gene polymorphism (Tab. III). No significant associations were observed in the multivariable analyses when breast density and total breast area were considered (data not shown).
Discussion
Findings from this cross-sectional study of post-menopausal women suggest an inverse association between plasma leptin levels and mammographic percent density but not with breast dense area; the results held after adjustment for several possible confounding factors including age and BMI. Furthermore, we observed for the first time an interaction between leptin and BMI in their association with percent breast density. This novel finding suggests that in addition to both leptin levels and BMI having independent associations with breast density, their concurrent presence may increase the chance of density breast patterns that result in higher breast cancer risk.
Only two prior studies have assessed leptin in relation to mammographic density among postmenopausal women (19, 20). Stuedal et al (19) observed an inverse association between leptin and both measures of breast density (dense area and percent density) which attenuated with adjustment for BMI and mammographic non-dense area. Additionally, their findings suggest that the association between leptin and breast density may vary by the degree of breast fat. A difference between the present study and the previously published report by Steudal et al is the source population, consisting of Northern European women, with a lower average BMI (26.7 vs 28.7 Kg/m2 in the present study) and lower leptin levels. These factors may in part explain the different results observed.
A recent study by McCormack et al (20) also examined leptin levels among a population of postmenopausal White and Afro-Caribbean women. Although leptin was inversely related to percent density in ethnic-age-adjusted models, this association was attenuated with further adjustment by BMI. The study was conducted in UK, included a smaller sample size than the current analysis, was diverse in ethnic composition, and had an average gap between mammography and blood draw of 1.7 years. Therefore the comparability with the present study is low.
In the current study, leptin levels varied with the presence of a functional polymorphism, LEPR Q223R in the direction expected from the functional activity of the polymorphism, but the association was not statistically significant. The association between leptin and percent density did not differ when the data were stratified by the genetic polymorphism. When analyzing the dense area, leptin was inversely associated with density area among women with the G/G genotype; however, no associations between leptin and dense area with the G/A or A/A genotypes were observed. Despite the overall null findings, the results suggest that the association between leptin and dense area may vary by LEPR Q223R genotype. This is the first report to examine this relationship; our findings suggest that leptin local activity in the breast tissue may be mediated by the presence of leptin receptors, and that polymorphisms in the receptor genes may have functional effects in the target tissue.
This study has several strengths: the inclusion of a large number of women who fully participated in this effort by answering the questionnaire and furnishing a blood sample in addition to providing access to their mammogram. This is also the first study to address the complex relationship between BMI, leptin levels and leptin receptor polymorphisms on mammographic patterns. In fact, although some studies have addressed some of these factors individually, none have provided a more global picture by including all of these relevant factors within the same analysis.
The original study design had some limitations, since it was based on voluntary participation of women; the sample resulting from this selection was composed mainly of white, educated women and this may limit the generalizability of our results. In addition, leptin measures were performed at one time point, since there was only one blood draw per subject, thus we were unable to account for any potential within-subject leptin variability. Samples included in this study were re-frozen once, and the effect of thawing/freezing on leptin levels is unknown. Despite this, prior research suggests that leptin levels are relatively stable over a 3-year period (ICC=0.58) (28). Leptin levels can vary by time of day and time since last food consumption; the blood samples collected in the parent study were non-fasting. While the analyses were adjusted for time of blood draw, the leptin values presented here do not represent fasting levels. The relation between leptin levels and food consumption and with time of the day when the sample is drawn may be some of the reasons contributing to the diverging results observed across published studies.
In conclusion, this study suggests a possible interaction between leptin and BMI in determining breast density in post-menopausal women. In addition, the results indicate that genetic variants regulating the local breast tissue metabolism and growth through the control of hormonal levels, such as leptin, may be relevant in breast cancer risk when breast density is considered.