
Abstract
Motivation
A series of Eu2+ (0.0025≤ × ≤0.025) activated Sr2SiO4:xEu2+ (SSO:xEu2+) phosphors were synthesized via a sol-gel method. The phosphors were characterized by x-ray diffraction (XRD), scanning electron microscopy (SEM) and photoluminescence (PL) spectroscopy. The differences between α’ and β phase of SSO in the density of states and energy band gap were investigated.
Results
The energy gap of α’-SSO and β-SSO are 4.489 and 4.106 eV, respectively. While, two samples showed similar total and partial densities of states. Under the excitation by the ultra violet (UV) light (365 nm), the SSO:xEu2+ phosphor exhibited a green emission band from 400 to 700 nm, which was corresponding to the transition of 5d → 4f of Eu2+ ions. Two emission peaks at 464 and 532 nm could be obtained through Gauss fitting curves. The ratio of the blue to green emission peak decreased with the Eu2+ concentration and the peaks shifted regularly with it. The thermal quenching property was investigated and its activation energy was calculated. The results indicated that this phosphor could be a candidate of green phosphor for UV-based light-emitting diodes (LEDs).
Introduction
Increasing attentions have been paid to the white light emitting diodes (LEDs) due to their high efficiency, long life times, low contamination to environment, and absence of mercury. LEDs have been regarded as the new generation of illumination (1-2-3). The most commonly used method to produce white light is a combination of blue chip with yellow emitting phosphor materials. However, the low color rendering limited its applications in many fields. To solve this problem, one approach is to add some red phosphors into the yellow phosphors; while the other approach is to combine an ultraviolet (UV) Indium Gallium Nitride (InGaN) chip with red, green and blue multiphase phosphors (4). The latter model white LEDs can offer high color rendering index (Ra>85) and tunable correlated color temperatures (CCTs). Thus, the tri-color phosphors that can be excited by UV light become current research focuses. Many UV-based tri-color phosphors have been reported, including Ca6-x-yMgx-z(PO4)4:Euy2+, Mnz2+, Ba3MgSi2O8:Eu2+, Mn2+, Sr3SiO5:Ce3+, Li+, β-SiAlON:Eu2+, Ca2BO3Cl:Eu2+, Li2SrSiO4:Eu2+, NaSrBO3:Ce3+, and Y3Al5O12: Eu2+.
Especially, Eu2+-activated SSO phosphor contains two phases, α’-SSO and β-SSO and they can emit green light (5). JK Park prepared Eu2+ activated Sr2SiO4 yellow phosphor by a solid-state method for the first time (6). XY Sun synthesized green yellow emitting β -SSO:Eu2+ phosphor with a solid-state method (7). Dutczak et al reported Sr2SiO4:Eu2+, Dy3+ yellow persistent phosphor (8). Z Song studied the Sr2SiO4:Eu2+ and used it as a thermochromics material (9). JH Lee prepared Sr2-xEuxSiO4 by a flux method and studied its phase transition and luminescent properties (10). However, there is no report on the calculation of the density of states and energy band gap to date. In this paper, we synthesized SSO:xEu2+ phosphors with different Eu2+ concentrations (x) by a sol-gel method, and investigated the density of states and energy band gaps. The phase transition, crystal structure and photoluminescent properties were studied in detail.
Experimental procedure
Sample preparation
Powder samples of Sr2-xSiO4:xEu2+ with different Eu2+ concentrations were prepared using a sol-gel method. Sr(NO3)2·4H2O, Si(OC2H5)4 (TEOS), Eu(NO3)3·6H2O, C6H8O7 and C6H8O7 were employed as the starting materials in the experiment and all the materials were analytical reagents (ARs). Firstly, 0.02 mmol Eu(NO3)3·6H2O, 2mmol Sr(NO3)2·4H2O and 2 mmol C6H8O7 were dissolved in 30 mL of deionized water, stirred and heated at 60oC for about 40 min. Meanwhile, 1 mmol tetraethyl orthosilicate (TEOS) was added in 20 mL deionized water and heated at 60oC to hydrolyze for 40 min. The above two solutions were mixed and the pH value of the final solution was adjusted to 2-3 with HNO3 (0.5 mol/L). A transparent aqueous solution was obtained after stirring for 1 h. Subsequently, the precursor was heated in a water bath at 85oC for 8 h until a transparent gel was formed, which was kept in a 120oC atmosphere for 12 h to dry. Finally, the resulting sample was sintered at 900oC under a reducing atmosphere (90% N2/10% H2, flow rate 150 mL/min). The furnace was cooled down to room temperature naturally and the final samples were obtained after being ground slightly.
XRD analysis
SEM images
Luminescent properties of the samples
The structural and phase composition of the prepared powder samples were characterized by x-ray diffusion (XRD) using Cu Kα1 radiation (Bruker D8) at 40 kV and 40 mA. Photoluminescence (PL) and photoluminescence excitation (PLE) spectra of the samples were measured by a fluorescence photospectrometer (Hitachi F-7000) with a 150 W Xe lamp. The SEM images were taken by a JSM-7500F Field emission scanning electron microscope (FESEM). All above measurements were performed at room temperature except the temperature spectra.
Results and discussions
Figure 1 shows the XRD patterns of the SSO:x%Eu2+ phosphors with different concentrations of Eu2+ ions (x = 0.0025, 0.005, 0.01, 0.0125, 0.015, 0.0175, 0.02 and 0.025) and the standard Joint Committee on Powder Diffraction Standards (JCPDS) cards No.39-1256 and 38-0271 were analyzed to investigate the crystal structures of the phosphors. The two standard JCPDS cards were corresponding to orthorhombic α’-SSO and monoclinic β-SSO, respectively. There were some differences of XRD patterns between the α’-SSO and β-SSO, such as the diffraction peaks (112), (211) in No.39-1256 and (211), (-121), (-301), (301) in No. 38-0271. The diffraction peaks (211) and (301) increased with the Eu2+ ion concentration and reached the maximum when the concentration of Eu2+ ion was 1 mol%. However, the diffraction of (112) enhanced with the concentration of Eu2+ all along. The ratio of (211)/(112) was 5.92 when the concentration of Eu2+ ions is 1 mol%, while it was 3.27 and 0.63 when the concentration of Eu2+ ions were 0.25 and 2.5 mol%, respectively. The results indicated that the crystal structures of the samples were a mixed phase composed of both α’-SSO and β-SSO phases. The β-SSO phase was dominant when the Eu2+ concentration was less than 1%, while α’-SSO phase became dominant when it exceeded 1%. Generally, the Eu2+ ions (0.0947 nm) would substitute for the site of the bigger Sr2+ ions (0.112 nm) after it entering crystal lattice according to the ionic radius and valence state, which would induce the change of the lattice constants and some crystal phase variation from β-SSO to α’-SSO. According to Bragg equation (2dsinθ =nλ), we could know that the inter-planar distance was not changed until the concentration of Eu2+ ion was 2.5 mol% smaller. The average size of crystallite was 59.86 nm with the Scherer formula (D =0.89λ/βcosθ). The calculated result was compared with scanning electron microscopy (SEM) observed result (See Supplementary Figure 1, available online as supplementary material at www.jab-fm.com), which indicated that the TEM photos of Sr2SiO4 composite particle showed serious agglomeration of Sr2SiO4.
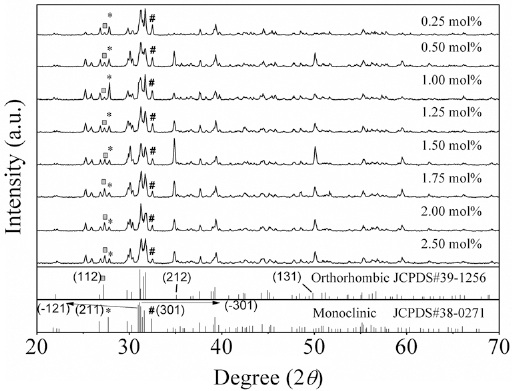
(Color online) x-ray diffusion (XRD) patterns of Sr2-xSiO4:xEu2+.
First principle calculation was implemented in the software CASTEP (11). A Vanderbilt-type ultra-soft pseudopotential formalism and the exchange-correlation function based on the generalized gradient approximation (GGA) in the scheme of Perdew-Burke-Eruzerhof (PBE) were used in the calculations of energy band structure and density of state. As seen in the energy band structures of both SSO phases, they displayed an indirect optical band gap, and the gap between the lowest energy level of the conduction band and the highest energy of the valence band were about 4.489 and 4.106 eV, respectively (Fig. 2A and 2C). According to the report of Xiaocheng Zeng [Qu et al (12)], the electron-occupied 4f energy levels of Eu located within the band gap of the host, while the empty 5d levels were just above the conduction band minimum (CBM), which indicated that the electronic transition between 4f and 5d levels of Eu induced the luminescence. Thus, SSO belonged to the materials with large band gaps that are usually good hosts for various luminescent ions. The valence band was about 3.1 eV by the calculation of the absorption spectra (See Supplementary Figure 2, available online as supplementary material at www.jab-fm.com). The error existed between the calculated value and the theoretical value.
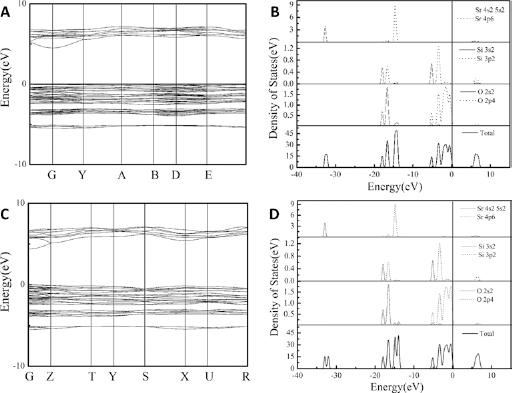
Energy band structures (
Both SSO samples showed similar total and partial densities of states. The top of the valence band is dominated by Sr4p, O2p and Si3p states, while the conduction band is mainly composed of O 2p and Si 3p states (Fig. 2B and 2D).
The SEM patterns of the SSO:xEu2+ phosphor with different Eu2+ ions (x = 0.0025, 0.01, 0.015 and 0.025) were also observed (Supplementary Fig. 1), and found that the phosphor exhibited obvious agglomerate phenomenon after sintered at 900oC for 4h. However, the similar orbicular shape did not change obviously with the Eu2+ concentration.
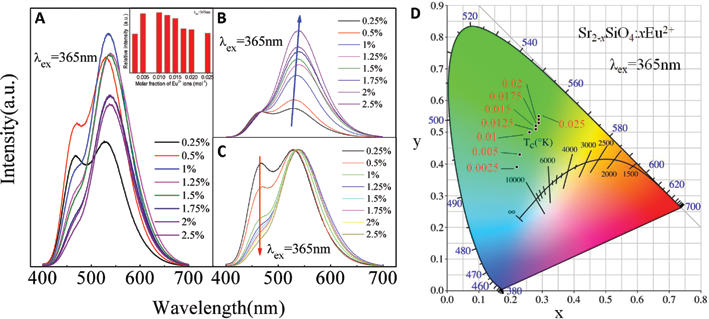
The excitation spectra of SSO:0.01Eu2+ phosphor monitor for 532 nm and 464 nm were shown in Figure 3A. The excitation spectra of SSO:0.01Eu2+ phosphor showed that the excitation peaks monitoring for 464 nm locate at 288 and 309 nm, while that for 532 nm located at 274, 310 and 365 nm. The excitations were attributed to the dipole allowed 4f-5d transitions of Eu2+ ions. The emission spectra of SSO:0.01Eu2+ phosphors excited by 365 nm displayed an asymmetric broad band from 400 to 700 nm with two main emission peaks locating at 464 and 532 nm from Gauss fitting curves, respectively (Fig. 3B). The two emission peaks were attributed to a transition from the 4f65d1 excited state of Eu2+ to the 8S7/2(4f7) ground state (13).
(
An empirical formula (Eq. 1) fitting the position in energy of the lower d-band edge for Eu2+ or Ce3+ ions was given by Van Uitert (14).

where Q is the energy position for the lower d-band of the free ions (34000 cm−1 for Eu2+ ions), V is the valence of the activator cation and here V is +2, n is the coordination numbers of cations, ea is the electron affinity of the atoms that form anions (in electron volts (eV)), and r is the radius of the host cation replaced by the activator cation. Generally, the values of ea vary with the crystal cohesion and outward (s2) polarization etc. surrounding of Eu2+ ion. The value of ea for SiO42- is 2.19 eV (15). The ionic radius of Sr2+ is 0.118, 0.121, 0.126, 0.136 and 0.144 nm when the coordination number n equals to 6, 7, 8, 9 and 10, respectively (16). All the numerical values were put into Eq.1 and the energy positions for the lower d-band of Eu2+ ions occupying the n = 6 ∼10 of Sr2+ ions were 18615, 19906, 21266, 22567 and 24300 cm−1, which were corresponding to 537, 502, 470, 443 and 411 nm, respectively. Comparing the theoretical calculation results and the measured values, the energy positions for the lower d-bands at 21266 and 18615 cm−1 were similar to those of 464 and 532 nm. The results indicated that there were hexa-coordinate and Eight-coordination Sr2+ ions in the crystal.
The Eu2+ substitution for Sr(I) causes the longer wavelength (532 nm) and Sr(II) attributed to the shorter one (464 nm). The populations of Sr(I) and Sr(II) are almost equal. When the crystal phase changes from α’ to β, the SiO4 tetrahedron rotate and loses inversion symmetry. In this process, the Sr-O become a long bond and a short bond, while the average length is a constant (17).
The inset of Figure 3A showed the relationship between emission spectra of SSO:xEu2+ (x = 0.0025, 0.005, 0.01, 0.0125, 0.015, 0.0175, 0.02 and 0.025) and Eu2+ concentrations (x) was analyzed. Under an excitation wavelength of 365 nm, the emission intensity was significantly enhanced as the increase of Eu2+ concentration and the 532 nm peak researched the maximum intensity when the Eu2+ was 1 mol%. However, quenching occurred when the Eu2+ ion concentration increased further (Fig. 3A). The 464 and 532 nm emission peaks. Figure 3B, C gave the normalized emission spectra for 464 and 532 nm peaks, respectively. It can be seen that the relative intensity of 532 nm peak increased with the Eu2+ concentration, while that of 464 nm peak declined. Redshift presented in both of the two emission peaks as the Eu2+ concentration increased, which was attributed to the effect of the crystal field splitting on Eu2+ ions. Before Eu2+ ions transfer from 5d excited state to the 4f ground state, they transferred from the higher 5d levels to the lower levels, which would reduce the transition energy from 5d to 4f and induced the redshift.
The critical energy transfer distance between ions can be estimated by Blasse's equation (18):
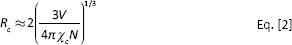
where V is the volume of the unite, Xc is the critical concentration, N is the number of cation in the matrix unite. In the SSO:xEu2+, V is 0.3912 nm3, N is 8 and Xc is 0.01. The calculated critical energy transfer distance was 2.05 nm according to above data.
The Commission Internationale de L'Eclairage (CIE) chromaticity coordinates and CIE chromaticity diagram for the SSO:xEu2+ phosphors with Eu2+ concentration, were shown in Figure 3D. It showed that the CIE chromaticity coordinates (X, Y) were (0.22, 0.39), (0.23, 0.43), (0.26, 0.5), (0.28, 0.52), (0.29, 0.53), (0.29, 0.54), (0.29, 0.55) when x equaled to 0.0025, 0.005, 0.01, 0.0125, 0.015, 0.0175, 0.02 and 0.025, respectively. The results were consistent with the variety of the emission spectra. The color of SSO:xEu2+ phosphors could be tuned from cyan to green by changing the Eu2+ concentration.
The thermal stability was important for phosphor to be used in the pc-white LEDs. The emission intensity of SSO:0.01Eu2+ phosphor at various temperatures from 50oC to 150oC were measured and the emission spectra are presented in Figure 4. It can be seen that the emission intensity of SSO:Eu2+ phosphor was 60% of its original values as the temperature increased to 423 K, which indicated that this phosphor had better thermal stability. In order to investigate the thermal quenching mechanism, the emission intensity and the temperature data were fitted using the Arrhenius equation (19).
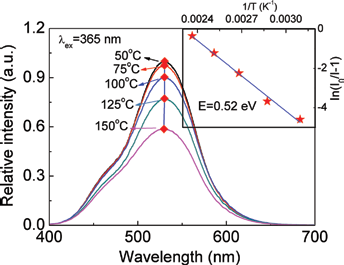
Emission spectra of Sr1.995SiO4:0.005Eu2+ at different temperatures from 50oC to 150oC under 365 nm excitation. The inset plots fitted the activation energy for thermal quenching of SSO:xEu2+.
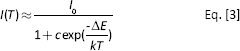
where I0 is the emission integrated intensity at room temperature, I(T) is the intensity at temperature T, c is a constant, E is the activation energy for thermal quenching, and k is Boltzmann's constant.
The inset of Figure 4 plotted the In[(I0/I)-1] versus 1/(kT), and the slope of the fitting linear was proportional to the activation energy (ΔE). For SSO:Eu2+ phosphor, ΔE is 0.52 eV by calculation. Compared with the YAG:Ce3+ (0.24 eV), the activation energy of SSO:0.01Eu2+ was bigger, which illuminated that the crystal structure of SSO:Eu2+ was more rigid than that of YAG:Ce3+ (20).
Conclusions
In summary, SSO:xEu2+ phosphors with different Eu2+ concentrations have been synthesized by the sol-gel method. There are two different phases for SSO, orthorhombic α’-SSO and monoclinic β-SSO, which have some differences in the energy band and state density between the two phases. The reciprocal transformation would occur when the Eu2+ concentration varied. The phosphor could be excited by 365 nm UV light and emit strong green light that can be tuned from cyan to green by changing the Eu2+ content. The activation energy (ΔE) of SSO:0.01Eu2+ phosphor was 0.52 eV. The results showed that the phosphors would have potential application in the UV pumped w-LEDs.
Footnotes
Financial support: This work is financially supported by the National Science Foundation of China (No.61205180), Natural Science Foundation of Hebei Province (Grants No. E2012201087), the first batch of young talent support plan of Hebei Province, the distinguished young scholars of Hebei University (2012JQ01) and Natural Science Foundation of Hebei University (Grants No. 3333112). We also appreciate the financial support from the Midwest universities comprehensive strength promotion project.
Conflict of interest: None of the authors has financial interest related to this study to disclose.