
Abstract
Background
There has been increased attention given to polymeric nanoparticles as protein carriers. In this regard, chitosan/tripolyphosphate (TPP) nanoparticles are considered to be a simple and efficient carrier. However, to have an ideal protein release profile, we need to optimize the properties of the carrier.
Methods
This study examined the influence of 4 critical process parameters on the physicochemical characteristics of final nanoparticles. Chitosan-based nanoparticles were produced by ionic gelation, and then the size, polydispersity and zeta potential of those resulting nanoparticles were evaluated. Subsequently, the encapsulation efficiency of bovine serum albumin as model protein was investigated.
Results
The morphologies of nanoparticles were characterized using field emission scanning electron microscopy (FE-SEM). Linear mathematical models were presented for each response through 3 levels using Central Composite Design with the help of design of experiments software, and formulation optimization was performed.
Conclusions
Such research will serve as a basic study in protein loading into TPP cross-linked chitosan nanoparticles.
Introduction
Polymeric nanoparticles fabricated with controlled characteristics have received considerable attention in recent years. They have a broad range of applications in nanotechnological devices, especially as drug delivery vehicles. Delivery systems of peptide and protein drugs need special consideration to prevent deactivation of proteins during release.
This study focused on a suitable peptide delivery vehicle based on chitosan made through a protein-friendly method and examined the effect of 4 parameters on the synthesis process, with the help of design of experiments software.
Chitosan is a linear polysaccharide composed of linked d-glucosamine and N-acetyl-d-glucosamine units distributed randomly (1–2–3–4). It has been considered as a suitable carrier in drug delivery systems because it is biocompatible, nontoxic, immunogenic to a low degree and biodegradable as well as having cationic properties (1–2–3).
Chitosan-based peptide release systems are rather interesting owing to some inherent advantages of this polymer, including solubility in weakly acidic solutions and lack of organic solvents. Chitosan carriers are favorable for maintaining the bioactivity of proteins (4), and protein stability will not be harmed because of nonacidic degradation products of chitosan. On the other, protection of embedded peptide against enzymatic attack can be achieved through restriction of penetration of proteases into the polymeric network (5).
Several chitosan particle preparation techniques exist, such as solvent evaporation, emulsion, ionotropic gelation, spray drying, reverse micellar, coacervation and sieving methods (6, 7). Among these methods, ionic gelation has attracted much attention for the purpose of protein delivery, in that this method is nontoxic, free from organic solvents, easily controllable, convenient, mild and in a sense protein friendly (8). With this method, ionic cross-linking of chitosan and an anionic cross-linker is feasible because of the cationic nature of chitosan. Fast interaction of amino groups of chitosan with negatively charged phosphates of tripolyphosphate (TPP) is plausible (9). Nanoparticle formation seems to be very sensitive to processing conditions. The most important parameters have been examined in different studies as listed in Table I.
Significant factors for formation of chitosan/TPP nanoparticles loaded with BSA protein, produced by the ionic gelation method
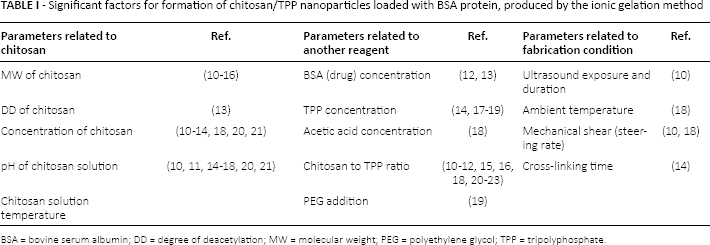
BSA = bovine serum albumin; DD = degree of deacetylation; MW = molecular weight; PEG = polyethylene glycol; TPP = tripolyphosphate.
Modeling by means of statistical experimental design has been applied to the parameters of synthesis of drug carriers successfully. Reduction of the number of experiments and efficient quantification of considered responses are some advantages of this strategy (24–25–26–27). A survey of the literature (Tab. I) reveals that less attention has been paid to mathematical modeling of different effective factors in nanoparticle synthesis simultaneously; while, current research in protein loading in chitosan/TPP nanoparticles will lead to a great demand for such models. Wen Fan et al (28) put their focus on many parameters, such as acetic acid, TPP and chitosan concentrations, chitosan solution and ambient temperatures, chitosan to TPP ratio and pH of chitosan solution. But they did not make the use of statistical modeling techniques, thus requiring unnecessary additional experiments. In a few investigations, design of experiment software has been used for optimization of chitosan nanoparticles/microparticles as drug carriers (17, 20), but they took fewer parameters and responses into account compared with the present study.
In this investigation, uppermost chitosan nanoparticle synthesis parameters are considered including chitosan concentration, bovine serum albumin (BSA) concentration, chitosan to TPP mass ratio and pH of chitosan solution, and their effects on size, polydispersity, zeta potential and encapsulation efficiency (EE) of protein-loaded particles are evaluated. Then responses were modeled mathematically using Central Composite Design in Design-Expert software, and optimization of preparation conditions of chitosan particle synthesis was performed to propose a desirable carrier for peptides.
Methods
Materials
Medium molecular weight chitosan (75%-85% deacetylated, 200-800 centipoise [cp]), sodium TPP, acetic acid and BSA were provided by Sigma-Aldrich.
Study Design
Design-Expert software (version 7.0.0; Stat-Ease Inc., Minneapolis, MN, USA) was selected to generate and evaluate the statistical experimental design. Central Composite Design was used to evaluate the effect of 4 factors on responses (Tab. II). In such a design, there exists a number of replicated center points and a set of points lying at the midpoint of each edge of the multidimensional cube defining the region of interest. Analysis of variance (ANOVA) was utilized to assess the significance and validity of the models.
Range of parameters used in Central Composite Design (as low, middle and high amounts) and measured responses (R1-R4)
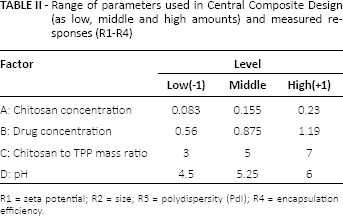
R1 = zeta potential; R2 = size; R3 = polydispersity (PdI); R4 = encapsulation efficiency.
Synthesis and drug loading of nanoparticles
The ionic gelation method was used for the purpose of nanoparticle production (29). Thirty chitosan solutions (Tab. III) were prepared at different concentrations in 0.5% (v/v) acetic acid aqueous solution at room temperature and stirred for 2 hours at high speed to obtain a clear dispersion. Determined weights of BSA were added to chitosan solution and stirred well. The pH of the solutions was adjusted according to experimental design, and then TPP solution (1 mg/mL) was added drop-wise to these solutions at different ratios of chitosan to TPP. These solutions were kept under constant magnetic stirring (300 rpm) for 15 minutes, while the solution temperature was kept at 60°C. All of the solutions were ultrasonicated for 2 minutes, and the nanoparticles formed were concentrated by centrifugation at 12,000 rpm on a 10-μL glycerol bed (15°C, 45 minutes) and resuspended in ultrapure water.
Design of 30 experiments by experimental design software
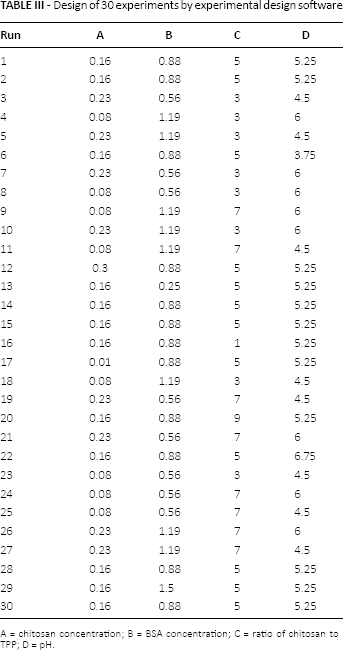
A = chitosan concentration; B = BSA concentration; C = ratio of chitosan to TPP; D = pH.
Size, polydispersity and zeta potential measurement
Hydrodynamic diameter, zeta potential and polydispersity (size distribution) of nanoparticles were measured using a Zetasizer (Nano ZS; Malvern Instruments, UK). The refractive index (1.333) and viscosity (0.887 centipoise [cP]) of water as a dispersion medium were used for setting the instrument. Nanoparticles were dispersed in 25°C medium.
Encapsulation efficiency and drug release measurement
EE was measured according to the following formula: EE (%) = [(total BSA amount − free BSA amount in supernatant)/(total BSA amount)] × 100.
First, supernatant was separated from suspensions of nanoparticles by ultracentrifugation at 20,000 rpm, for 20 minutes at 10°C (Sigma-3CK ultracentrifugation instrument). The amount of free BSA was determined in the supernatant by Bradford protein assay. The basis of this method is the formation of a complex between a dye (Brilliant Blue G) and proteins in solution, and the measuring of the absorption of protein–dye complexes at 595 nm. Absorbencies are linearly proportional to concentrations of protein samples and are compared with a standard curve.
In this study, the linear concentration range was 1-100 μg/mL of BSA protein. Concentrations were achieved following the measuring of absorbance by spectrophotometer (ELISA reader Gen 5, Powerwave XS2; Biotek, USA).
The release of BSA from nanoparticles was determined by incubating them in 1 mL of phosphate (pH 7.4) with shaking at 37°C. At proper time intervals (i.e., 1, 3, 6, 12, 24, 48, 96 and 192 hours), samples were ultracentrifuged, and 150 μL of the supernatant was taken out and replaced with fresh phosphate-buffered saline (PBS). The free BSA in the supernatant was determined by protein assay as described before.
Analysis of morphology
The shape, morphology and surface features of the nanoparticles were examined by field emission scanning electron microscopy (FE-SEM; Philips XL30; Philips, The Netherlands). A thin layer of 10 μL of nanoparticle suspension was poured onto a glass slide, and after complete drying, was mounted on an SEM stub and sputter-coated with gold in an argon atmosphere. The coated samples were then observed by FE-SEM.
Results
Morphology of nanoparticles
The morphology of nanoparticles, as depicted in FE-SEM images (Fig. 1), is almost smooth and spherical, which is in accordance with the results of a study by de Britto et al (30). In general, in this picture, spherical nanoparticles range from 22 to 120 nm. The majority of the nanoparticles have a size distribution less than 80 nm.
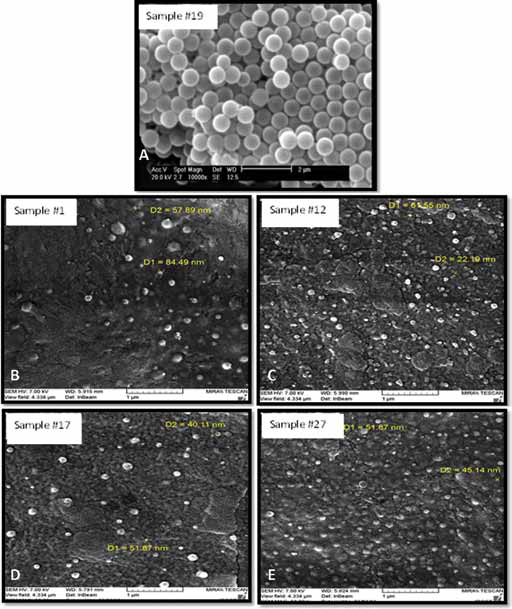
Field emission scanning electron microscopy (FE-SEM) images of some samples (among 30 samples) of chitosan nanoparticles loaded with bovine serum albumin (BSA). At top: SEM from sample number 19 (0.23% chitosan, 0.56% BSA, chitosan to tripolyphosphate (TPP) ratio 7 and pH 4.5). At bottom: FE-SEM images of samples 1, 12, 17 (0.88% BSA, pH 5.25 and chitosan to TPP ratio 5; concentration of chitosan 0.16, 0.3 and 0.01, respectively) and 27 (0.23% chitosan, 1.19% BSA, chitosan to TPP ratio 7 and pH 4).
Obtaining models of the effect of desired parameters on responses
Response surface 3D models for each parameter were obtained (Fig. 2). The mathematical formula for each model was developed. In our study, the hydrodynamic diameters of nanoparticles were in the range of 80 to 800 nm. A linear model was fitted to this response using experimental design expert software. According to this model the following equation was obtained representing the quantitative effect of 4 variables on the size of nanoparticles.
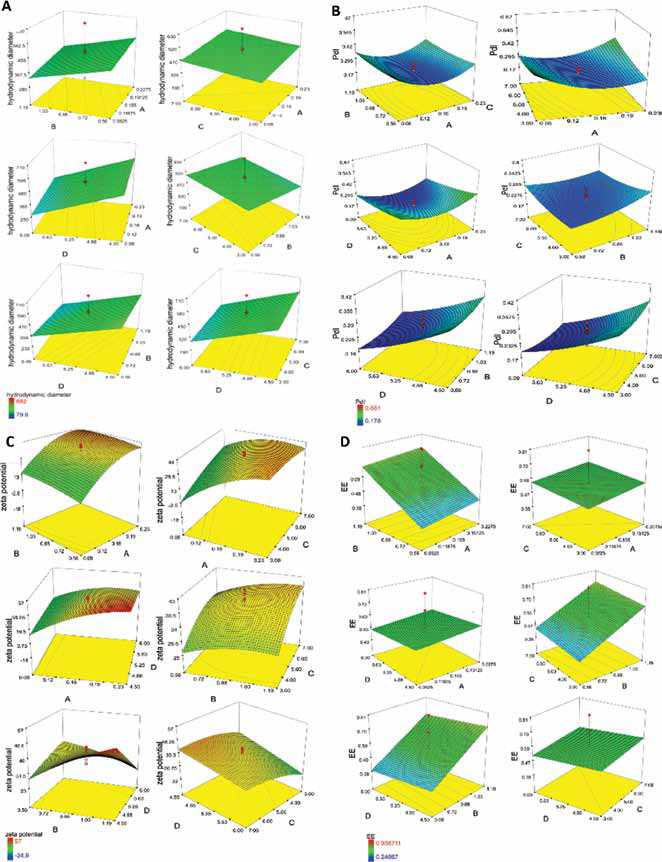
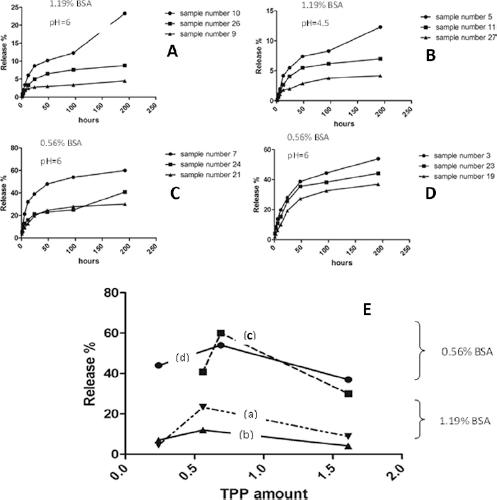
Response surface 3D models displaying effect of parameters on chitosan concentration (A), bovine serum albumin (BSA) concentration (B) chitosan to tripolyphosphate (TPP) mass ratio (C) and pH (D) on (

Nanoparticle size distribution ranged from 0.178 to 0.661. In this case, a quadratic model was chosen for this response as follows:
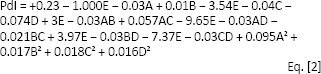
In this survey, the majority of formulations of nanoparticles had positive zeta potentials (in the range of +30 to +57 mV). In our study, a quadratic model was chosen for the zeta potential data:
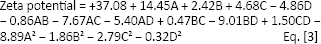
Regarding the effect of pH on encapsulation, it is evidenced in Figure 2 that this effect is minimal, and only a small decrease in encapsulation was observed with amelioration of pH. The effect of the chitosan TPP mass ratio on encapsulation of protein was studied, and the results are also presented in Figure 2. Additionally, the effect of chitosan to TPP ratio on release behavior is presented in Figure 3. A linear model was used for this response as below:
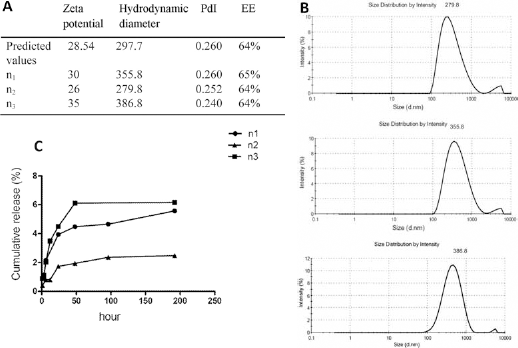
Release profiles of some samples (numbers 3, 5, 7, 9, 10, 11, 19, 21, 23, 24, 26 and 27) based on the chitosan to tripolyphosphate (TPP) mass ratio (

Optimization and evaluation of model validity
Summary of ANOVA of the responses are presented in Table IV and the validity of models was investigated. Optimization was done by applying constraints according to Table V on all responses. The formulation with the higher percentage of desirability was chosen as optimum. To determine the validity of the hypothesized models, nanoparticles were prepared according to the optimized conditions and characterized (see Fig. 4). The predicted values were inside the 95% confidence interval for all responses, which was calculated utilizing the mean and the standard deviation obtained from replicates (n1-n3) of the optimal formulation, demonstrating the validity and predictive ability of the applied model.
Summary of ANOVA for responses of zeta potential, size, PdI andencapsulation efficiency
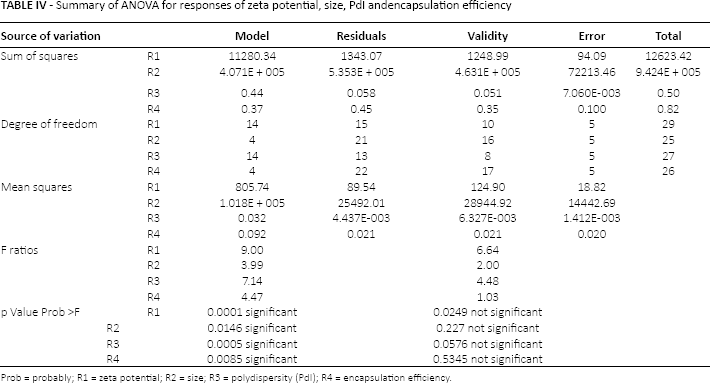
Prob = probably; R1 = zeta potential; R2 = size; R3 = polydispersity (PdI); R4 = encapsulation efficiency.
Constraints for optimization of nanoparticle characteristics as a suitable protein delivery
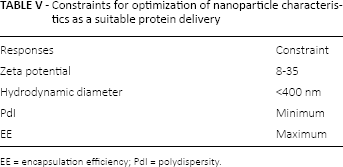
EE = encapsulation efficiency; PdI = polydispersity.
(
Discussion
Effect of test parameters on size
Sustainable protein release from polymeric nanoparticles is totally dependent on designing a suitable carrier for proteins, as was achieved in this study. Considering more important factors such as the size of nanoparticles, polydispersity, zeta potential and EE of the carrier is necessary for designing such a protein delivery system made from chitosan. It is important to consider the reality that the size of the nanoparticles are smaller in the FE-SEM micrographs than on dynamic light scattering (DLS) results because the latter measures the hydrodynamic diameter. Another reason is the ability of chitosan to swell in contact with water, which is the dispersant phase in DLS experiments (31).
Particle size is of utmost significance in drug delivery systems (32) because it affects particle uptake remarkably. A study reported that uptake of 100-nm nanoparticles in Caco-2 cells was 2.5 times greater than that for 1-μm microparticles, and 6 times greater than for 10-μm microparticles; likewise, uptake of nanoparticles in the gastrointestinal track of rats was observed to be between 15 and 250 times more than that for microparticles (33, 34).
The initial sizes of nanoparticles rely on many factors including preparation (ultrasonic yield power, time of ultrasonic radiation and stirring speed) and solution temperature, chitosan concentration, pH of the solution, loaded drug concentration, chitosan to TPP ratios and so on. Some of these factors were considered in previous works (10).
In this study, the effect of chitosan concentration on particle size, with results that were similar to those of other studies (8, 10, 20, 22, 35), stems from the phenomenon that chitosan molecules have ele ctrostatic repulsion in acidic solutions since amino groups of chitosan are protonated in such solutions; additionally, hydrogen-bonding interactions exist which induce and attractive forces. These 2 opposite forces are in equilibriumin a particular concentration. Increasing the chitosan concentration makes molecules closer to each other, leading to an increase of intermolecular cross-linking. If this concentration exceeds a certain limit, attractive forces overcome repulsive ones, and flocculation of nanoparticles will occur. Besides, when chitosan concentration rises, TPP molecules can become entangled with more chitosan molecules, making the nanoparticles larger. However, Figure 2 shows that the effect of chitosan concentration on particle size is not very powerful. Comparing sample 19 with sample 27 in this figure confirms that if other parameters are constant, the effect of BSA concentration on particle size is significant.
Gan et al (11) also suggested that a linear relationship exists between chitosan concentration and size of final particles. With increasing chitosan to TPP mass ratio, we expected that the size would increase gradually, as was reported in related studies (8) and confirmed by us in Figure 2. The reason is that when this ratio increases, repulsive forces between NH3+ sites get on the top of overcome attractive cation-anion forces. In conclusion, nanoparticles form loosely, and these are bigger, while with greater volumes of TPP cause more crosslinking and more compact particles which are smaller than previous particles (36). In experiments by Bulmer et al (20), chitosan to TPP mass ratios as high as 6:1 and 7:1 led to the formation of unstable aggregates. Seemingly, if TPP volume increases more than a certain limit, excess TPP will lead to the formation of cross-links between chitosan nanoparticles and may form aggregates as depicted in Figure 5.
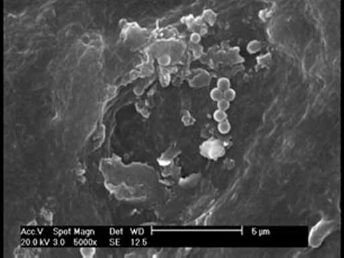
Field emission scanning electron microscopy (FE-SEM) image of sample number 16 (chitosan concentration of 0.16, bovine serum albumin (BSA) concentration of 0.88, chitosan to TPP ratio of 1 and pH 5.25). This sample had the greatest amount of tripolyphosphate (TPP), and in it, agglomeration has taken place.
The results showed that with increasing BSA concentration, size tended to decrease (compare samples number 19 and 27 in Fig. 2), since BSA is a negatively charged molecule which is able to cross-link with chitosan and produce more compact and smaller nanoparticles as suggested by a study by Zhang et al (37) and as shown in Figure 2. Additionally, size may be reduced with higher pH.
Effect of test parameters on polydispersity
Polydispersity is another important factor in protein delivery systems. Achieving minimum polydispersity is important to keep the drug release rate constant and controllable, whereas in the case of chitosan, it is not easy to achieve a narrow distribution, because chitosan per se has a wide distribution of low, medium and high molecular weight chains.
The formula developed in this study demonstrated that increasing chitosan concentration does not affect polydispersity greatly. In an experiment by Tsai et al (10), decreasing chitosan concentration reduced polydispersity, while in our experiments, this trend was obvious when chitosan to TPP mass ratio was equal to 3.
It seems that particle size distribution increases linearly with rising chitosan to TPP mass ratio, as was suggested by Bulmer et al (20). As we show in Figure 2, this trend was reversed at high BSA concentration and low pH.
Effect of test parameters on zeta potential
Zeta potential is identified as the difference in electrical potential between boundaries of a double layer. A double layer is the area around a particle when it is in an aqueous solution. The outer layer consists of free ions, while ions are strongly bonded to the surface of a particle in the inner layer moving with the movement of particle in the solution. Therefore, the inner layer defines the particle charge.
Zeta potential determines the stability of colloidal systems, and a solution with zeta potential greater than ± 20 mV is regarded as stable (30). High zeta potential is favorable for controlling the rate of drug release. Furthermore, knowing the particle surface charge is important because degradation of nanoparticles as a result of their interaction with lysozymes, which is crucial in drug delivery, is dependent on the surface charge. The high zeta potential and subsequently stronger electrostatic interactions between the nanoparticles and cells may also destabilize the cell membrane and lead to the escape of nanoparticles into cytoplasmic compartments (11). In effect, particles of high positive charge permeate better (23). Although, it should be noticed that positive zeta potential is toxic for cells, and a zeta potential of around +30 is more suitable for drug delivery with less cytotoxicity (38).
In an investigation by Grenha et al (22), the zeta potential mainly increased with increasing chitosan concentration. This present study confirmed the results of Grenha et al, but it is in contrast with those of studies by Bulmer et al (20) and Gan and Wang (12). In some studies (20, 30), the zeta potential increased when the ratio of chitosan to TPP improved, because at low ratios of chitosan to TPP (higher amounts of TPP), the protonated amino groups were neutralized via TPP anions (8).
BSA loading unexpectedly seems to have an insignificant effect on zeta potential as shown in Figure 2 and confirmed by some authors (12, 35). Formation of hydrogen bonds between carboxyl groups on the surface of the protein molecule and amine groups of chitosan takes place; however, the surface charge of chitosan molecules is positive since a high proportion of the amine group on the chitosan chain is still unoccupied. Deprotonation of nanoparticles resulting in a decrease in zeta potential may happen with higher pH values (11, 20, 39). But from Figure 2, it is obvious that this trend will be reversed at higher concentrations of BSA.
BSA loading unexpectedly seems to have a nonsignificant effect on zeta potential (12, 35) as is also shown in Figure 2.
Effect of test parameters on EE
For the purpose of loading drugs into nanoparticles there exist 2 general methods: incorporation and incubation (6). With incorporation methodology, the charge is carried during the particles’ preparation process – for example, dissolving or dispersing of the drug into the polymer solution to be entrapped into the polymer matrix physically. In incubation, on the other hand, the charge is carried by the formed particles (e.g., by adsorption of the drug on the particle surface and subsequent penetration into the matrix structure). In this present study, BSA molecules were added before addition of TPP, so they were incorporated into the chitosan matrix.
Protein is generally expensive, and therefore, the ability of a nanoparticle to retain the protein during multiple manufacturing steps is an important characteristic of a carrier determined as encapsulation efficient (17). The higher the encapsulation potential, the better the drug carrier is.
In this study, chitosan concentration did not alter EE. In similar works, it was shown that higher chitosan concentration might contribute to higher EE (3), which was attributed to the formation mechanism of chitosan/TPP nanoparticles, because with increasing chitosan concentration, the greater the number of BSA molecules – which are negatively charged owing to being above their isoelectric point of 4.5-4.8 – that interact with chitosan. In some cases, it has been observed that the EE of BSA in nanoparticles gradually decreases with increasing chitosan concentration. The reason for this is that in this manner fewer nanoparticles are formed following the increase of solution viscosity leading to a deterring of movement of BSA molecule around the chitosan molecular chain and subsequent agglomeration of nanoparticles (35).
It is given that an increase of BSA concentration will increase EE (12). With increasing BSA concentration the protein adsorb to the surface of nanoparticles and attachment between protein and nanoparticle take place which cause high encapsuation. These findings are not analogous with those of some other studies (13), in which contrasting results regarding BSA encapsulation at pH 6.0 have been reported.
Regarding the pH effect on encapsulation, it is evidenced in Figure 2 that this effect is minimal, and only a small decrease in encapsulation was observed with amelioration of pH. The reason for this might be the deprotonation of chitosan at higher pH, which results in fewer ionic interactions with negative BSA molecules. Loss of charge density may, however, lead to a no reduction of crosslinking density leads the gelation process to become slow, as a result, porosity increase of the gel structure and enabling more molecules to leach out from nanoparticles. Statistical analysis and a quadratic model were suggested in a study (17) which showed the effect of pH and TPP concentrations on encapsulation of lipase and that pH effect is not considerable.
Conclusion
In this study, we elucidated the influence of 4 process parameters on characteristics of chitosan nanoparticles produced by the ionic gelation method. The studied parameters included chitosan concentration, chitosan to TPP mass ratio, pH of solution and amount of BSA as a model protein. The size, polydispersity, zeta potential of nanoparticles and EE of BSA loaded into nanoparticles were assessed. The design of experiments was performed at 3 levels with Central Composite Design. A linear model was fitted to size data. It showed that pH was the most effective parameter in determining the size of particles. BSA concentration was inversely proportional to the size. For polydispersity and zeta potential data, a quadratic model was suitable. Analysis of carriers’ EE showed that this parameter followed a linear mathematical model. Also, the release of protein from these particles was measured, and it was shown that increasing loaded BSA concentration caused a decreasing release rate. Results of FE-SEM showed that the morphology of nanoparticles was totally smooth and spherical.
The significance of the models was confirmed by ANOVA results. Finally, optimization of formulations was performed according to considered constraints. However, the predicted optimal point was within the 95% confidence interval of observed values for each response, confirming the predictability of the models. Therefore, changing the constraints can lead to different solutions depending on the desired application.
This research will provide valuable basic information for researchers in the field of protein loading into TPP cross-linked chitosan nanoparticles. This will reduce the number of unnecessary experiments in future studies, since this enables researchers to predict the effect of different preparation conditions and different parameters on desired responses.
Footnotes
Acknowledgement
The authors thank all staff members of the Biomedical Engineering Department of Amirkabir University of Technology. Special thanks to the cardiologists of Dr. Ahmadi Tafti's team in the Tehran Heart Center, Iran.
Financial support: This study was supported by the Vice-Presidency for Innovation and Technology, Presidency of the Islamic Republic of Iran.
Conflict of interest: None of the authors has any financial interest related to this study to disclose.