
Abstract
Background
Existing studies have included little discussion of anisotropic and material non linearity of muscle tissue, and fiber orientation–based material properties of skeletal muscle tissue are not reported well in literature. There has been some dispute about material response of muscle in different fiber directions. It is necessary to have a better understanding of fiber orientation based material properties of skeletal muscle, to ensure the accuracy of computational models of muscle. To this end, the aim of this study was to investigate fiber orientation–based material properties in vitro and simulate them with finite element analysis (FEA).
Methods
Tensile testing was performed on 5 samples of skeletal muscle from a goat at a strain rate of 0.15 s−1 with fiber orientation along the length (P) and 45° incline to the fiber direction (I). FEA was completed using the experimental condition to validate the results of the in vitro test. The cross-fiber direction was simulated using FEA.
Results
The stresses for all fiber directions at maximum stretch were 1,973.2 kPa for fiber direction P, 1,172 kPa for direction I and 430 kPa for the cross-fiber direction. The tensile strengths of the skeletal muscle were 0.44 MPa for P and 0.234 MPa for I. The elastic modulus of muscle tissue in all fiber directions was 1.59 MPa for fiber direction P (Ep), 0.621 MPa for 45° direction I (EI) and 0.43 MPa for the cross-fiber direction (Ec). The displacement of the muscle sample against the maximum load was small along the fiber direction. The results of the present study showed that muscle tissue was stiffer in the fiber direction than in the cross-fiber direction.
Conclusions
The stiffness of skeletal muscle is changed as the fiber orientation of skeletal muscle tissue changed.
Introduction
The composition of skeletal muscle includes about 70%-80% water, 10%-12% collagen and 3% fat (1). A muscle fiber is a small cylinder-shaped muscle cell. Skeletal muscle is a bundle of such muscle fibers, covered by connective tissue (2). The whole muscle is enveloped by connective tissue called the epimysium. The connective tissue which envelops the whole muscle and is located over the layer of epimysium is called the fascia (2). The connective tissue which surrounds a bundle of muscle fibers is called the perimysium. Endomysium is the connective tissue which is wrapped around a single muscle fiber (2). This shows that the muscles are composed of oriented fibers to perform their basic function of force generation. Skeletal muscle is the biological soft tissue which presents viscoelastic and anisotropic behavior (3-4-5-6-7-8).
Mechanical characterization of soft tissue by the in vitro method is very difficult because of its anisotropic, hyperelastic, viscoelastic and highly nonlinear elastic behavior (9, 10). It is essential to compute the mechanical characteristics of skeletal muscle for the development of bioengineering and tissue engineering. It may also improve the understanding of how various conditions affect the performance of muscle (11-12-13). It will help to develop the biomimetic materials and advance the clinical evaluation of muscle as well. In vivo measurement of muscle force and tissue load displacement is not possible (14, 15). In contrast, advancement in computational models of skeletal muscle has been made, from the basic Hill-type muscle model to 3-dimensional (3D) constitutive muscle models to predict these parameters, and these hold significant promise in advancing health care (6, 16, 17). Finite element models of the human body may be used to study deformations in static and dynamic loading (18). To do so, these models require well-defined material properties of soft tissue and hard tissue under large deformations. The potential values of the hyperelastic and anisotropic behavior of muscle tissue have not been well-defined experimentally, this imposes a limitation for computational models of skeletal muscle (6). Skeletal muscle tissue contributes half of the body weight; hence well-defined properties of skeletal muscle tissue are required for many constitutive models of skeletal muscle and for understanding the musculoskeletal system in diverse applications (6, 19).
Some investigators have characterized muscle with regard to fiber direction, whereas transversely isotropic behavior has to be characterized by testing the soft tissue with regard to fiber direction (longitudinal extension) and cross-fiber direction (transverse extension) (6-7-8, 15, 17, 20). On the other hand, few authors have measured the stress-strain characteristics of muscle across the entire musculotendinous unit; their results could not isolate the properties of muscle tissue itself (21-22-23).
Van Loocke et al characterized the passive compressive behavior of skeletal muscle for dynamic loading (24-25-26). A promising viscoelastic response was observed, along with significant muscle tissue anisotropy. It was found that muscle shows its stiffest response in the cross-fiber direction compared with the fiber direction under compression at a strain rate of 0.05 s−1 (5, 6, 21, 27). Skeletal muscle also shows a nonlinear and viscoelastic response to tensile loading (3, 4, 9, 28-29-30-31-32). The transversely isotropic behavior of skeletal muscle has been determined experimentally for tensile loading, and the studies involved have reported that muscle is stiffer in the fiber direction as compared with the transverse direction (3, 4, 12, 19, 27). Some authors, on the basis of tensile loading, have concluded that muscle is stiffer in the transverse direction than in the fiber direction during experiments for tensile loading (6, 27, 28). The stress-stretch response of muscle is dependent on the fiber orientation in relation to direction of loading (Fig. 1). Hernández et al did not measure fiber direction, hence their results were not comparable to the present study (33). Takaza et al studied the tensile response of muscle at intermediate angles of fiber orientation. Their results showed that muscle was stiffer in the transverse direction than in the fiber direction, but the results from study of Morrow et al indicated the opposite (4, 12, 19, 27) (Fig. 1).
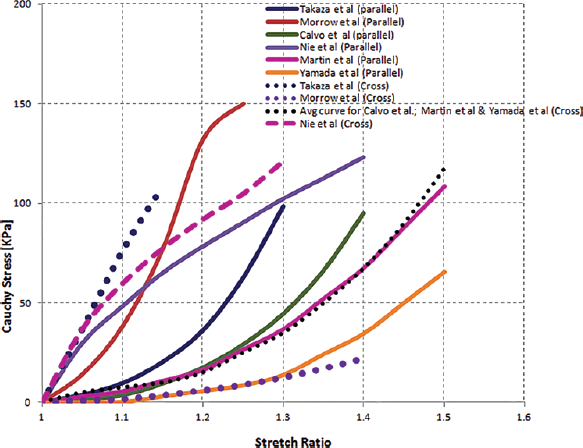
Tensile response of skeletal muscle from literature.
It is safe to state that there is a disparity in the understanding of the tensile response of passive muscle tissue at different fiber orientations. Thus, the aim of this paper was to characterize the tensile response of passive muscle with different fiber orientations. Our research objectives are (i) to determine the fiber-oriented tensile response of skeletal muscle, (ii) to simulate test responses using finite element analysis (FEA) for different fiber orientations and (iii) to compare the in vitro test results with the FEA results.
Methods
Specimen preparation
Fresh skeletal muscle tissue was harvested from a male goat aged 2 years. The study protocol was approved by the local ethics committee of the Central India Medical Research Ethics Committee (CIIE), India. Samples of skeletal muscle tissue for tensile test were prepared as per the specification of tensile test standard ASTM E8/E8M. Samples with an approximate cross-section of 10 × 10 mm were prepared for tensile testing according to the tensile standard. It was difficult to prepare the sample to the exact dimension as per the standard specification because of limited availability of muscle tissue with the correct fiber orientation. Samples were prepared and categorized into 2 categories as per fiber orientation with respect to the length: a set of 5 samples with fiber orientation in the direction of the length while the other set was about the same sample size with fiber orientation 45° incline to the length (Fig. 2 and Tab. I). The static strain rate of 0.15 s−1 was maintained to account the sample length variability. The width and thickness variability was not considered due to little variation because of the maneuverability of the fresh extracted skeletal muscle tissue, and this could be a limitation of the study. Samples with fiber orientation 90° incline to the length were difficult to extract due unavailability of the required tissue with correct fiber orientation. Tensile test was performed on only 2 sample sets using an Instron 3345 (Instron) biomaterials tensile test machine with a 5-kN load cell. All of the tests were performed well within 2 hours after the animal's death, to optimize the effect of rigor mortis on the results (6, 18). All of the samples were preserved in buffer saline solution. Bio grips with grated faces were used to clamp the sample; these give the best grip and minimize the effect of slippage and initial stress on the results.
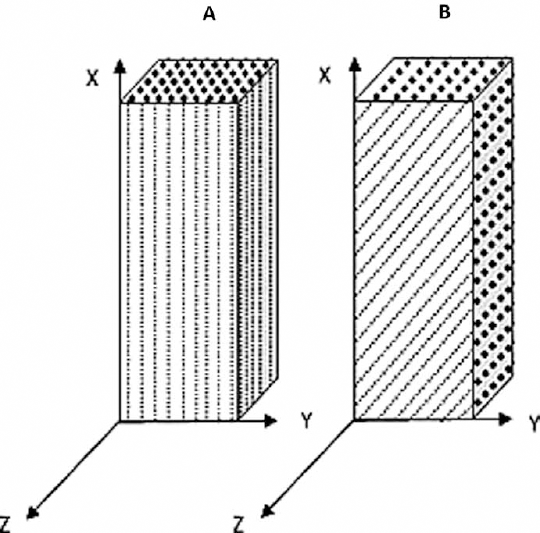
Specimens with different fiber orientations, as used in study. Fiber orientation parallel to the length (
Experimental test sample specifications
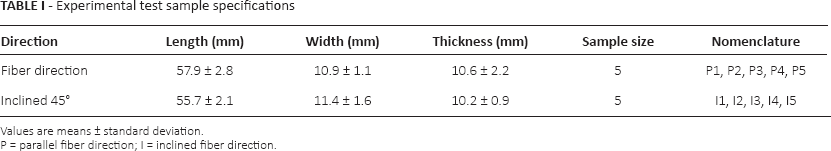
Values are means ± standard deviation.
P = parallel fiber direction; I = inclined fiber direction.
Experimentation
Samples of skeletal muscle tissue were divided into 2 sets, labeled as P (fiber orientation along the length) and I (fiber orientation 45° incline to length). The samples were clamped between the crossheads on the test machine using granular rubber grips with 250-N grip force. Overtightening was avoided at the grips of the sample, which helped to minimize the undesired instigation of stresses. The samples were removed from buffer saline solution just before the start of the test. The solution was continuously irrigated on the sample during the test to avoid tissue desiccation. The samples were tested with the use of the automated tensile test machine. Load–displacement (stress-strain) data were recorded by the computer-interfaced test machine. The test temperature was maintained between 18° to 30°C with humidity at 60%. Samples were loaded at a strain rate of 0.15 s−1. After a preload of 0.5 N, the test was completed when the muscle was either stretched to 1.4 times or failed, whichever occurred first. The finite element method was used for the validation of experimental results.
Finite element analysis
Skeletal muscle tissue is nearly incompressible in nature. The constraint applied to the FEA model of muscle tissue was incompressibility. To satisfy the incompressibility condition in FEA, Poisson's ratio was assumed as 0.499 (6). For hyperelastic incompressible materials, a mixed displacement-pressure condition was used in the Ansys element description. In this condition, the pressure was a new degree of freedom (DOF) for the mesh element. To balance this DOF, strain energy density must be additional, and resulting volume changes were used to compute the pressure. In the present study, experimental results were simulated using FEA. FEA was performed on the model of skeletal muscle of the dimensions similar to that of experimental specimen. The hyperelastic behavior of skeletal muscle tissue was simulated using the finite element method in Ansys, version 14.5 (Ansys Inc.). FEA was performed with the distinct material parameters as per their fiber direction
Geometry
It was reported in literature that a skeletal muscle model should be consistent with experimental evidence, and the constitutive law depends on the direction of family of fibers at muscle tissue (34, 35). Therefore, the geometry for skeletal muscle tissue was modeled as per the dimensions of the experimental specimen (10 × 10 × 55 mm) with different fiber directions. The skeletal muscle tissue specimen used for the in vitro test was the single fiber orientation. Therefore, 3 finite element models were created with fiber orientations along the length (longitudinal fiber direction), 45° incline to the length and perpendicular to the length (cross-fiber direction).
Material
The material behavior was considered as hyperelastic for FEA of skeletal muscle tissue. The Mooney Rivlin 5 parameter model was used for specifying the hyperelasticity of skeletal muscle tissue for each case. To incorporate the incompressibility condition, Poisson's ratio was considered as 0.499, and the compressibility parameter was taken as 0. For all fiber directions, this study used different hyperelastic material parameters, which are derived using curve fitting in Ansys 14.5 from the experimental curves found in the literature (4), as shown in Table II.
Material parameters for skeletal muscle (stress-strain response curve from ref. 4)
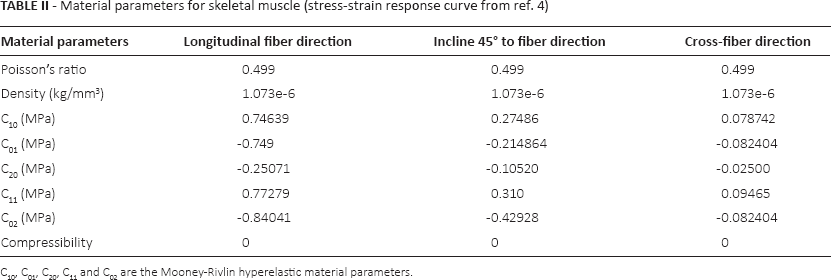
C10, C01, C20, C11 and C02 are the Mooney-Rivlin hyperelastic material parameters.
Meshing
For the hyperelastic behavior of skeletal muscle tissue with incompressibility and distinct fiber orientations, the element used for meshing was Solid 185 in Ansys software. Solid 185 was used for 3D modeling of solid structures. It was 8 node solid mesh element with 3 translational DOFs in the x, y and z directions at each node (36). This element has the capabilities of hyperelasticity, large deformation, large strain, stress stiffening, creep and plasticity (36). It also includes a mixed formulation to simulate the deformations of incompressible elastoplastic and hyperelastic material (36). The model was discretized into small elements using Solid 8 node brick element – i.e., Solid 185 using the volume mapped mesh.
Boundary conditions and convergence conditions
To simulate the hyperelastic material behavior of skeletal muscle, boundary conditions (constraints) were applied. All DOFs at 1 end were set to zero, while the opposite end was subjected to a tensile load of 110 N (Fig. 3). For nonlinear analysis, large deformation was active and elastic modulus was kept to zero for convergence. For nonlinear material behavior, some solution controls were provided. To get the solution, the numbers of substeps were set to 100, the maximum number of substeps was 1,000 and the minimum substeps were 10 in order to increase the load in steps. Once all controls were set, the problem was solved to get the deformation and stress-strain on the skeletal tissue of the given load in a given direction of fiber orientation.
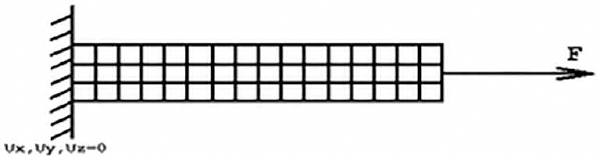
Boundary conditions for finite element analysis. F = force; Ux, Uy and Uz = displacement in x, y and z direction.
Results
Figure 4 shows the stress-stretch response of the set of samples with fiber orientation along the length. Each curve represents the stress-stretch response of an individual sample. Figure 5 shows the stress-stretch response of the set of samples with fiber orientation of 45° incline to the length; each curve represents the data set of 1 test sample. The resulting average stress-stretch variations of recorded data obtained by Instron machine (Instron) and FEA for different fiber orientations are shown in Figure 6. Figure 6A presents the average stress-stretch response result of muscle under tensile loading by experimentation and FEA in the fiber direction along the length or parallel to the length of the sample. The average of stress-stretch variation of test and FEA simulation data for the fiber orientation 45° incline to the sample length are illustrated in Figure 6B. The tensile response in terms of stress-stretch for the cross-fiber direction is drawn from the results of FEA (Fig. 7). Figure 7 also shows the behavior of muscle tissue with different fiber orientations in terms of stress with respect to stretch, each curve shows the average value for each fiber direction. Table III shows the summarized details of all fiber directions from the tests and FEA, with mean and standard deviation. It provides the summarized details about the deformation at maximum load, tensile strength and elastic modulus of muscle tissue in all fiber directions. Figure 8 shows the deformation of muscle tissue simulated by FEA and gives additional information about the deforming behavior of muscle tissue based on fiber orientation.
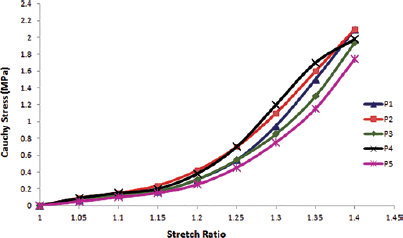
In vitro tensile response of a set of muscle tissue samples with fiber orientation along the length.
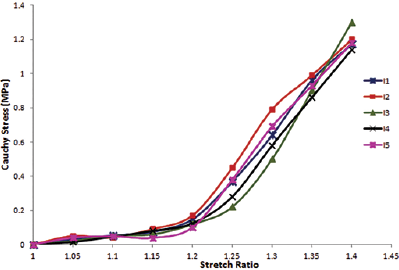
In vitro tensile response of a set of muscle tissue samples with fiber orientation 45° incline to the length.
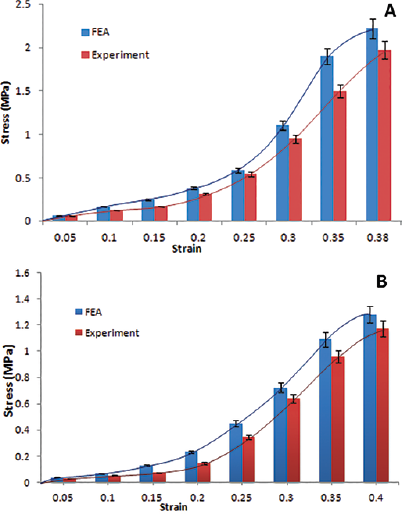
The sample's average stress-stretch response to tensile loading: (
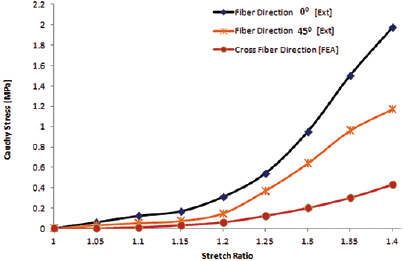
The stress-stretch response of muscle tissue in all fiber directions in tension. Ext = experimental; FEA = finite element analysis.
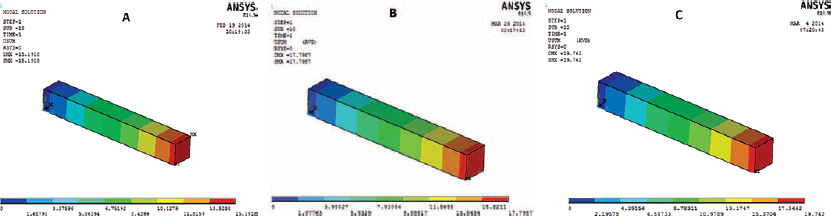
Deformation with different orientations of the muscle fibers within the muscle tissue: (
Mechanical characteristics of skeletal muscle
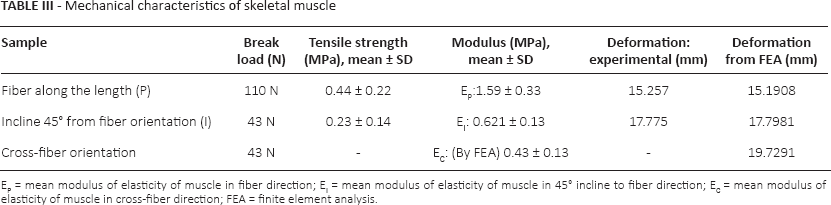
EP = mean modulus of elasticity of muscle in fiber direction; EI = mean modulus of elasticity of muscle in 45° incline to fiber direction; EC = mean modulus of elasticity of muscle in cross-fiber direction; FEA = finite element analysis.
Discussion
It is necessary to consider the following factors before commenting on the significant outcome of the test and FEA results, and its comparison with existing research data.
Factors affecting test results
The sample length to width ratio is the most important parameter in the tensile test to reduce the effect of gripping stress on the region of interest (6). According to the ASTM E8 standard, the length required should be more than 5 times the width for rectangular specimens (6). In this study, all of the sample dimensions conformed to the standard perfectly well. It has been reported that a sample thickness less than 6 mm has a direct influence on the tensile response, due to the reduction of complete muscle fascicles (6, 37, 38). Width-to-thickness variability was not considered in this study, but still the length to width ratio was kept closer to the recommended ASTM E8 standard, and thickness of all samples was greater than 6 mm. A slight variation in the dimensional ratio has no significant difference on the results compared with those that met the ASTM E8 standard, and this has been already reported (39).
As width-to-thickness variability was not considered in this study, there was a chance of slippage of the sample during the test. The grips were strong enough to clamp the sample by producing enough grip force without overtightening, also there was no slippage of the sample, because the sample dimensional ratios were very close to the recommended standard. FEA was used to validate the test results under the actual test conditions. It gave qualitative and quantitative results which can be visualized as well.
The testing window was 2 hours after animal death before rigor mortis starts influencing the passive response of muscle tissue (6, 25). It has been found that frozen samples also influence the stiffness of muscle during its passive response (6, 27). Thus, this study was performed on the samples within 2 hours of animal death to avoid the stiffening of tissue due to rigor mortis. Nie et al stated that the fiber response profile in their test was unusual in the toe region of stress-stretch, and increasing stiffness was not observed and remained unclear for use of different sample dimensional ratios, and this can also contribute to the differences (6, 28).
If preloading is not applied to the sample before the start of the test, the sample may be subjected to unavoidable compressive forces resulting in poor test data (6). Hence, preload (0.5 N, which is less than 5% of maximum test load) is used to straighten muscle fibers in the samples without stretching or damaging to eliminate compressive forces. Furthermore, if the preload is greater, it may damage or cause prestress conditions in the test results which are not acceptable. The environmental conditions may cause the difference between physiological length and the length of harvested muscle tissue (6, 28, 33). Physiological length was achieved using the preload condition.
Interpretation of results
The stress-stretch variations in the fiber direction (P), cross-fiber and 45° fiber direction (I) tests are illustrated in Figures 4 to 7. The sample stress-stretch variations of test results for fiber direction (P) showed the following small variations: 2.09% at λ = 1.1, 6.63% at λ = 1.2, 18.23% at λ = 1.3 and 14.80% at λ = 1.4 (Fig. 4). On the other hand, variations in the sample stress-stretch of test results for the 45° fiber direction (I) were: 1.9% at λ = 1.1, 2.72% at λ = 1.2, 10.97% at λ = 1.3 and 6.07% at λ = 1.4 (Fig. 5). All of the samples were harvested from a single animal, so observed variations were small. Even the variations in stress (percentage of mean stress) within samples of corresponding fiber directions as a function of applied stretch (Figs. 4 and 5) were of lower magnitude. This is assumed to be due to the muscle fiber's ability to transmit force to the surrounding muscle fibers. Figure 6A shows the resulting average stress-stretch response data from the test as well as FEA for the fiber direction; the nonlinear increase in stiffness with stretch is observed. The average stress-stretch variation from the test and FEA data is illustrated in Figure 6B for the 45° fiber direction, which shows the nonlinear increase in the stress with respect to the stretch ratio (λ) but smaller than the fiber direction. The stress-stretch responses of muscle tissue for all of the fiber orientations are illustrated in Figure 7, showing the resulting average of stress-stretch response in particular fiber direction for better understanding. The results clearly show the influence of fiber orientation in muscle tissue on the stress-stretch response in tensile loading, with fiber direction as significantly stiffer than the cross-fiber direction. Experimental results report that the fiber direction (P) elongation is 15.257 mm at the load of 110 N and elongation in 45° fiber direction (I) is 17.775 mm at the maximum load of 43 N (Tab. III). The deformation results of FEA for all the fiber orientations were 15.1908 mm, 17.7981 mm and 19.7291 mm, as shown in Figure 8. Figure 6 also shows that the results of the experiment and FEA are in good agreement. The failure was observed as a separation of muscle fibers within muscle tissue. The tensile strength is higher in longitudinal elongation (0.43 MPa) compared with that of in cross-fiber elongation (0.23 MPa). The resulting linear modulus of longitudinal and cross-fiber elongation tests (1.53 MPa and 0.43 MPa) was higher than that reported by Morrow et al (3, 4), as shown in Table III. Figure 9 shows the 3D view plot, illustrating the variation of stress with stretch variation and also with muscle fiber orientation within the sample. Figures 7 and 9 and Table III show the change in stiffness with respect to fiber direction within muscle tissue. This gives a better acknowledgment of the effect of fiber orientation on the stiffness, strength and deformation of muscle tissue from the summarized results of the test and FEA. It can be seen that the fiber orientation response seems intuitive to the tensile loading.
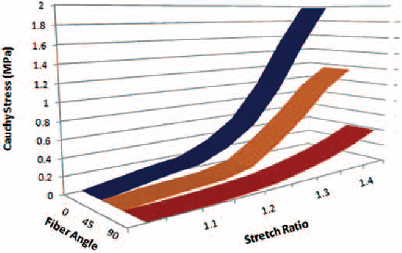
Three-dimensional view representing effect of stretch and fiber orientation on the stress in the tensile response of muscle tissue.
The stiffest direction was the fiber direction (P), which had high failure stress. It was found to be more than that observed by Takaza et al, Pietsch et al, Martins et al, Nie et al and Yamada et al (6, 7, 9, 28, 32). The cross-fiber direction was less stiff and had a lower stress at high stretch. In contrast, Takaza et al, Pietsch et al, Martins et al, Nie et al and Yamada et al reported that muscle tissue was stiffer in the cross-fiber direction than the fiber direction; this might be largely due to different experimental protocol used. The results of the present study were closer to the findings of Calvo et al (29), who used a lower strain rate of 0.025 s−1. Skeletal muscle is viscoelastic at a very low strain rate, which may account for the lower stiffness results (25), while the present study used a higher strain rate of 0.15 s−1. So there is variation in the values of stress, but both studies reached the same conclusion.
This investigation was performed on freshly harvested samples of well-defined geometric shape to facilitate stress calculations and tested well within the window of rigor mortis to avoid stiffening of tissue. The experimental conditions were simulated using FEA and validated the experimental results in comparison. The response of muscle tissue reported by Nie et al, Calvo et al and Takaza et al (6, 28, 29) was found to be unusual stress-strain curve shapes, and this may be attributed either to a very low strain rate or a very high strain rate, or because the samples were taken from different animals. Therefore a direct comparison of the present investigation with the results of existing studies is not possible. The limitation of the present study was that the cross-fiber direction was not tested directly, because of the unavailability of the samples closer to the recommended length in this fiber direction. In future, the tensile response of muscle tissue needs to be investigated at various strain rates for tissue samples from a particular animal to minimize the complexity in understanding the exact muscle response in all fiber directions. The results of the present research may provide the required parameters for a better solution of the finite element model of skeletal muscle of human body simulation in static and dynamic conditions.
Conclusions
The results of the present study are in good agreement with the majority of the studies of tensile response in the recent past. The results of the experiment and FEA were closely matched and proved the anisotropic behavior of skeletal muscle under tension. In the present study, the stress for all fiber directions at maximum stretch was 1,973.2 kPa for fiber direction (P), 1,172 kPa for 45° incline to fiber direction and 430 kPa for cross-fiber direction. The tensile strengths of the skeletal muscle were 0.44 MPa for the fiber direction (P) and 0.234 MPa for 45° incline to fiber direction (I). The elastic modulus of muscle tissue in all fiber directions was 1.59 MPa for fiber direction (Ep), 0.621 MPa for 45° incline to fiber direction (EI) and 0.43 MPa for cross-fiber direction (EC). The present study concluded that as the fiber orientation moves from 0° to 90° with respect to the length, modulus of elasticity and stiffness decrease.
Footnotes
Acknowledgement
The authors would like to thank the Sree Chitra Tirunal Institute for Medical Science and Technology, India, for their substantial support.
Financial support: This project was funded by the Department of Science and Technology of India (SERB/F/0892/2013-2014).
Conflict of interest: There are no conflicts of interest among authors and supporters.