
Abstract
Background
Gadolinium-doped ceria (GDC) is a promising alternative as a solid electrolyte for intermediate temperature solid oxide fuel cells (ITSOFCs) due to its low operating temperature and its high electrical conductivity. The traditional synthesis processes require extended time for powder preparation. Sol-gel methodology for electrolyte fabrication is more versatile and efficient.
Methods
In this work, nanocrystalline ceria powders, with 10 and 20 mol% of gadolinium (Ce0.9Gd0.1O1.95 and Ce0.8Gd0.2O1.9) were synthesized by a modified sol-gel technique, featuring a nitrate-fuel exothermic reaction. GDC tablets were prepared from powders and sintered at 1500°C with a dwell time of 3 hours. The sintered pellets’ microstructure (by SEM) and electrical conductivity (by EIS) were evaluated. The powder properties, such as crystalline structure (by XRD), thermal properties (TGA/DTA), particle size and morphology (TEM) and textural properties (BET method) were determined and, in addition, for the first time an accurate chemical structural evolution (FTIR) was studied.
Results
Sintered GDC0.8 samples exhibited the maximum theoretical density of 97% and an average grain size of 700 nm. The electrical conductivity vs. temperature showed values ranging from 1.9∙10−2 to 5.5∙10−2 S·cm−1 at 600°C and 800°C for GDC with 20 mol% of gadolinium.
Conclusions
The methodology investigated showed reduced reaction time, a better control of stoichiometry and low cost. Characterization results demonstrated that these materials can be applied in ITSOFCs due to high conductivity, even at 550°C-600°C. The increased conductivity is related to the improved mobility of gadolinium ions in a high-density structure, with nanometric grains.
Introduction
The use of rare earth metals, as dopant for ceramic electrolytes based on ceria, is a widely studied topic, to substitute common yttria-stabilized zirconia (YSZ) electrolytes for intermediate temperature solid oxide fuel cells (ITSOFCs) (1-2-3-4-5). The crystal structure of CeO2 is a fluorite type (space group – Fm3m, stoichiometry RX2), and it is unchanging up to 2400°C, which is its melting point.
Doping the crystalline structure of CeO2 with R3+ ions of rare earth metals (Gd3+, Sm3+, Nd3+, Y3+, Pr3+) causes a remarkable increase in ionic conductivity. This increment is ascribed to a modification in the crystalline lattice, represented by the increase of O2- vacancies, so that a large number of anion defects arises (6-7-8). Gadolinium ion, Gd3+, is the most extensively studied dopant for ceria in solid electrolytes application for SOFCs (9-10-11-12).
The traditional synthesis techniques for these materials has achieved excellent results, but an extended time for complete reaction is required (13-14-15-16-17). Furthermore, the performance of solid electrolytes can be affected by many factors such as doped composition material, thickness, microstructure and the temperature at which the electrolytes are to be used (18). The microstructure of a sintered material depends mainly on the synthesis methods and conditions used (19). From this point of view, liquid phase syntheses, such as hydrothermal synthesis (20-21-22-23), sol-gel (24-25-26-27) and combustion synthesis (28-29-30) are very interesting for realizing nanosized powders. Synthesis procedures play a critical role in the final particle size (31) and consequently have an influence on the microstructure of the electrolyte as well as the ionic conduction mechanism (18). These considerations in mind, increasing interest has been directed toward a very promising way for fabricating materials and components, based on a sol-gel combustion process. The advantages of sol-gel procedure are simple preparation, high energy efficiency, short time-to-product, low processing cost and the possibility of reducing the operating temperature and preparing different types of materials (32-33-34). The absence of coprecipitates after synthesis favors the formation of homogenous powders with high specific surface and small particles easily sinterable. In this work, a modified combustion sol-gel preparation was investigated to prepare gadolinium-doped ceria (GDC) nanopowders with 2 different compositions.
Materials and Methods
Nanocrystalline ceria powders, doped with 10 and 20 mol% of gadolinium (Ce0.9Gd0.1O1.95 and Ce0.8Gd0.2O1.9) were synthesized using cerium nitrate as oxidizer and citric acid as fuel, in which the citrate is the complexing polyfunctional hydroxyl agent (35). Commercial cerium (III) nitrate hexahydrate (Ce(NO3)3∙6H2O; 99+% purity) and gadolinium nitrate hexahydrate (Gd(NO3)3∙6H2O; 99.9+% purity) were used as precursors. Metal nitrates were added to distilled water accurately to obtain the required stoichiometric ratio, and mixed at room temperature until full dissolution was observed. Afterwards, citric acid monohydrate (C6H8O7∙H2O; >99.0
To obtain GDC pellets, nanopowders were uniaxially pressed at 20 MPa in the shape of disks and sintered at 1500°C for 3 hours. A hydrostatic balance was used to measure density of sintered pellets. A TA Instrument SDT2960 (reference: Al2O3, atmosphere: nitrogen) was used for thermal analysis (TG/DTA) of 10 mg of dried gels. Textural analyses were performed by using a Thermoquest Sorptomatic 1990 (Fisons Instruments). Specific surface area was calculated by using the Brunauer-Emmett-Teller (BET) method, and cryogenic isotherms (77 K) obtained for nitrogen adsorption/desorption. The microstructural nature of the fresh gels was ascertained using a Panalytical X'PERT MPD X-ray diffractometer (CuKα radiation, 2θ range 5°-80°). Spectroscopic analysis of dried and heat-treated samples was performed by Fourier transform infrared analysis (FTIR) in a diffuse reflectance sample cell. A Nexus Nicolet spectrometer, with a DTGS-KBr detector, was used. A transmission electron microscope (TEM; FEI Tecnai G2 Spirit Twin) was used for particle size and morphology determination. Scanning electron microscopy (SEM) and energy-dispersive X-ray spectroscopy (EDS) techniques were used to determine grain microstructure and quantitative composition. The microscope used for these analyses was a QUANTA 200 FEG (FEI) equipped with a INCAx-Act module (Oxford Instruments). Finally, electrochemical impedance spectroscopy (EIS) was used for electrochemical characterization, in the range 600°C-800°C. A Solartron 1260 frequency response analyzer (FRA), with a Solartron 1296 dielectric interface was used. The frequency was varied between 0.2 and 2 MHz with a 100-mV alternate signal, and ZPlot-Zview software was used for fitting.
Results and discussion
In the as-prepared gels, the thermogravimetric analysis/differential thermal analysis (TGA/DTA) curves in Figure 1A show that combustion/sol-gel reactions took place in 2 steps, as suggested by the large weight loss related to exothermic peaks. The color of the sample turned from light-yellow to light-brown, due to thermal decomposition of amorphous precursors. Courty et al (36) suggested that the oxidation/decomposition of the citrate-nitrate complex, formed during the sol-gel reaction, may be explained by a simplified equation involving nitrate ions and citric acid as follows:

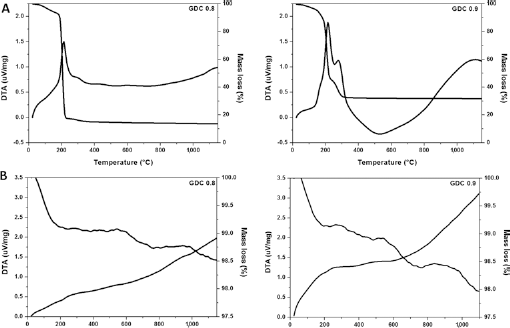
Thermogravimetric analysis/differential thermal analysis (TGA/DTA) curves for gadolinium-doped ceria (GDC) powders: (
The largest amount of weight loss occurred below 200°C. This behavior is ascribed to the presence of organic and nitrate ligands (35-36-37). Over 200°C, the weight loss is mainly due to the combustion of citric acid, not reacted with during synthesis (38), and the causes will be discussed below. At 600°C, the elimination of organic residues is almost completed; thus this represents the appropriate calcination temperature for powders. To obtain crystalline nanopowders, the gel was dried at 250°C for 1 hour and then calcined in air for 3 hours at 600°C. The curves in Figure 1B confirm that calcined powders had negligible weight loss.
From textural analyses, the specific surface areas, corresponding to calcined GDC powders, were 29.49 and 27.43 m2/g, with a relative error <3%, for Ce0.8Gd0.2O1.9 and Ce0.9Gd0.1O1.95, respectively. The diameter of the primary particles was evaluated using the correlation reported in Prasad et al (39): D = 6000/(ρ∙S), where D is the equivalent spherical diameter of the particles (in nm), ρ is the theoretical density (7.159 g/cm3) and S represents the BET surface area (m2/g). According to this correlation, the primary particle sizes of calcined powders were 28 and 30 nm for Ce0.8Gd0.2O1.9 and Ce0.9Gd0.1O1.95, respectively. If we compare the primary particle size with the crystal size (summarized in Table I), calculated by X-ray diffraction (XRD), the differences are related to the redox step of synthesis: during combustion, Ce2O3 is reduced to CeO, releasing additional heat. This heat tends to agglomerate forming particles, so that a local sintering takes place. The formation of agglomerates is demonstrated by the TEM micrographs in Figure 2. When gadolinium is present as dopant, the substitution between Gd3+ ions and Ce3+ ions in the lattice limits the oxidation of Cerium to Ce4+ and so the heat release (30).
Crystal sizes of calcined and dried samples
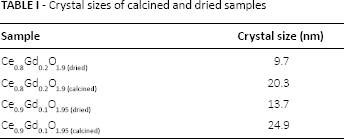
Transmission electron microscope (TEM) micrographs for gadolinium-doped ceria (GDC) powders: (
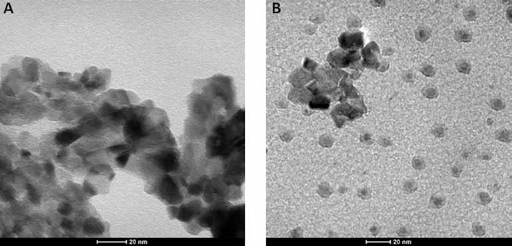
The high crystallinity of thermally treated powders was assessed by XRD analysis. Spectra in Figure 3A indicate that before thermal treatment, all powders exhibited an amorphous behavior. After drying and calcination, each sample displayed reflections corresponding to the RX2 crystal structure of CeO2. In Figure 3B, spectrum peaks are identified as the crystallographic directions (spectrum peaks 111, 200, 220, 311, 222, 400, 331 and 420) (2, 37, 38). No peaks for the gadolinium oxide were detected. The absence of gadolinium oxide peaks indicates that Gd+3 cations largely replaced Ce3+ and Ce+4 cations in the lattice.
X-ray diffraction (XRD) patterns of gadolinium-doped ceria (GDC) powders: (
Figure 4 shows FTIR spectra of calcined and dried powders, in the wavelength region of 4,000-400 cm−1. A relatively broad band, centered around 3,440 cm−1 for calcined samples and 3,404 cm−1 for dried ones, was addressed to the –OH bond stretching vibration. After calcination at 600°C, the –OH band intensity decreased significantly. In the calcined samples, –OH groups were present due to moisture adsorption. Bands at 1,624 cm−1, for dried samples, and at 1,635 cm−1, for calcined samples, correspond to the bending mode of hydroxyl groups of adsorbed water. Peaks observed in the 850-400 cm−1 region are characteristic of Ce–O bond vibration (40). Before calcination, strong bands at 1,381 cm−1 and 1,454 cm−1 are visible. The first one is assigned to the vibration mode of NO3− groups, while the second one is assigned to the stretching of the CO3−2 groups. The presence of carbonate groups may be due to a secondary reaction between nitrates and carbon dioxide, which occurred in parallel to the above-mentioned oxidation/decomposition. A possible equation is the following:
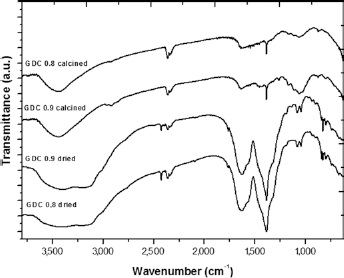
Fourier transform infrared analysis (FTIR) spectra of gadolinium-doped ceria (GDC) powders dried and calcined.

Assuming that citrate oxidation and nitrate decomposition are complete, NO and CO2 are formed from the citrate reaction, thus part of the CO2 can react with nitrate ions to form CO32- and NO2 (28). This secondary reaction explains the presence of unreacted citric acid, thus limiting the complete combustion of nitrates. The chemical description of the citrate-nitrate combustion is not unique. For instance, in the reaction products, the oxidation state of nitrogen may vary from 2+ (NO) to 4+ (NO2), and undesired phases, as carbonates, may form.
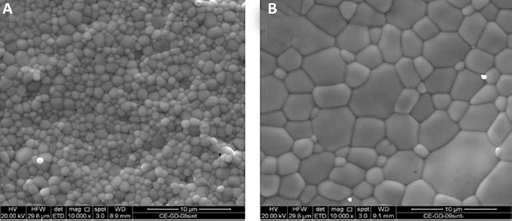
Figure 5 shows micrographs of samples sintered at 1500°C with dwell time of 3 hours. Micrographs visibly show that the microstructure is very dense and no intergranular pores are present. Grain size of the GDC0.9 sample is larger than that of GDC0.8. In Figure 6, a SEM micrograph of Ce0.8Gd0.2O1.9 and the related EDS spectrum elements map for Ce and Gd is reported. This figure shows the perfect homogeneous distribution of these elements. The EDS quantitative results, summarized in Table II, show the composition of both samples, as a stoichiometric check.
Chemical compositions of sintered samples analyzed by EDS
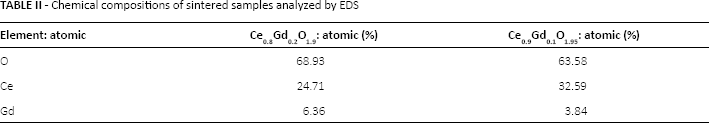
Scanning electron microscopy (SEM) micrograph for gadolinium-doped ceria (GDC) pellets: (
Scanning electron microscopy (SEM) micrograph of gadolinium-doped ceria 0.8 (GDC0.8) with energy-dispersive X-ray spectroscopy (EDS) spectra for Ce and Gd.
In Figure 7, the Nyquist plots of GDC systems, in the temperature range of 650 °C-800°C, are shown. A large semicircle, due to electrode application, is visible, while a tiny semicircle, at high frequencies, represents the bulk and grain boundary contribution to total conductivity (41). The Arrhenius plots for conductivity of GDC0.8 and GDC0.9 are shown in Figure 8. The dependence of log(σT) vs. 1/T is perfectly linear, with a maximum at 800°C for GDC0.8 of 5∙10−2 S∙cm−1. Total ionic conductivity values, in the temperature range of 600°C-800°C, are listed in Table III. Electrical properties increased with dopant content because the presence of gadolinium in the lattice increased the local concentration of anion vacancies, leading to a slight increment in their mobility. When dopant concentration was low, the average distance between defects was large, and each oxygen vacancy was trapped and immobilized inside the defect complex, resulting in low oxygen ion conductivity. With increasing Gd3+ doping content, the defect complexes began to overlap one another. The effective carrier concentration and the migration path for oxygen ion vacancies, through these defect complexes, consequently increased with an associated increase in conductivity (42). The appearance of a maximum in the oxygen ion conductivity of GDC was thus due to increased trapping vacancies as the concentration of gadolinium dopant increased. In fact as the dopant concentration increased, the distorted region decreased in size, as the disorder became dominant by aggregates of cluster (43). The slope of the Arrhenius plots gives the value of activation energy. Activation energy, density and relative density are reported in Table III.
Total ionic conductivity, activation energy, density and relative density for GDC samples
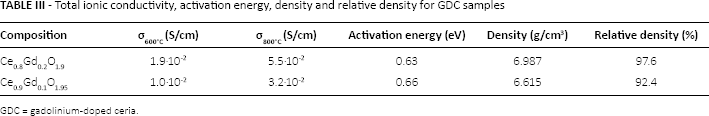
GDC = gadolinium-doped ceria.
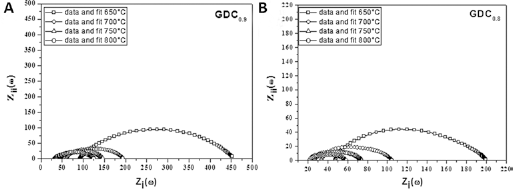
Nyquist plots for gadolinium-doped ceria (GDC) pellets: (
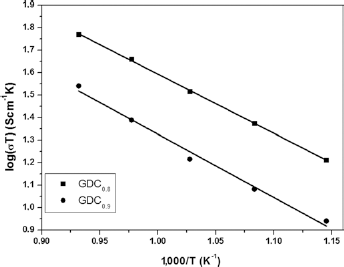
Arrhenius plots for gadolinium-doped ceria 0.8 (GDC0.8) and GDC0.9.
Values in the range 92%-97% were attained for relative density. Activation energy for GDC systems is typically 0.8 eV, while, in this work, values of 0.63 eV and 0.66 eV, for Ce0.8Gd0.2O1.9 and Ce0.9Gd0.1O1.95, respectively, were observed. The nature of the samples and type of synthesis strongly affected the morphology of sample and electrochemical behavior. Activation energy values less than 0.8 eV have been achieved in literature, especially if materials are prepared by sol-gel synthesis (42-43-44-45-46).
Conclusions
Nanocrystalline powders, with high purity, were obtained in this work. TGA/DTA analyses suggested drying at 250°C and calcination at 600°C. Primary particle size decreased as gadolinium content increased, while surface area increased as gadolinium content increased. As a consequence, the microstructure of GDC pellets was dense and composed of high-packed spherical grains, with a narrow size distribution, due to ease of sintering. The purity of GDC powders can be compromised by formation of undesired phases due to a secondary reaction. An excess of citric acid is useless, and the molar ratio of 1:1 used in this work is preferable. The excellent results of EDS analysis, for chemical composition of the sintered samples, confirmed that sol-gel synthesis is an process eligible for large-scale production. The GDC pellets prepared by the sol-gel combustion method developed in this work had preferable electrical properties. Gadolinium content influenced the total ionic conductivity, with increasing Gd3+. Results show that ceria doped with 20 mol% has the highest total ionic conductivity, and activation energy values less than 0.8 eV were achieved, essentially due to the sol-gel synthesis. In conclusion, the sol-gel synthesis used in this work can be applied to obtain improved electrochemical behavior of GDC electrolytes.
Footnotes
Financial support: The authors acknowledge the Poligrid Project (CUP B65B09000020007) for financial support for their research.
Conflict of interest: All authors declare no conflict of interest.