
Abstract
Purpose
The aim of this study was to test a hypothesis that fatigue-induced weakening of cortical bone was intensified in bone incubated in glucose and that this weakening is revealed in the microstructure and mechanical competence of the bone matrix.
Methods
Cubic specimens of bovine femoral shaft were incubated in glucose solution (G) or in buffer (NG). One half of G samples and one half of NG were axially loaded in 300 cycles (30 mm/min) at constant deformation (F); the other half was a control (C). Samples from each group (GF, NGF, GC, NGC) were completely demineralized. Slices from demineralized samples were used for microscopic image analysis. A combined effect of glycation and fatigue on demineralized bone was tested in compression (10 mm/min). Damage of samples during the test was examined in terms of acoustic emission analysis (AE).
Results
During the fatigue procedure, resistance to loading in glycated samples decreased by 14.5% but only by 8.1% in nonglycated samples. In glycated samples fatigue resulted in increased porosity with pores significantly larger than in the other groups. Under compression, strain at failure in demineralized bone was significantly affected by glucose and fatigue. AE from demineralized bone matrix was considerably related to the largest pores in the tissue.
Conclusions
The results confirm the hypothesis that the effect of fatigue on cortical bone tissue was intensified after incubation in glucose, both in the terms of the mechanical competence of bone tissue and the structural changes in the collagenous matrix of bone.
Introduction
Bone tissue is a brittle material and its resistance against fracture is derived from microcracks that absorb energy and delay the fracture propagation (1, 2). The role of microdamage accumulation in the impaired mechanical properties of bone has been intensively investigated and the studies have revealed that mechanisms of bone failure are dramatically dependent on the effectiveness of energy dissipation within the tissue (3-4-5-6). An increasing number of studies underline a crucial role of the collagenous matrix microstructure for energy absorbed in bone during deformation and for fracture toughness (3, 7-8-9-10-11). It is thus expected that studies on relations between fatigue-induced weakening and the microstructural features of bone matrix will be valuable for understanding bone fractures related to aging, excessive loading, or impaired bone metabolism.
There is a growing body of literature indicating that a high incidence of bone fracture in diabetes can result from changes in collagen structure attributable to the accelerated accumulation of glycation products that influence the mechanical integrity of bone (12-13-14-15). Glycation, a process of the nonenzymatic bonding of sugars with proteins, occurs spontaneously in tissues of living organisms but is markedly accelerated by hyperglycemia. As a consequence, collagen in the tissues is more rigid, less soluble, and less susceptible to enzymatic digestion (16).
Glycation products have been shown to alter morphology, microfracture formation, and fracture resistance of cancellous bone (15, 17-18). An impact of glycation on mechanical properties was not as explicit in cortical bone as it was in cancellous bone. Mechanical properties of cortical samples in bending were not influenced by incubation in glucose solution (19), while incubation in ribose revealed a significant decrease of postyield strain and flexural toughness (20), even though in an earlier experiment the bending properties of ribated cortical bone were not affected (21). However, glycation in ribose was shown to significantly affect the mechanical behavior of cortical bone under axial loads (8, 22). Thus, a deeper insight into glycation-induced modifications of bone collagen properties could provide better understanding of fracture risk in diabetes. Even though the most popular model of bone glycation uses ribose, which produces stable glycation end-products relatively quickly, the most physiologically adequate model of glycation requires the use of glucose, despite the long incubation periods needed to achieve a significant number of cross-links (23).
The aim of the present study was to test a hypothesis that a fatigue-induced weakening of cortical bone was intensified after its incubation in glucose. A particular question addressed in the study was to assess to what extent this weakening of bone tissue is revealed in the microstructure and mechanical competence of demineralized bone matrix.
Material and methods
A total of 64 cubic specimens (5 × 5 × 5 mm) were wet-machined from anterio-medial aspects of femoral shafts from a 12-month-old calf. Samples were grouped in 32 pairs from adjacent locations (Fig. 1).
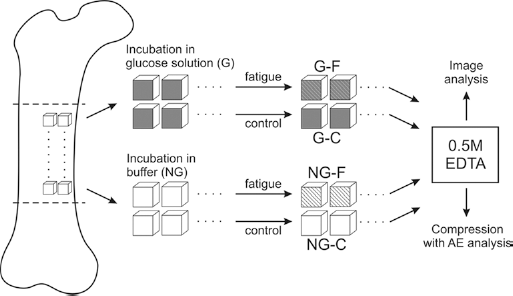
Diagram showing sample preparation.
Glycation
One sample (G) from each pair was incubated in 37°C for 33 days in 0.133 M glucose solution in Hank's buffer/1.3 mM CaCl2 supplemented with 5 mg/10 mL of gentamicin as prevention against bacterial growth. It was shown previously (23) that stable advanced glycation end-products in fibrous collagen are detectable just after 1 month of incubation in glucose. Even though the effectiveness of glycation rises with increasing time, the longer incubation periods seem to be of lower physiological importance because of the relatively fast metabolic turnover of bone tissue (12, 16). Control samples (NG) were incubated in a buffer solution under the same conditions but without glucose.
Fatigue pretreatment
One half of glucose-incubated samples (GF) and one half of buffer-incubated (NGF) ones were axially loaded in 300 cycles to 0.25 mm deformation at 30 mm/min using a Lloyd LRX machine with a 2500 N load cell (Lloyd Instruments, Bognor Regis, UK). The fatigue procedure parameters were established in a preliminary experiment aimed at obtaining significant fatigue (more than 5% of force decrease observed in 3 subsequent samples) without destroying the samples.
The effectiveness of the fatigue procedure was estimated by comparing average force at 0.25 mm deformation for the initial 10 cycles with the average force for the last 10 cycles both in glycated and nonglycated samples.
A total of 16 glucose-incubated samples and 16 buffer-incubated ones were left without fatigue (groups GC and NGC, respectively). Consequently, after the fatigue procedure there were 4 groups of samples (GF, NGF, GC and NGC), 16 samples in each.
Demineralization
From each group, 8 samples were completely demineralized (groups-D) for 5 weeks in 0.5 M EDTA (ethylenediaminetetraacetic acid) (24). Completeness of demineralization was checked by ashing test samples from the same femoral shaft in a muffle furnace at 620°C for 16 h (25) after 3, 4 and 5 weeks in EDTA.
Image analysis
One sample from each demineralized group was used for image analysis. Slices 100 μm thick were cut from each cube using a Vibratome VT 1000S (Leica Biosystems, Buffalo, IL, USA) and stained according to Mayer's hematoxylin & eosin procedure. Images were acquired with use of a confocal scanning laser microscope (FluoView300; Olympus, Tokyo, Japan) with a UPlanSApo 4×/0.16 objective, giving a resolution of 2.971 µm2 per pixel. A field of observation for each image was 3.53 mm × 3.53 mm (2048 x 2048 pixels). For each sample 8 or 9 microscopic slices were analyzed.
The aim of the image processing was to separate and to quantify all empty spaces within the demineralized bone sample, regardless of their origin. The separated spaces were called “objects”. It was supposed that the objects found on the images comprise all pores, voids, fissures, and fracture spaces in the sample (Fig. 2).
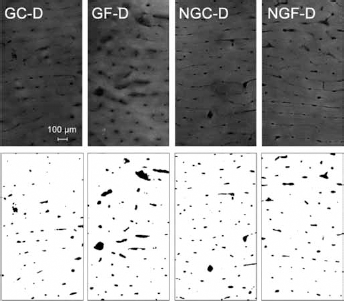
Examples of microscopic images of demineralized bone samples
Gray-scale images (0-255 scale) were processed using a protocol developed in Matlab R2010a (MathWorks, Natick, MA, USA). The procedure described in detail in (26) involved series of image enhancements, followed by the segmentation based on the gray-level threshold. For each object, 2 parameters were calculated: area (A) and elongation (E). The area was calculated from the number of pixels within the object, considering that 1 pixel corresponded to 2.971 μm2. Elongation was defined as a ratio of the semi-major to the semi-minor axis of the ellipse that has the same normalized second central moments as the separated region (27).
The average values of the geometric parameters for objects from all slices were calculated in each group. Moreover, the pore surface area was calculated as a sum of the areas of objects in the field of observation divided by the total area observed for each bone slice. Additionally, the distribution of parameter values was examined on the basis of a probability density analysis.
Compression of demineralized samples
From each group, 7 demineralized bone samples were subjected to unconfined compression (Lloyd Instruments, Bognor Regis, UK) at a speed of 10 mm/min. The beginning of compression was determined for force passing 0.1 N. The sample compression direction was along the long axis of the femur. The samples were compressed to failure and were characterized in terms of maximum stress and corresponding strain obtained from the strain-stress relationship.
All procedures of sample preparation and machining were performed with the samples fully wet. Samples were compressed without any preconditioning.
Acoustic emission
Gradual damage of samples during compression was examined in terms of an acoustic emission (AE) signal. The AE head was connected with the compression plate of the testing machine as previously described (28). A 4381V acoustic sensor (Bruel & Kjear, Narum, Denmark) with a maximum sensitivity in the range 1 kHz to 16 kHz was glued inside the AE head. The sensor was connected to the AE signal amplifier (EA System, Warsaw, Poland). After filtering, the signal was converted using an A/D board (PCI 9112, Adlink Technology, Taipei, Taiwan). The sampling rate was 44 000 samples/s at a resolution of 16 bits/±1.25 V. An analog signal of force delivered from the testing machine, used in order to trigger both measurements simultaneously, was recorded by the second channel of the A/D board.
The AE event number and AE energy were counted every 0.1 s during the entire test as described in Trebacz et al (22, 28). Cumulative values of AE energy were calculated for each sample from the start of compression to 90% of maximum load. AE cumulative energy and average energy per event were used as acoustic emission descriptors for the sample.
Statistical Analysis
The effectiveness of the fatigue procedure was estimated using paired t test. Results of image analysis and compression of demineralized bone samples were analyzed in terms of 2-way ANOVA, where glycation (G vs. NG) and fatigue (F vs. C) pretreatment were considered as factors. ANOVA was followed by post hoc Tukey analysis for differences between specific pairs of groups. Statistical tests were performed using Statistica 10 (StatSoft, Tulsa, OK, USA). The 5% level of significance was applied for all tests.
Results and discussion
Fatigue procedure
In the initial phase of fatigue test, the bone samples incubated in glucose were significantly more rigid than the samples incubated in the buffer (Fig. 3). The average force during the 10 initial cycles of loading in glycated bones was 10.6% higher than in nonglycated ones (P =.0377).
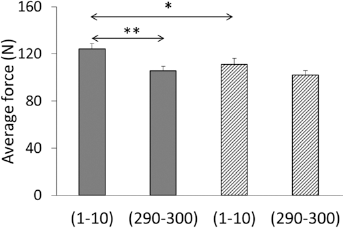
Average force at 0.25 mm deformation for 10 initial (1-10) and 10 last (290-300) cycles of fatigue loading in cortical bone samples incubated 33 days in glucose solution (
Even though stiffness of bone under compressive loads is provided primarily by the presence of mineral, the presence of soft and compliant collagen fibrils plays a considerable role for bone susceptibility to deformation (9, 10). In bone, the possibility to transfer loads between collagen fibers is very limited as crosslinks between and within fibers are not numerous and exist mainly at terminal parts of collagen subunits (16). Sugar-derived bonds created in the process of nonenzymatic glycation are located in helical parts of collagen molecules (16), which can stiffen the bone matrix. Stiffening of glycated bone was shown experimentally both in cortical and cancellous bone tissue (8, 18).
Loss of stiffness caused by 300 cycles of dynamic loads was significant only in the bone samples incubated in glucose. The compressive force decreased by 14.5% (P =.0018), as compares to insignificant (P>.05), 8.1% decrease in buffer-incubated ones. So, the fatigue procedure applied in the experiment was not sufficient to significantly change the properties of the control samples, however the samples incubated in glucose were significantly weakened.
A glycation-related increase in fatigue microcracks was previously found in cancellous bone samples (15, 17). As concerns compact bone, Nalla et al (2, 7) noted that even slight and local changes in the cross-links within collagen fibers may affect a pattern of stresses during dynamic loads, resulting in an increase of tissue microdamage.
Demineralization
Demineralization was found to be complete not earlier than after 5 weeks in EDTA, when test samples were annealed with no residuum. Demineralization resulted in a slight change in dimensions of initial bone cubes (-0.13 ±.08 mm), so that after the process the samples were not regular cubes but parallelepipeds. However, the impact of glycation and fatigue on average dimensions of samples in groups was statistically insignificant in terms of 2-way ANOVA (P = .187).
Image analysis
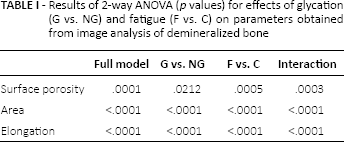
Microscopic images revealed similar plexiform structure in all samples (Fig. 2), however quantitative parameters obtained from the image analysis were significantly influenced by the sample pretreatment (Tab. I). The t.otal pore surface area was significantly influenced by both factors: glycation (G vs NG) and fatigue (F vs. C). Moreover, interaction between both factors was significant (P =.0003), which indicates that the impact of fatigue on bone porosity was dependent on the sample pretreatment (glucose solution or buffer).
Results of 2-way ANOVA (p values) for effects of glycation (G vs. NG) and fatigue (F vs. C) on parameters obtained from image analysis of demineralized bone
A one-by-one comparison between the groups with a post hoc Tukey test showed that after fatigue, surface porosity in the glycated group (GF-D) was considerably larger than in the nonglycated (NGF-D) one (Fig. 4). In the nonglycated samples the surface porosity was not influenced by the applied fatigue procedure (NGC-D vs. NGF-D). In the nonfatigued samples the surface porosity in the glycated group (GC-D) was significantly lower than porosity of nonglycated (NGC-D) one.
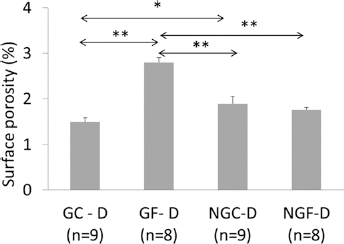
Total pore surface area obtained from microscopic images of demineralized (D) bone from fatigued (F) and control (C) samples in glycated (G) and nonglycated (NG) bone; n = number of microscopic slices analyzed in the group; *P<.05, **P<.01; P values from post hoc Tukey test.
The impact of glycation and fatigue on bone matrix was significant also in terms of the geometric parameters referring to the area and shape of objects on the image (Tab. I). Moreover, there was a significant interaction between both factors (glycation and fatigue) for pore descriptors indicating that the effect of fatigue on the size and shape of pores was dependent on glycation.
The average values of the geometric parameters of pores are presented in Figure 5. In glycated samples, fatigue resulted in larger and less elongated objects than in the other groups. The post hoc Tukey test revealed that in the nonglycated samples, the geometric parameters of pores in the fatigued and control groups did not differ significantly (NGF-D vs. NGC-D). In the nonfatigued samples, glycation resulted in significantly smaller and less elongated pores than in the nonglycated ones (GC-D vs. NGC-D).
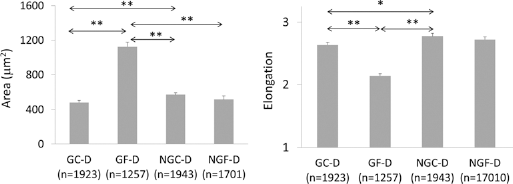
Average area and elongation of pores on microscopic images of demineralized (D) bone from fatigued (F) and control (C) samples in glycated (G) and non glycated (NG) bone; n = number of objects analyzed on microscopic slices; *P<.05, *P<.01; p-values from post hoc Tukey test.
The geometry of the objects on the microscopic images of bone matrix was also analyzed in the terms of probability density (Fig. 6). Small objects with the surface area of 120 μm2 to 140 μm2 and elongation of 1.6 to 1.7 were the found the most frequently in each group. However, occurrence of large objects (area >1000 μm2), calculated from the area under the curve, was different among the groups. In glycated fatigued samples (GF-D) there was 16.7% of objects of this size, compared to 9.4%, 7.8%, and 6.3% in NGC, NGF, and GC-D, respectively. Moreover, in the GF-D group there was only 1% probability of finding narrow fissures with an elongation larger than 5, compared to 5% to 7% in the other groups.
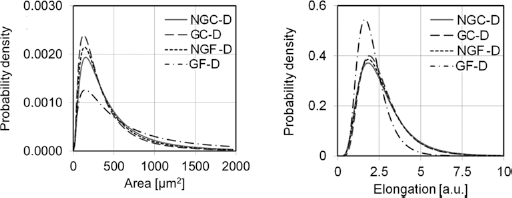
Probability density distribution for geometric parameters obtained from image analysis of decalcified bone samples; NGC-D = nonglycated control; GC-D = glycated control; NGF = nonglycated fatigued; GF-D = glycated fatigued.
It is generally accepted that fatigue loading produces small objects in the form of micro-damages (1, 7, 11) that tend to appear at edges of typical stress concentrators in bone-tissue-like canals and voids (2, 3, 7, 29). The fatigue procedure applied in this study was not sufficient to cause significant changes in microscopic image of bone matrix in samples incubated in buffer, but in samples incubated in glucose the matrix was changed significantly after fatigue. Surface porosity in glycated samples increased, along with changes in the size and shape of individual objects in the processed images. One can presume that in the present experiment, fatigue of glycated samples resulted in an enlargement of existing pores and/or fusion of neighboring pores, rather than in creating new, separate objects.
On the other hand, the porosity and average area of the pores in the demineralized matrix of glycated, nonfatigued samples (GC-D) was significantly lower compared to nonglycated ones (NGC-D). It is presumable that sugar residues bonded to collagen molecules made them closer, even though during 33 days of incubation in glucose only a fraction of glycation products could be transformed to stable glycation cross-links (24). A denser arrangement of collagen molecules in glycated bone could account for the fact that after a cycle of compressive loads, glycated samples still exhibited stiffness similar to nonglycated ones (Fig. 3), despite significantly larger porosity (GF-D vs. NGF-D on Fig. 4).
The image analysis was focused on the overall quantitative estimation of all pores and fissures observed on the microscopic slices of demineralized bone without investigation of their nature. It was presumed that all objects found in images were present before demineralization, whether as a result of natural processes, or induced by sample pretreatment. Any change in microstructure of the organic matrix in bone should be reflected in a change in size and/or shape of these objects. The matter of discussion is how much the shape and size of objects in microscopic image reflects the shape and size of pores in native bone. Demineralization of cortical bone can cause small, anisotropic displacements of collagen layers (4). Since dehydration is a part of the staining procedure, it decreases the collagen diameter (30), but it did not create additional damage in the bone tissue (31). Therefore, both demineralization and dehydration can influence the size of collagen fibers and the voids between them. However, there is no reason to presume that the procedures themselves would create new voids within the organic matrix.
Compression and acoustic emission
Demineralized bone samples deformed nonlinearly until final failure (Fig. 7). The maximum load for individual samples was in the range from 355 N to 790 N, with no significant differences between the groups. In all samples, AE was recorded throughout the tests in the form of discrete bundles of events with different energy.
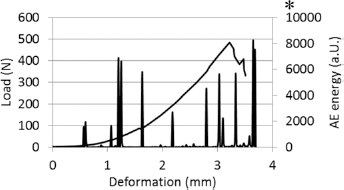
An example of deformation: load curve and acoustic emission signal (AE) recorded during loading for a demineralized bone sample from the control group (NGC-D); the continuous line refers to load and the vertical spikes to AE energy; the fracture point is denoted by the asterisk.
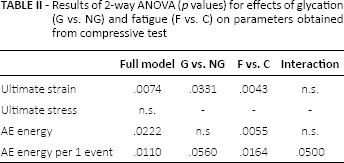
In samples of demineralized bone matrix, both fatigue and glycation had an independent significant impact on strain at failure, while the ultimate stress was not influenced by treatment procedures (Tab. II).
Results of 2-way ANOVA (p values) for effects of glycation (G vs. NG) and fatigue (F vs. C) on parameters obtained from compressive test
It was shown in previous experiments that deformability of bone matrix was affected by incubation in ribose; ribated samples were stiffer and revealed reduced ductility compared with nontreated controls (8, 22). In the present study, the strain at failure was significantly reduced both by glycation in glucose and fatigue, which was the lowest in the glycated fatigued group (Fig. 8). However, the effect of fatigue was more significant than the effect of glycation, both in terms of 2-way ANOVA (Tab. II) and post hoc Tukey test for differences between pairs of groups (Fig. 8).
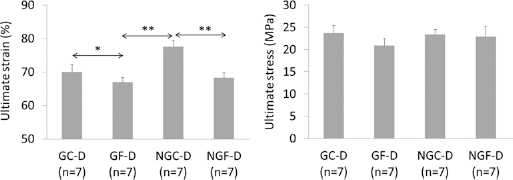
Results of compressive test for demineralized (D) bone from fatigued (F) and control (C) samples in glycated (G) and nonglycated (NG) bone; n = number of samples in the group; *P<.05, **P<.01; P values from the post hoc Tukey test.
In the demineralized matrix of nonglycated bone samples, strain at failure in the fatigued group (NGF-D) was significantly lower than in the control (NGC-D), which corresponds to a dependence between fatigue-related microcrack accumulation and the declining mechanical properties of cortical bone (1, 7, 11, 29).
However, there were no significant differences between NGC-D and NGF-D regarding the results of image analysis (Figs. 4 and 5). This result points to the main limitation of our study. The image analysis procedure did not reveal the smallest microfractures and diffuse damage of cortical tissue, which are the earliest microscopic indicators of bone fatigue (1-2-3, 7, 11, 29, 31).
Another important issue that should be raised here is if our results are applicable to human bone. Some differences are expected between the behavior of human bone and the bovine bone studied here, because of its plexiform microstructure. Haversian and plexiform bone differ in density, porosity, and pattern of strains, however, the main ultrastructural unit – mineralized collagen fibril – is the same. Glycation-induced changes in bone tissue occur at the level of collagen molecules and fibrils (12, 16), hence at a level finer than the microstructural. Damage of bone is initiated at the ultrastructural level prior to the appearance of microscopic cracks (1). Moreover, in all types of bone the basic fractural element is provided by mineralized collagen fibril (29). Therefore, in spite of all limitations, it is presumable that results of the present study provide a contribution to understanding the effects of glycation on bone tissue.
The effects of incubation in glucose on bone samples were also analyzed in the terms of acoustic emission (AE) generated from bone as a result of local dynamic dislocations and redistribution of stresses in the loaded sample. Two-way ANOVA revealed that AE from the demineralized samples was significantly influenced by treatment procedures (Tab. II). However, the only significant factor was fatigue. The impact of glycation was marginally significant (P = .056) in terms of AE energy per AE event. AE energy from glycated fatigued samples (GF-D) was significantly larger than from the glycated controls (GC-D) and nonglycated controls (NGC-D) (Fig. 9). In the GF-D group there was also the largest value of AE energy per AE event. In the glycated control samples (GC-D) AE energy per event was significantly lower than in the nonglycated control (NGC-D) and nonglycated fatigue samples (NGF-D).
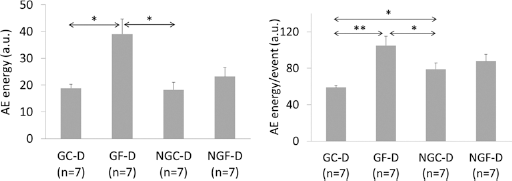
Acoustic emission descriptors for demineralized (D) bone under compression; fatigued (F) and control (C) samples from glycated (G) and nonglycated (NG) bone; n = number of samples in the group, *P<.05, **P<.01; P values from post hoc Tukey test.
The amount of energy released by AE as well as the energy of individual AE events is related to the magnitude and propagation of the emission source events (32, 33). Applications of AE analysis in bone research are generally focused on the relationship between signals and failure mechanisms (28, 32-33-34-35-36) and AE signals from bone were usually attributed to microcrack formation and propagation (33-34-35-36). However, AE can be also be generated from sources including friction or debonding between phases of the material (37).
In demineralized bone samples from all groups, a continuous emission of acoustic signals in a form of more or less regular occurrences of different energy was recorded during the entire range of deformation. It is presumed that shifting and friction between soft and compliant collagen layers will create a lot of small AE events, while large signals are produced during microfractures or discrete crack jumps resulting from gradual separation and debonding of collagen lamellae.
AE released during compression to failure of demineralized bone matrix was considerably related to the size of voids and pores in the tissue. The highest level of AE energy as well as the energy of individual AE events were found in glycated fatigued samples (GF-D) with the highest porosity, average size of pores, and percentage of large pores. In contrast, the lowest values of AE descriptors were recorded in the group GC-D with the smallest porosity and the smallest pores’ size.
Concluding remarks
The present study demonstrates that products from the reaction of collagen with glucose lead to structural changes in the collagenous matrix of cortical bone subjected to fatigue loads. This can result in impairment of the supportive function of the bone and a rising risk of bone fractures. Resistance of bones to fractures depends on their material and structural properties controlled by continuous bone remodeling. It was shown previously that products of nonenzymatic glycation inhibit collagen digestion and influence the processes of bone metabolism (12, 16, 38, 39). Therefore, it is presumed that glycation-related changes in the physical properties of collagen result both in temporary modifications of the mechanical parameters of bones and their potential to resist fatigue loads as well as in disturbance to the physiological remodeling of the bone tissue, leading to the accumulation of microdamage. This can be one of reasons of widely reported increased fracture risk in diabetic patients (12, 13, 40, 41).
The results of our study confirm a hypothesis that the effect of fatigue on cortical bone tissue was intensified after incubation in glucose. It was shown that even nonintensive fatigue cycles, without considerable effect on bone stiffness, significantly influenced the structure and deformability of organic matrix in bone samples incubated in glucose solution.
Footnotes
Financial support: This study was financially supported by the Polish Ministry of Science and Higher Education, Grant number N N507 275036.
Conflict of interest: None to declare.